

Abstract
Unlike the well-defined TH2 cytokine locus, little is known regarding regulatory elements that govern expression of Ifng, which encodes the signature TH1 cytokine interferon-γ. Evolutionary analysis revealed that the murine Ifng locus diverges from the ancestral locus due to structural rearrangements that delete the neighboring Il26 gene and disrupt synteny 57 kb upstream of Ifng. Proximal to this disruption, we identified by high-resolution mapping multiple regions with CD4+ T cell subset-specific epigenetic modifications. A subset of these regions were enhancers, while some blocked the activity of upstream enhancers or insulated Ifng from neighboring chromatin. These findings suggest that proper expression of Ifng is maintained through the collective action of multiple distal regulatory elements present in a ∼100 kb region flanking Ifng.
Interferon-γ (IFN-γ) is produced in response to viral or intracellular bacterial infection and functions to activate macrophages, increase major histocompatibility complex (MHC) molecule expression and exert direct antiviral activity on infected cells. While natural killer (NK) and CD8+ T cells are programmed to rapidly produce IFN-γ upon activation, CD4+ T cells can adopt varied programs of effector function. The T helper 1 (TH1) and TH2 lineages are the most well characterized CD4 programs: TH1 effectors produce large amounts of IFN-γ, while TH2 effectors produce little IFN-γ but large amounts of interleukin 4 (IL-4), IL-13 and IL-5. Proper cytokine expression and commitment to these lineages is primarily regulated at the level of transcription, with the transcription factors T-bet and GATA-3 dictating the commitment to TH1 and TH2 lineages, respectively1–4. T-bet directs this commitment by repressing GATA-35,6, remodeling the Ifng locus, aiding in transcription of Ifng7, and inducing expression of IL-12Rβ28 and the transcription factor Hlx9.
The signaling events and transcription factors that drive IFN-γ expression have been elucidated in considerable detail, but relatively little is known regarding where and how they act2,10. Transgenes containing the Ifng promoter, introns and up to 3.4 kb of 5′ flanking sequence do not confer proper T cell subset-specific expression in vivo11–13. By contrast, a 191 kb bacterial artificial chromosome transgene containing the human IFNG gene and 90–95 kb of flanking sequence results in high-level, TH1-specific IFN-γ production13. This result suggests that distal transcriptional regulatory elements are required for proper expression, the necessary elements are present within this extended region, and that elements from the human IFNG locus are sufficiently conserved to function properly in mice.
Distal regulatory elements aid in chromatin remodeling to establish and maintain lineage-specific programs of gene expression and are often highly conserved among species. Enhancers are necessary for high-level gene transcription, whereas silencers inhibit gene expression and may serve as foci that initiate permanent silencing in non-expressing cell types. The separation of genomic DNA into domains with distinct gene expression patterns is thought to be mediated, at least in part, by boundary elements14,15. Boundary elements include insulators, which act as barriers to restrict the spread of repressive heterochromatin, and enhancer-blocking elements that shield genes from the long-range effects of enhancers or silencers associated with adjacent genes10,16. Regulatory elements are usually located within 50–75 kb of the gene they regulate, but can be located up to several hundred kilobases away, and are commonly found in open chromatin, where transcription factors and other protein mediators are able to access specific DNA sequences to control gene expression. Thus, in addition to sequence conservation17, focal changes in chromatin structure and DNA methylation have been used to predict the location of distal regulatory elements within gene loci10,18.
In this study, we have used computational, chromatin-based and functional approaches to identify distal regulatory elements that help to govern Ifng expression in CD4+ T cells. Comparative genomic analysis revealed eight highly conserved non-coding sequences (CNSs) surrounding Ifng. Using an innovative, PCR-based method to map DNase hypersensitive (HS) sites in a comprehensive and sequence-specific manner18, along with chromatin immunoprecipitation (ChIP) and DNA methylation analysis, we demonstrate distinct CD4+ T cell subset-specific epigenetic marks at and around these CNSs. A subset of these sequences enhanced IFN-γ expression in response to signals downstream of the TCR, cytokine receptors, and/or T-bet, while some acted as insulators or enhancer-blocking elements, suggesting that proper expression of Ifng is governed in part by the collaboration of multiple regulatory elements in an ∼100 kb region surrounding Ifng.
RESULTS
Conservation and divergence in the Ifng locus
To identify regulatory elements in the Ifng locus, we first performed a multi-species alignment using the mouse genome as base. Syntenic regions of mouse chromosome 10, rat chromosome 7 and human chromosome 12 are shown in Fig. 1. In each of these species, the Il22 and Mdm1 genes are located upstream of Ifng. Mdm1 is a highly conserved p53-binding protein and Il22 encodes a pro-inflammatory member of the IL-10 cytokine family. The IL26 gene, which like IL22 is a member of the IL-10 cytokine family, is located between IL22 and IFNG in humans, bony fish19 and all available mammalian genomes except rodents. In rodents, Il26 has been disrupted by a LINE insertion and an LTR-LINE-LTR insertion located 57–59 and 73–87 kb upstream of murine Ifng, respectively (Fig. 1a, Supplementary Fig. 1 online). C57BL/6 and 129/Sv mice also contain Iltifβ20, which represents an inverted duplication of the Il22 gene and is flanked on either side by six tandem repeats containing a highly conserved 1 kb core with homology to mouse chromosome 12 and human chromosome 6 (http://eichlerlab.gs.washington.edu/database.html). Downstream of Ifng there are no known coding genes for ∼420 kb, but a non-coding antisense transcript21, Tmevpg1, begins 120 kb downstream of Ifng and extends to within 61 kb of the Ifng start site.
Figure 1. Evolutionary conservation within the Ifng locus.

Alignment of 600 kb flanking the Ifng gene on mouse chromosome 10 with sytenic regions of rat chromosome 7 and human chromosome 12 shown (a) in cartoon form or (b) as peaks of sequence conservation using the UCSC genome browser (http://genome.ucsc.edu/cgi-bin/hgGateway). (a) Genes are denoted by blue arrows, indicating the direction of transcription. The stippled arrow denotes Tmevpg1, an antisense, non-coding transcript. Red horizontal lines below the human and mouse chromosomes indicate the location of a complex segmental duplication in the mouse genome (mm8, C57BL/6), shown in greater detail in Supplementary Fig. 1. The blue hatched bar denoted as ΨIl26 represents sequences homologous to exon 5 of the human IL26 gene; orange bars indicate LINE and LTR-LINE-LTR insertions described in the text. (b) The inset at the bottom indicates the location of the ∼120 kb region surrounding Ifng shown in greater detail in (c), which displays conserved exons in turquoise and conserved non-coding sequences (CNSs) with ≥ 70% identify over ≥100 bp in red. Positions of CNSs relative to the start of murine Ifng are denoted below, and murine genome coordinates are shown at either end.
Despite the striking structural differences in the Ifng locus between rodents and humans, patterns of Ifng expression in specific cell types are substantially similar in these species. This similarity indicates that regulatory elements involved in Ifng expression are not affected by these structural differences and suggests that most, if not all, such regulatory elements are likely to be not more than 57 kb upstream of Ifng. For this reason, we searched for CNSs in this region and for a similar distance downstream of Ifng. We identified eight CNSs, which are denoted by the distance of their 5′ end relative to the start of murine Ifng, and include the previously identified CNS1 and CNS2 (refs. 22,23), referred to herein as IfngCNS-6 and IfngCNS+18–20, respectively (Fig. 1c). None of these CNSs correspond to known open reading frames, suggesting that they may contain regulatory elements.
While sequence conservation is one approach by which to identify candidate regulatory elements, the correlation between conservation and function is imperfect10,17,24. Regulatory elements can also be identified experimentally through the detection of epigenetic modifications that are typical for such regions. To provide a substrate by which to determine the epigenetic profile of the Ifng locus in CD4+ T cell subsets, we isolated naive CD4+ T cells from Smarta TCR-transgenic mice and studied these cells directly ex vivo or after differentiation in vitro in TH1 or TH2 conditions for eight days (Supplementary Fig. 2 online).
Localization of DNase HS sites in the Ifng locus
Regulatory elements are commonly distinguished by a marked sensitivity to cleavage by DNase I and have traditionally been identified using the Southern transfer and indirect end-labeling approach. This technique depends on suitable positioning of restriction sites, availability of flanking probes, and does not precisely localize the hypersensitive sequences. To overcome these limitations, we employed a sequence-specific PCR-based approach, which is quantitative and localizes HS sites with a resolution of ∼225–250 base pairs18. We used this approach to search for regulatory elements in an unbiased manner over 114 kb extending upstream of Ifng to the region where synteny is disrupted and downstream to the terminus of the Tmevpg1 antisense transcript. The results are displayed in Fig. 2, in which peaks denote HS sites and peak height the degree of hypersensitivity.
Figure 2. DNase HS profiling reveals lineage-specific changes in DNase hypersensitivity.

Q-PCR was used to locate DNase HS sites in naïve, TH1 and TH2 cells. Genomic conservation and DNase HS sites are shown using the UCSC browser (http://genome.ucsc.edu/index.html?org=Mouse). Genome coordinates are indicated on the sides, conservation and LINE and LTR elements are shown along the bottom and the location of the CNSs are highlighted in yellow. Vertical peaks denote regions in which sensitivity to DNase digestion was ≥2.5 SD than the baseline, and peak heights represent the degree of hypersensitivity as numbers of SD. DNase HS sites are labeled based on their location relative to Ifng, except for sites I, II and III which are as named by Agarwal & Rao25. Strong HS sites (DNase I sensitivity >4SD greater than the baseline are denoted HS; weak HS sites (DNase I sensitivity >2.5 SD but < 4SD) are denoted hs. DNase profiling was done in two or more independent experiments for each cell subset, and composite results are shown.
Within this region, we confirmed the presence of HS sites I, II and III, located at the Ifng promoter, intron 1 and intron 3, respectively, which were previously defined in the long-term D5 TH1 cell line25. There has been some ambiguity as to whether HSI is in the promoter or proximal first intron22,25. Our studies showed HSI to be at the promoter in primary TH1 cells (Fig. 2). These 3 HS sites, particularly HSII, were weak compared to the strong HS+18 site, which coincides with the 5′ end of IfngCNS+18–20, as previously demonstrated by Southern blot23. An HS site coinciding with IfngCNS-6, demonstrated to date only in restimulated D5 cells22, was not consistently evident in primary TH1 cells.
In addition to HS+18, we detected several strong HS sites (strong HS sites are denoted as HS and weak sites as hs followed by distance in kb from the Ifng start) not identified previously. HS-22, which lies within IfngCNS-22, was detected in TH1 and TH2 cells but not in naive CD4+ T cells, a pattern similar to that of HSIII. By contrast, HS+29, which coincided with IfngCNS+29, was TH1-specific, like HS+18, HSI and HSII. Somewhat surprisingly, four strong sites, HS−40, HS−35, HS+8 and HS+26 were TH2-specific, a fifth, HS+49, was strong in TH2, intermediate in naive CD4+ T cells but just above background in TH1 cells, and a sixth, hs+53 was intermediate in naïve, weak in TH1 and absent in TH2 CD4+ T cells. By contrast to the strong HS sites detected in TH1 cells, each of which was located within a CNS, the five HS sites restricted to or strongest in TH2 or naive CD4+ T cells were adjacent to but not within a CNS (Fig. 2 and Supplementary Table 1 online). The location of these sites adjacent to CNSs may reflect nucleosome sliding or displacement from nearby or clustered regulatory elements that are employed differentially in TH1 cells versus TH2 and naïve CD4+ T cells. This pattern also held true for weak hs sites (Fig. 2) with but two exceptions: the weak TH1-specific hs+36 did not coincide with a CNS, and the TH2-specific hs+55 coincided with IfngCNS+55. These results demonstrate that the set of HS sites in TH1 cells is distinct from that in TH2 and naive CD4+ T cells, and suggest that there are multiple distal regulatory elements in the Ifng locus, which are likely to function in a CD4+ T cell subset-specific manner.
Histone modifications in the Ifng locus
DNase HS sites are typically associated with transcriptionally permissive histone modifications. To test this prediction and to provide a complementary approach to search for regulatory elements in the Ifng locus, we scanned the locus by ChIP to detect histone H3 dimethyl lysine 4 (K4(me2)), a stable mark associated with poised or actively transcribed chromatin24,26, and trimethyl lysine 27 (K27(me3)), a repressive histone modification associated with the establishment of Polycomb-mediated silencing27,28. DNase HS sites form where the nucleosomal array is distorted or displaced, potentially reducing total H3 abundance29,30, whereas Polycomb-mediated silencing results in the compaction of nucleosomes thereby potentially increasing total H3 density31. To control for these possibilities, we also performed ChIP for total H3 and present results for K4(me2) and K27(me3) both in absolute terms and relative to the abundance of H3 at that position (denoted K4(me2)/H3 and K27(me3)/H3).
Naive CD4+ T cells had little constitutive enrichment for K4(me2) throughout the Ifng locus, with the exception of low amounts found at IfngCNS-34 and IfngCNS-22 (Fig. 3a, top). In contrast, TH1 cells were characterized by distinct peaks of K4(me2) at all CNSs except IfngCNS+55. A broad area of K4(me2) enrichment was centered around IfngCNS+29 and IfngCNS+46 in TH1 cells, supporting previous reports that K4(me2) enrichment may be found at regulatory regions of active genes even where the underlying DNA sequence is not highly conserved24. Surprisingly, TH2 cells had moderate K4(me2) enrichment at IfngCNS-22, and slight enrichment at the Ifng gene, IfngCNS+18, IfngCNS+29, and just 5′ of IfngCNS+46. When corrected for the total abundance of H3 (Supplementary Fig. 3 online), the regions of apparent K4(me2) enrichment were substantially diminished in TH2 and naïve CD4+ T cells (Fig. 3b, top), while correction for total H3 abundance in TH1 cells further sharpened the K4(me2) peaks, most notably at IfngCNS+29 and IfngCNS+46, resolving K4(me2) to the regions of highest conservation. This pattern of K4(me2) enrichment largely mirrored that of H3 acetylation in long-term polarized TH1 and TH2 cell lines (Supplementary Fig. 4 online).
Figure 3. TH1 cells are marked by K4(me2), whereas naive and TH2 cells are characterized by enrichment of K27(me3).
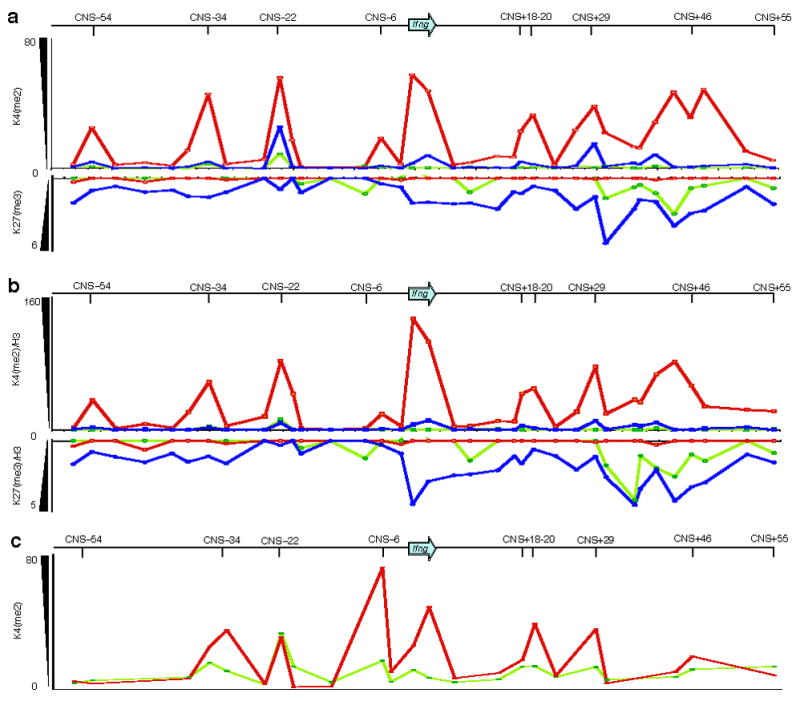
(a) ChIP was used to detect enrichment of the permissive K4(me2) modification, which appears as upward-pointing peaks (top), or enrichment of the repressive K27(me3) mark, which appears as downward-pointing peaks (bottom), in naïve CD4 (light green) and in vitro generated TH1(dark red) and TH2 cells (blue). (b) Enrichment of K4(me2) and K27(me3) was normalized to total histone H3 to account for possible differences in nucleosome density or structure between cell types. (c) ChIP for K4(me2) in naïve CD4 and TH1 effectors generated in vivo following adoptive transfer into congenic mice and infection with LCMV-Armstrong. Enrichment values are arbitrary units as defined in the methods. Data are representative of three independent experiments for (a) and (b) and two independent experiments for (c).
In contrast to the K4(me2) patterns observed, K27(me3) was present in naive CD4+ and TH2 cells but not in TH1 cells (Fig. 3a,b, bottom). Naive CD4+ cells had moderate amounts of K27(me3) and K27(me3)/H3 in the region between IfngCNS+29 and IfngCNS+46. When differentiated into TH2 cells, K27(me3) and K27(me3)/H3 increased in this region and spread throughout the Ifng gene and into the region upstream of IfngCNS-22. By contrast, differentiation into TH1 cells resulted in a near complete loss of K27(me3) and K27(me3)/H3 throughout the locus. Thus, while K4(me2) is largely a TH1-specific modification most strongly associated with CNSs, K27(me3) is broadly distributed throughout the locus in TH2 cells and only modestly enriched at CNSs.
Because the cytokine environment and commitment to effector cell lineage may differ between in vitro-derived TH1 cells and TH1 effectors generated in vivo, we also performed K4(me2) ChIP using TH1 effector CD4+ Smarta TCR-transgenic cells generated in response to lymphocytic choriomeningitis virus (LCMV) infection in vivo (Supplementary Fig. 2). Since the numbers of in vivo effectors were limited, we focused on regions that were most informative with in vitro-derived cells. TH1 effectors generated in vivo showed peaks of K4(me2) at Ifng and at each of the CNSs from IfngCNS-34 to IfngCNS+29, but compared to in vitro-derived TH1 cells had relatively greater K4(me2) enrichment at IfngCNS-6, less enrichment at IfngCNS+46 and no enrichment at IfngCNS-54 (Fig. 3c). Hence, K4(me2) enrichment did not extend to the most distant CNSs in CD4+ TH1 cells generated in response to LCMV infection as it did in in vitro derived TH1 cells.
Cell lineage-specific demethylation in the Ifng locus
Unmethylated DNA is commonly associated with poised or active chromatin. Therefore elements involved in Ifng regulation are expected either to be demethylated in naive CD4+ T cells or to become demethylated during TH1 differentiation. In naive CD4+ T cells, the majority of CpGs at IfngCNS-34, IfngCNS-22, the Ifng promoter, IfngCNS+29 and IfngCNS+46 were demethylated (Fig. 4a). By contrast, with the exception of IfngCNS+46, each of these regions was largely methylated in hepatocytes, a cell type that cannot express Ifng. Compared to naïve CD4+ T cells, TH1 cells demonstrated substantial demethylation at IfngCNS-54, intron 1 and IfngCNS+18–20. In contrast, TH2 cells gained CpG methylation at the Ifng promoter. A reciprocal pattern was seen at the Il4–Il13 locus, with demethylation at CNS1 and the Il4 promoter in TH2 cells (Fig. 4b), as previously reported32,33.
Figure 4. CD4+ T cell subset-specific CpG methylation at the Ifng locus.

Methylation of CpGs in the Ifng (a) or the Il4–Il13 locus (b). CNS regions analyzed by bisulfite treatment and sequencing of cloned alleles (individual rows) are denoted at the top. Closed circles represent meCpG, open circles represent CpG. Numbers and percentage of unmethylated CpG are below each region. CpG methylation patterns from purified hepatocytes are shown as an IFN-γ non-expressing cell control. Data represent 2–4 independent experiments. For IfngCNS+55, CpG methylation was evaluated in its most distal portion centered at +59kb.
Along with results presented in the previous sections, these data indicate that the precise pattern of HS sites, K4(me2) and K27(me3) enrichment, and CpG methylation differ between naive, TH1 and TH2 cells (Fig. 5). TH1 differentiation induced CpG demethylation at IfngCNS-6, intron 1, and IfngCNS+18–20, along with striking K4(me2) enrichment at all IfngCNSs except IfngCNS+55. Although not all regions enriched in K4(me2) in TH1 cells had a corresponding DNase HS site, HS sites in TH1 cells were exclusively found at such regions. In contrast, TH2 effectors gained CpG methylation at the Ifng promoter, and K27(me3) increased throughout much of the locus. Unlike TH1-specific DNase HS sites, TH2-specific DNase HS sites were adjacent to CNSs and corresponded to regions where enrichment for K27(me3) was most evident. CNS-22 was notable in lacking CpG methylation, the presence of K4(me2) in naïve, TH1 and TH2 cells, and DNase hypersensitivity in both TH1 and TH2 cells. Collectively these epigenetic distinctions suggest differential utilization and function of distal regulatory elements in naïve, TH1 and TH2 CD4+ T cells.
Figure 5. Epigenetic profile of naive, TH1 and TH2 CD4+ T cells.
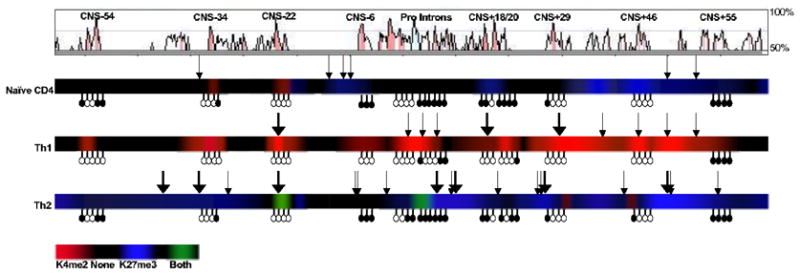
Composite pattern of DNase HS sites (shown as downward arrows), K4(me2)/H3 (red) and K27(me3)/H3 (blue) shown as a heatmap, and methylated or unmethylated CpGs shown as filled or open lollipops, respectively, with conservation shown above in VISTA format.
Distal elements can enhance IFN-γ production
To determine if any of the elements identified by epigenetic analyses were able to enhance IFN-γexpression, we transfected EL-4 T cells with plasmids containing a 9 kb murine Ifng gene (−3.4 to +5.6 kb) or the Ifng gene downstream of one of the elements identified by epigenetic analysis. Cells were also transfected with an empty expression vector or one directing expression of T-bet, plus an Actb promoter-driven Renilla luciferase transfection control plasmid. Transfected cells were then stimulated with PMA plus ionomycn, and transgene-driven production of IFN-γ was determined by ELISA and normalized to Renilla luciferase activity.
As previously reported, EL-4 cells produced little or no endogenous IFN-γ23, but did so when transfected with the Ifng gene (Fig. 6a,b). In response to PMA plus ionomycin, cells transfected with the IfngCNS+29 construct produced two to three times as much IFN-γ as the Ifng gene alone, as did cells transfected with the construct containing IfngCNS-6, which was previously shown to enhance IFN-γ production23. A similar two- to three-fold increase was observed with these constructs in the presence of T-bet. By contrast, constructs containing IfngCNS-22 and IfngCNS-34 enhanced IFN-γ production only in stimulated, T-bet-transfected cells.
Figure 6. IfngCNS–6 and IfngCNS+29 enhance IFN-γ production in the absence of T-bet, whereas IfngCNS–22 and IfngCNS–34 are T-bet-dependent enhancers.

EL-4 cells were co-transfected with a plasmid containing the 9 kb Ifng gene (−3.4 to +5.6 kb) alone or also containing the indicated CNS region, and either pcDNA3 (a) or pcDNA3 driving expression of T-bet (b) plus a β-actin Renilla luciferase transfection control plasmid. Cells were either not stimulated (unstim) or were stimulated with PMA and ionomycin for 24 h. IFN-γwas assessed by ELISA and normalized to luciferase activity (RLU). Results are mean ± SD of duplicate samples from one representative experiment of 4 or more independent experiments.
To assay for enhancer activity in additional cell types and in response to alternative stimuli, we cloned each element upstream of the -624bp Ifng promoter driving a firefly luciferase reporter. These constructs and a thymidine kinase (TK) promoter-driven renilla luciferase control were nucleofected into primary murine TH0, TH1 and TH2 CD4+ T cells and CD8+ T cells, which were then stimulated with anti-CD3 and anti-CD28, IL-12 plus IL-18 or both. Primary NK cells could not be nucleofected, so we used the human NK-92 cell line to study NK cell responses.
In NK-92 cells, expression from each of these constructs increased in response to stimulation with IL-12 plus IL-18 or PMA plus ionomycin and was greatest in response to the combination of these stimuli (Fig. 7a). IfngCNS-34, IfngCNS-22, IfngCNS-6, IfngCNS+46, and to a lesser extent IfngCNS-54, enhanced expression under all conditions. The degree of enhancement by IfngCNS+46 was similar in non-stimulated cells and in cells stimulated with IL-12 plus IL-18, PMA plus ionomycin or the combination, suggesting that this element is primarily responsive to transcription factors that are constitutively expressed and active in NK cells, such as Eomes or T-bet. By contrast, IfngCNS-22 disproportionately enhanced the response to IL-12 plus IL-18 (mean ± SD fold enhancement over the Ifng promoter alone = 5.75 ± 0.73), while IfngCNS-6 (11.97 ± 0.45) and IfngCNS-34 (11.58 ± 0.44), and to a lesser degree IfngCNS-54 (4.34 ± 0.17), principally enhanced expression in response to PMA plus ionomycin. When these stimuli were used together a composite of their independent effects was observed. The ability of these elements to enhance expression in NK-92 cells also demonstrates that the function of these elements is conserved among humans and mice.
Figure 7. Ifng CNS elements enhance Ifng expression in NK cells and primary T cells.

Luciferase reporter constructs containing the Ifng promoter and the indicated IfngCNSs were transfected into NK-92 cells (a) or primary CD8 (b), TH0 (c), or TH2 (d) T cells and expression was assessed by dual luciferase assay in cells that were not stimulated or were stimulated with IL-12 plus IL-18, PMA plus ionomycin (NK-92 cells) or anti-CD3 and anti-CD28 (T cells), or the combination of these stimuli. Normalized luciferase units are mean ± SD of duplicate samples from one representative experiment of 2–5 individual experiments; results with TH1 and TH0 cells were similar, and a representative TH0 experiment is shown.
When these constructs were transfected into primary T cell subsets that express IFN-γi expression increased in response to stimulation with IL-12 plus IL-18 or anti-CD3 plus anti-CD28 and was greatest in response to the combination of these stimuli. As in NK-92 cells, IfngCNS-6 enhanced expression in anti-CD3 plus anti-CD28-stimulated CD8+ T cells (6.74 ± 0.25) and in TH0 and TH1 CD4+ T cells (6.27 ± 0.17; Fig. 7b,c and data not shown); IfngCNS-34 did so as well but only in CD8+ T cells. IfngCNS-22 enhanced expression in response to IL-12 plus IL-18 in TH0 and TH1 cells (2.14 ± 0.15), but this effect was not consistently evident in CD8+ T cells. By contrast to the results in these T cell subsets, expression of each of these constructs in TH2 cells was low and did not change in response to stimulation (Fig. 7d).
Thus, expression of these constructs was appropriately restricted to IFN-γ-producing cell subsets, and IfngCNS-6, IfngCNS-34, and IfngCNS-22 enhanced expression both in the EL-4 and NK-92 cell lines and in primary T cells. IfngCNS-6 and IfngCNS-34 primarily enhanced expression in response to signals emanating from the TCR or NK receptors, IfngCNS-22 primarily enhanced expression in response to IL-12 plus IL-18, and IfngCNS-22 and IfngCNS-34 were T-bet-dependent enhancers. Although IfngCNS+29 enhanced expression in EL-4 cells as effectively as IfngCNS-6, this activity was not detected in other cell types, suggesting that its activity may be limited to specific contexts.
Boundary elements in the Ifng locus
The presence of differentially expressed genes and structural rearrangements upstream of Ifng and the antisense Tmevpg1 transcript downstream of Ifng, suggests that one or more of distal elements might function as boundary elements. To address this question, we utilized a colony-forming assay that tests the ability of elements to repress or stimulate the expression of a selectable marker when stably integrated into chromatin. EL-4 T cells were transfected with a plasmid containing a bacterial neomycin-resistance gene (neor) placed under the control of the promoter and enhancer from the human TCRαδlocus and flanked on the 3′ end by the Drosophila scs’ insulator element, which prevents influence of downstream enhancers or heterochromatin34,35. Expression of neor is measured by colony formation after selection of G418-resistant colonies in soft-agar (Fig. 8). CNS elements were then cloned 5′ of the enhancer to assay for insulator function indicated by increased colony formation, or were placed between the enhancer and promoter to assay for ability to block upstream enhancers, resulting in fewer colonies.
Figure 8. Boundary element function of CNSs.

EL-4 cells were transfected with constructs containing the neomycin-resistance gene under the control of the TCRδpromoter and enhancer and observed for colony formation in the presence of G418 (Neo). In assays for insulator activity, CNS regions were cloned upstream of the enhancer (a); in assays for enhancer-blocking activity, CNS regions were cloned between the enhancer and promoter (b). Data are a compilation of at least three experiments, each with triplicate transfections. The bar depicts means. ***, P ≤ 0.0001; **, P = 0.0002 for comparison to the β-neo control.
EL-4 cells transfected with the construct containing the c-myc 1.6 kb MINE insulator35 cloned upstream of the enhancer as a positive control produced 2.3-fold more colonies than the β-Neo control construct (Fig. 8a). IfngCNS+46 increased colony formation 2-fold when placed upstream of the enhancer, indicating its ability to function as an insulator and suggesting that it may form a functional 3′ locus boundary. The alternative interpretation – that IfngCNS+46 acted as an enhancer – is not consistent with its inability to increase colony formation when placed between the enhancer and promoter (Fig. 8b) nor its inability to enhance expression of luciferase reporters in EL-4 cells (Fig 6). When EL-4 cells were transfected with constructs containing the 1.6 kb MINE enhancer-blocking element between the TCRδenhancer and promoter as a positive control, G418-resistant colonies were reduced to numbers similar to constructs lacking the enhancer (Fig. 8b). IfngCNS-54, IfngCNS-34 and IfngCNS-22 also exhibited enhancer-blocking activity, decreasing the number of colonies to 10 to 26% of control values when cloned between the enhancer and promoter. The alternative interpretation – that these elements are silencers – is not consistent with their failure to reduce colony formation when placed upstream of the enhancer (Fig. 8a) nor with their ability to enhance expression in transient transfection assays (Figs. 6 and 7). These results suggest that these three upstream elements may protect Ifng from the influence of flanking sequences or regulatory elements associated with upstream genes or vice versa.
DISCUSSION
This report provides the first comprehensive computational and epigenetic analysis of the Ifng locus, which in concert with functional studies was used to delineate and characterize distal elements that regulate Ifng expression. The murine Ifng locus diverges from that of other mammals as a result of complex structural rearrangements commencing 57 kb upstream of Ifng. Despite these substantial differences in locus architecture, Ifng is expressed similarly in humans and mice, suggesting that regulatory elements necessary for proper Ifng expression are proximal to this divergence. Within ∼60 kb upstream or downstream of murine Ifng, we identified eight CNSs, which displayed distinct patterns of K4(me2) and K27(me3), CpG methylation and overlying or adjacent DNase HS sites that differed between naive, TH1 and TH2 CD4+ T cells. Functional studies showed that the most distal CNSs (Ifng CNS-54 and Ifng CNS+46) acted primarily as boundary elements, whereas the more proximal CNSs (Ifng CNS-34, Ifng CNS-22, Ifng CNS-6, and, in some contexts, Ifng CNS+29) were enhancers, two of which (Ifng CNS-34 and IfngCNS-22) could also function as boundary elements. The T cell-subset specific epigenetic marks associated with these regulatory elements suggested that they function to control Ifng expression in a manner appropriate for that subset. Consistent with this notion, constructs containing these elements and the Ifng promoter were active in primary T cell subsets that express Ifng and repressed in TH2 cells, which do not.
Naive CD4+ T cells are poised to express low amounts of Ifng mRNA shortly after activation36. In these cells, the Ifng promoter lacks transcriptionally favorable histone marks and HS sites but has demethylated CpGs and is juxtaposed to the TH2 cytokine locus, perhaps creating a hub that allows these two regions to compete for limiting transcription factors prior to fate specification25,37–39. We show here that the enhancers at IfngCNS-34, IfngCNS-22, and IfngCNS+29 have demethylated CpGs in naive CD4+ T cells, and that IfngCNS-22 has modest amounts of the permissive K4(me2) histone modification, perhaps poising these elements to facilitate Ifng expression during the early stages of TH1 differentiation. By contrast, CpGs in the two distal enhancers described previously, IfngCNS-6 and IfngCNS+18–2022,23 and in the introns13 are densely methylated in naive CD4+ T cells, suggesting that these regions may amplify expression at later stages. IfngCNS+46 was the other element with demethylated CpGs in naive CD4+ T cells. This element appeared to act as an insulator in T cells, though it had some basal enhancer activity in NK cells. Naive CD4+ T cells also contained two nearby HS sites (hs+49 and hs+53) and the surrounding region was modestly enriched for K27(me3). These two features were more prominent in TH2 cells and markedly diminished in TH1 cells, suggesting that the insulator activity of IfngCNS+46 may serve to keep the locus poised in naive CD4+ T cells by limiting the intrusion of repressive chromatin and/or encroachment by the downstream non-coding Tmevpg1 transcript. This transcript is thought to negatively regulate Ifng based on expression of both Ifng and Tmevpg1 by similar lymphocyte lineages, opposing expression patterns after stimulation, and the linkage of a genetic locus containing these regions with susceptibility to Theiler’s encephalomyletis21,40. The presence of K27(me3) has been suggested to serve as a mark for regulatory regions poised for silencing upon differentiation41. Thus, the region containing IfngCNS+46, hs+49 and hs+53 may serve as a developmental switch region that protects Ifng locus accessibility in naive CD4+ T cells, but facilitates silencing in TH2 cells. In many respects, IfngCNS+46 appears analogous to HSS3, which is located between the Il4 and Il13 genes. HSS3 is hypersensitive in naive, TH1 and TH2 cells, enriched in K27(me3) in naive and TH1 cells and loses K27(me3) in TH2 cells42. Though the function of HSS3 has not been tested, we speculate that it too may act as an insulator.
Compared to naive CD4+ T cells, high-level TH1-specific IFN-γ expression requires increased transcriptional accessibility at the Ifng locus. TH1 differentiation is known to be associated with progressive CpG demethylation and acquisition of DNase HS at IfngCNS-6, the Ifng promoter and intronic enhancers, and IfngCNS+18–209,22,23,25. We found that TH1 cells also acquired strong HS sites at two additional enhancers, IfngCNS-22 and IfngCNS+29, weak hs sites hs+36 and hs+46, and peaks of K4(me2) corresponding to the Ifng promoter and gene and each of the enhancers identified here and in previous reports. TH1 commitment also resulted in the complete loss of K27(me3) in the locus. IfngCNS+46, IfngCNS+29, IfngCNS-22 and IfngCNS-34 lacked CpG methylation in naïve CD4 T cells, suggesting that they may interact with the Ifng promoter in naive CD4+ cells, as does the most proximal enhancer IfngCNS-639. Early signaling events following stimulation may target these elements to begin structural chromatin changes and three-dimensional rearrangement of the Ifng locus, resulting in the recruitment of other elements necessary for high-level, heritable IFN-γ production. While this manuscript was in preparation, another report also identified IfngCNS-22 and IfngCNS-34 and showed, as we have, that these act as T-bet dependent enhancers43. However, in contrast to our findings and to previous reports22,23, they did not show enhancer function for IfngCNS-6, which may reflect differences in reporter constructs. They also demonstrated that deletion of IfngCNS-22 from a BAC Thy1.1-reporter transgene resulted in a marked loss of reporter expression by TH1, CD8+ T and NK cells, indicating that this element is also key in vivo. Together these data suggest that multiple distal enhancers located upstream and downstream of Ifng promote its expression in response to signals from the TCR and from the canonical TH1 master regulator T-bet. Others have shown that histone acetylation in the Ifng locus of TH1 cells is dependent on T-bet and STAT-444, however a more precise mapping will be needed to define the elements mediating these effects.
In addition to enhancers, proper expression of genes requires that they be protected by boundary elements from the unwanted effects of regulatory elements associated with nearby genes and surrounding chromatin domains. Four elements with boundary function were detected in the Ifng locus, each of which was marked by K4(me2) and demethylated CpGs in TH1 cells. As noted above, IfngCNS+46 may insulate the locus from encroachment by repressive K27(me3). Upstream, IfngCNS-22, IfngCNS-34, and IfngCNS-54 may serve as sequential barriers helping to segregate Ifng from upstream transposable elements and segmental duplications and from the regulatory elements associated with Il22 and Mdm1 or vice versa. Transposable and repetitive elements can alter the epigenetic structure of surrounding chromatin resulting in activation or silencing of nearby genes 45. And while IL-22, like IFN-γ, is an effector cytokine expressed minimally or not at all by naive T cells46, unlike IFN-γ, IL-22 is highly expressed by TH-17 rather than TH1 cells47. In addition to their boundary function, IfngCNS-34 and IfngCNS-22 were found to be T-bet-dependent enhancers, and IfngCNS-22 enhanced expression in response to IL-12 plus IL-18, suggesting that these elements are capable of binding multiple proteins with distinct functions. The factors that mediate these distinct functions will need to be elucidated to completely understand how these elements are involved in Ifng expression.
In contrast to TH1 cells, TH2 cells must silence Ifng to prevent its erroneous expression10,33,42. We show here that in TH2 cells K27(me3) spreads, extending from IfngCNS+46 to include the Ifng gene and upstream of IfngCNS-22. This spreading is characteristic of Polycomb-mediated gene silencing28, which has previously been described for the TH2 cytokine locus in TH1 cells48. The distribution of K27(me3) in TH2 cells compared to naive CD4+ T cells was suggestive of a bidirectional process, one extending from the region around IfngCNS+29 and IfngCNS+46 upstream to envelope the Ifng gene, and the other commencing upstream and extending down to IfngCNS-22. In parallel, multiple TH2-specific HS sites were acquired, and HS-35 and HS+49 became stronger than in naive CD4+ T cells. The location of these HS sites relative to the spreading of K27(me3) raises the possibility that these sites may represent locations from which the spreading is orchestrated. Conversely, HS-22 is strong in both TH1 and TH2 cells and is located at the upstream boundary of K27(me3), suggesting that it may block further spreading of this repressive mark perhaps to maintain some measure of plasticity in cells proceeding down but not yet irreversibly committed to the TH2 pathway4,49.
In summary, the ancestral Ifng locus, like the TH2 cytokine locus, consists of three cytokine genes and a housekeeping gene whose expression must be critically controlled for proper immune responses and the prevention of autoimmunity. In the TH2 locus, the regulation of Il4, Il5 and Il13 relies on the critical function of enhancers, silencers and a locus control region. However, the exact elements necessary for proper IFN-γ expression have not been known. We used high-resolution epigenetic mapping of the Ifng locus in naive, TH1 and TH2 cells to identify a set of enhancers and boundary elements whose patterns of accessibility coincide with potential roles in the initiation and maintenance of Ifng transcription in naive and TH1 CD4+ cells or the silencing of Ifng in TH2 cells. The deletion of these elements in vivo and the identification of transcription factors binding to them and the mechanisms by which they act will help to understand more fully how these elements regulate Ifng.
METHODS
Mice
C57BL/6 mice were obtained from The Jackson Laboratory. All mice were housed in specific pathogen-free conditions and were maintained in accordance with procedures approved by the University of Washington’s Institutional Animal Care Use Committee.
Purification and generation of T cell populations
EL-4 T cells were grown in RPMI supplement with 10% FBS, penicillin, streptomycin and L-glutamine. NK-92 cells were grown in 1x αMEM supplemented with sodium bicarbonate, 2 mM L-glutamine, 0.02 mg/ml gentamycin, penicillin, streptomycin, 12.5% fetal calf serum, 12.5% horse serum, 0.1 mM 2-mercaptoethanol, 100 U/mL recombinant human IL-2, 0.2 mM myoinositol and 0.02 mM folic acid. Smarta TCR transgenic CD4+ T cells were isolated from naïve mice using CD4 microbeads and the AutoMACS purification system or using the CD4+CD62L+ T cell isolation (Miltenyi) and gave similar results in ChIP experiments. Preparations obtained with CD4 microbead selection were >92% naïve CD4+CD44lo-int T cells with <3% CD4+FoxP3+ cells, <0.5% CD4−Dx5+ NK cells, and <0.5% CD4+DX5+ NKT cells, and with the CD4+CD62L+ T cell isolation kit were >92% naïve CD4+CD44lo-int T cells with <0.5% CD4+FoxP3+ cells, CD4−DX5+NK cells, and NKT cells. To generate effector CD4 T cells in vitro, CD4+CD44lo Smarta T cells were purified on a FACSAria (BD), then 0.5 x 10⁶ cells were cultured in IMDM supplemented with 10% FBS, penicillin, streptomycin, 50 μM 2-mercaptoethanol and 100U/mL IL-2 (Chiron) in the presence of 2.0 x 10⁶ CD4−CD8−NK1.1−CD44lo APCs and cognate GP-61 peptide (30 μg/ml, United Biochemical Research, Inc). TH1 culture conditions included 5 ng/mL rIL-12 (R&D Biosystems) and 10 μg/mL anti-IL-4 (NCI); TH2 culture conditions included 50 ng/mL rIL-4 (R&D Biosystems), 50 μg/mL anti-IL-12 and 50 μg/mL anti-IFN-γ (BioSource). Cells were expanded every 2 – 3 days in IMDM with cytokines as described above; neutralizing antibodies were added only during plating and the first expansion. Cells harvested for analysis at days 7 – 8 were >99% CD4high and <0.5% expressed NK1.1 or MHC class II. Effector CD4+ T cells were generated in vivo by adoptive transfer of splenocytes containing 1 x 10⁵ Smarta Thy1.1+ T cells into C57BL/6 mice followed 24 h later by intraperitoneal infection with 2 x 10⁵ PFU LCMV-Armstrong. After 7 – 8 days, effector cells were enriched by negative-selection using biotin-labeled antibodies to B220 and NK1.1 (BD/Pharmingen), pan-murine MHC Class II (clone M5/114) and streptavidin beads (Dynal), then CD4+Thy1.1+ CD4 Smarta effectors were purified on a FACSAria to >95% purity.
Chromatin Immunoprecipitation
This was done and results were quantified as described33 using rabbit anti-histone H3 (Abcam), anti-H3K4(me2) (Upstate Biotechnologies), anti-H3K27(me3) (Abcam) and normal rabbit immunoglobulin G as a non-specific control (Sigma). Each primer set was optimized and quantified by real-time PCR by comparison to a 5-log standard dilution of genomic DNA. After amplification, a melt curve profile was generated for each reaction to verify specificity of each primer set (primers, Supplementary Table 2 online). Samples with a difference of less than 2.0 in mean C(t) value between the specific and nonspecific IPs were considered to be not enriched. Specific IP values are reported as ([DNAspecific IP]-[DNArIgG])/[DNA10% input]*100.
Dnase HS Mapping
Chromatin profiling was performed and quantified as described18. Nuclei from ≥2 x 10⁷ cells were isolated, left untreated or treated with DNase I, and genomic DNA was purified. A tiling path of 250 ± 25 bp amplicons were designed to span a 124 kb region surrounding Ifng on mouse chromosome 10. Q-PCR reactions were performed using template from untreated or DNase I-treated nuclei. After amplification, a melt curve profile was generated to verify specificity of each primer set. For each amplicon, the DNase I sensitivity score was calculated as the ratio of product obtained from DNase I-treated DNA with the product obtained from untreated DNA. The standard deviation about the mean DNase I sensitivity scores for all the amplicons in a given cell type was then determined. The DNase I sensitivity score of each amplicon was then divided by the standard deviation to give a normalized score. The amount of product was reduced in the DNase I -treated sample for DNase I sensitive regions and the normalized score thus became positive for sensitive amplicons. Normalized values were then plotted with respect to the genomic coordinates as SD above the baseline and displayed in the UCSC genome browser. Primers for sequences at HS sites are listed in Supplementary Table 1. A complete primer list is found in Supplementary Table 3.
CpG methylation
CpG methylation in the Ifng and Il4 loci was quantified by sequencing of genomic DNA after bisulfite modification, PCR amplification and cloning as described50. Primers are listed in Supplementary Table 4.
Enhancer Assays
DNA for each element was generated with the Expand High Fidelity PCR System (Roche; primers, Supplementary Methods online) and RP-23 353-P23 bacterial artificial chromosome (Children’s Hospital of Oakland Research Institute) containing the C57BL/6 Ifng locus as template. IfngCNS-6 and IfngCNS+18–20 have previously been described7. Products were verified by sequencing and were inserted upstream of the 9 kb Ifng genomic clone in pBSII (EL-4 enhancer assays) or the Ifng promoter-driven (−624 bp) pGL3 vector using the MluI and XhoI sites (NK and primary T cell enhancer assays). The resulting constructs were transfected into EL-4 cells along with a T-bet-pcDNA3 or empty pcDNA3 plasmid, and a control Actb promotor Renilla luciferase plasmid as escribed23. EL-4 cells were allowed to recover for 1 h at 37°C, then left untreated or stimulated with 1.5 μM ionomycin and 25 ng/mL phorbol 12-myristate 13-acetate (PMA) for 24 h before supernatants were harvested for measurement of IFN-γby ELISA and cell lysates were prepared for measurement of Renilla luciferase activity (Promega). For primary T cell transfections, CD44lo-int CD4+ and CD8+ T cells were purified from C57BL/6 mice on a FACSAria,, or using the CD4+CD62L+ T cell isolation kit for TH0 cells, then 1.0 x 10⁶ cells were stimulated in a 24-well plate precoated with anti-CD3 (5 μg/ml, FHCRC) and anti-CD28 (10 μg/ml, BD) under TH1 or TH2 conditions (as described above but without APCs or peptide). TH0 and CD8 culture conditions were similar, with the exception that cultures were supplemented with IL-2 but no other cytokines or anti-cytokine antibodies. On day 7 – 8, cells were harvested and nucleofected using the Amaxa Nucleofection kit for mouse primary T cells according to manufacturer‘s protocol, with the following modifications. Briefly, ∼5 x 10⁶ CD8+ or TH2 cells per transfection were washed and cultured at 37°C in complete medium lacking IL-2 for 5 h prior to transfection and then moved to ice for 1 h. TH0 and TH1 cells were not washed out of IL-2, but were placed on ice for 20 min prior to transfection. Cells were resuspended at 5 x 10⁶ cells/100 μl in complete nucleofection solution and mixed with 20 μg of the indicated pGL3 firefly luciferase plasmid plus 5 μg of TK-Renilla luciferase plasmid. Following transfection, cells were allowed to recover for 4 h at 37°C, then were divided equally among wells for stimulation with murine rIL-12 (5 ng/mL, R&D Systems) plus murine rIL-18 (5 ng/mL, R&D Systems), with plate-bound anti-CD3 (5 μg/mL) and anti-CD28 (10 μg/mL), or with both. Cells were stimulated for 6 h before cell lysates were prepared for measurement of dual luciferase activity (Promega). NK-92 cells were nucleofected using the Amaxa kit V per the manufacturer protocol with the following modifications: 6 x 10⁶ cells were transfected with 2.5 μg TK-Renilla luciferase and 25 μg firefly luciferase plasmids. Following transfection, cells were allowed to recover for 2 h at 37°C, then were divided equally among wells for stimulation with human rIL-12 (10 ng/ml) plus murine rIL-18 (50 ng/ml), with 25 ng/ml PMA plus 1.5 μM ionomycin, or with both for 4 h, and then were harvested for measurement of luciferase activity. Primers used for cloning elements into pGL3 are listed in supplementary methods.
Boundary Element Assays
Constructs were generated and verified as described for enhancer assays using primers listed in Supplementary Methods. For insulator assays, elements were inserted upstream of the TCRδ enhancer, whereas for enhancer-blocking assays elements were inserted between the TCRδ enhancer and promoter. The resulting plasmids were linearized prior to transfection. EL-4 cells were transfected in triplicate with 10 μg of construct DNA. Cells were allowed to recover for 15 min, then diluted to 1.0 x 10⁶/ml in RPMI containing 10% FBS, streptomycin and penicillin for 48 h. Transformants were selected by plating 0.5 x 10⁶ cells in medium containing 1 mg/ml active G418 (Gibco) and 0.33% agar for ∼4 weeks. Colonies ≥4 mm were enumerated; total colony counts gave similar results but were not reported because of the difficulty resolving closely spaced small colonies from satellite colonies. Transfections with control plasmids (1.6 kb MINE or enhancerless) or plasmids containing CNS elements were compared to the β-Neo parent plasmid. Significance was determined using a two-tailed, unpaired Student’s t-test using Prism 4.0 software.
Supplementary Material
Acknowledgments
We acknowledge C. Surh (Scripps Research Institute) and M. Bevan (University of Washington) for Thy1.1+ Smarta TCR transgenic mice, T. Krumm (University of Washington) and M. Krangel (Duke University) for the Eδ-Pδ-βNeo-scs’ and Pδ-BNeo-scs’ constructs, and M. Kaja for LCMV-Armstrong. We thank K. Arispe and M. Weaver for technical assistance, S. Taylor for an earlier computational analysis of the Ifng locus, E. Eichler and M. Orr for helpful comments. This work was supported by NIH grants AI071272 and HD18184 and a grant from the March of Dimes. JRS was supported by pre-doctoral training grants from the NIH (CA009537) and Cancer Research Institute.
References
- 1.Ho IC, Glimcher LH. Transcription: tantalizing times for T cells. Cell. 2002;109(Suppl):S109–20. doi: 10.1016/s0092-8674(02)00705-5. [DOI] [PubMed] [Google Scholar]
- 2.Murphy KM, Reiner SL. The lineage decisions of helper T cells. Nat Rev Immunol. 2002;2:933–44. doi: 10.1038/nri954. [DOI] [PubMed] [Google Scholar]
- 3.Ansel KM, Lee DU, Rao A. An epigenetic view of helper T cell differentiation. Nat Immunol. 2003;4:616–23. doi: 10.1038/ni0703-616. [DOI] [PubMed] [Google Scholar]
- 4.Szabo SJ, Sullivan BM, Peng SL, Glimcher LH. Molecular mechanisms regulating Th1 immune responses. Annu Rev Immunol. 2003;21:713–58. doi: 10.1146/annurev.immunol.21.120601.140942. [DOI] [PubMed] [Google Scholar]
- 5.Hwang ES, Szabo SJ, Schwartzberg PL, Glimcher LH. T helper cell fate specified by kinase-mediated interaction of T-bet with GATA-3. Science. 2005;307:430–3. doi: 10.1126/science.1103336. [DOI] [PubMed] [Google Scholar]
- 6.Usui T, et al. T-bet regulates Th1 responses through essential effects on GATA-3 function rather than on IFNG gene acetylation and transcription. J Exp Med. 2006;203:755–66. doi: 10.1084/jem.20052165. [DOI] [PMC free article] [PubMed] [Google Scholar]
- 7.Mullen AC, et al. Role of T-bet in commitment of TH1 cells before IL-12-dependent selection. Science. 2001;292:1907–10. doi: 10.1126/science.1059835. [DOI] [PubMed] [Google Scholar]
- 8.Afkarian M, et al. T-bet is a STAT1-induced regulator of IL-12R expression in naive CD4+ T cells. Nat Immunol. 2002;3:549–57. doi: 10.1038/ni794. [DOI] [PubMed] [Google Scholar]
- 9.Mullen AC, et al. Hlx is induced by and genetically interacts with T-bet to promote heritable T(H)1 gene induction. Nat Immunol. 2002;3:652–8. doi: 10.1038/ni807. [DOI] [PubMed] [Google Scholar]
- 10.Lee GR, Kim ST, Spilianakis CG, Fields PE, Flavell RA. T helper cell differentiation: regulation by cis elements and epigenetics. Immunity. 2006;24:369–79. doi: 10.1016/j.immuni.2006.03.007. [DOI] [PubMed] [Google Scholar]
- 11.Young HA, et al. Expression of human IFN-gamma genomic DNA in transgenic mice. J Immunol. 1989;143:2389–94. [PubMed] [Google Scholar]
- 12.Zhu H, et al. Unexpected characteristics of the IFN-gamma reporters in nontransformed T cells. J Immunol. 2001;167:855–65. doi: 10.4049/jimmunol.167.2.855. [DOI] [PubMed] [Google Scholar]
- 13.Soutto M, Zhou W, Aune TM. Cutting edge: distal regulatory elements are required to achieve selective expression of IFN-gamma in Th1/Tc1 effector cells. J Immunol. 2002;169:6664–7. doi: 10.4049/jimmunol.169.12.6664. [DOI] [PubMed] [Google Scholar]
- 14.Gaszner M, Felsenfeld G. Insulators: exploiting transcriptional and epigenetic mechanisms. Nat Rev Genet. 2006;7:703–13. doi: 10.1038/nrg1925. [DOI] [PubMed] [Google Scholar]
- 15.Valenzuela L, Kamakaka RT. Chromatin insulators (*) Annu Rev Genet. 2006;40:107–38. doi: 10.1146/annurev.genet.39.073003.113546. [DOI] [PubMed] [Google Scholar]
- 16.West AG, Fraser P. Remote control of gene transcription. Hum Mol Genet. 2005;14(Spec No 1):R101–11. doi: 10.1093/hmg/ddi104. [DOI] [PubMed] [Google Scholar]
- 17.Nardone J, Lee DU, Ansel KM, Rao A. Bioinformatics for the ‘bench biologist’: how to find regulatory regions in genomic DNA. Nat Immunol. 2004;5:768–74. doi: 10.1038/ni0804-768. [DOI] [PubMed] [Google Scholar]
- 18.Dorschner MO, et al. High-throughput localization of functional elements by quantitative chromatin profiling. Nat Methods. 2004;1:219–25. doi: 10.1038/nmeth721. [DOI] [PubMed] [Google Scholar]
- 19.Igawa D, Sakai M, Savan R. An unexpected discovery of two interferon gamma-like genes along with interleukin (IL)-22 and -26 from teleost: IL-22 and -26 genes have been described for the first time outside mammals. Mol Immunol. 2006;43:999–1009. doi: 10.1016/j.molimm.2005.05.009. [DOI] [PubMed] [Google Scholar]
- 20.Dumoutier L, Van Roost E, Ameye G, Michaux L, Renauld JC. IL-TIF/IL-22: genomic organization and mapping of the human and mouse genes. Genes Immun. 2000;1:488–94. doi: 10.1038/sj.gene.6363716. [DOI] [PubMed] [Google Scholar]
- 21.Vigneau S, Rohrlich PS, Brahic M, Bureau JF. Tmevpg1, a candidate gene for the control of Theiler’s virus persistence, could be implicated in the regulation of gamma interferon. J Virol. 2003;77:5632–8. doi: 10.1128/JVI.77.10.5632-5638.2003. [DOI] [PMC free article] [PubMed] [Google Scholar]
- 22.Lee DU, Avni O, Chen L, Rao A. A distal enhancer in the interferon-gamma (IFN-gamma) locus revealed by genome sequence comparison. J Biol Chem. 2004;279:4802–10. doi: 10.1074/jbc.M307904200. [DOI] [PubMed] [Google Scholar]
- 23.Shnyreva M, et al. Evolutionarily conserved sequence elements that positively regulate IFN-gamma expression in T cells. Proc Natl Acad Sci U S A. 2004;101:12622–7. doi: 10.1073/pnas.0400849101. [DOI] [PMC free article] [PubMed] [Google Scholar]
- 24.Bernstein BE, et al. Genomic maps and comparative analysis of histone modifications in human and mouse. Cell. 2005;120:169–81. doi: 10.1016/j.cell.2005.01.001. [DOI] [PubMed] [Google Scholar]
- 25.Agarwal S, Rao A. Modulation of chromatin structure regulates cytokine gene expression during T cell differentiation. Immunity. 1998;9:765–75. doi: 10.1016/s1074-7613(00)80642-1. [DOI] [PubMed] [Google Scholar]
- 26.Schneider R, et al. Histone H3 lysine 4 methylation patterns in higher eukaryotic genes. Nat Cell Biol. 2004;6:73–7. doi: 10.1038/ncb1076. [DOI] [PubMed] [Google Scholar]
- 27.Cao R, et al. Role of histone H3 lysine 27 methylation in Polycomb-group silencing. Science. 2002;298:1039–43. doi: 10.1126/science.1076997. [DOI] [PubMed] [Google Scholar]
- 28.Bracken AP, Dietrich N, Pasini D, Hansen KH, Helin K. Genome-wide mapping of Polycomb target genes unravels their roles in cell fate transitions. Genes Dev. 2006;20:1123–36. doi: 10.1101/gad.381706. [DOI] [PMC free article] [PubMed] [Google Scholar]
- 29.Lee CK, Shibata Y, Rao B, Strahl BD, Lieb JD. Evidence for nucleosome depletion at active regulatory regions genome-wide. Nat Genet. 2004;36:900–5. doi: 10.1038/ng1400. [DOI] [PubMed] [Google Scholar]
- 30.Chen X, Wang J, Woltring D, Gerondakis S, Shannon MF. Histone dynamics on the interleukin-2 gene in response to T-cell activation. Mol Cell Biol. 2005;25:3209–19. doi: 10.1128/MCB.25.8.3209-3219.2005. [DOI] [PMC free article] [PubMed] [Google Scholar]
- 31.Simon JA, Tamkun JW. Programming off and on states in chromatin: mechanisms of Polycomb and trithorax group complexes. Curr Opin Genet Dev. 2002;12:210–8. doi: 10.1016/s0959-437x(02)00288-5. [DOI] [PubMed] [Google Scholar]
- 32.Lee DU, Agarwal S, Rao A. Th2 lineage commitment and efficient IL-4 production involves extended demethylation of the IL-4 gene. Immunity. 2002;16:649–60. doi: 10.1016/s1074-7613(02)00314-x. [DOI] [PubMed] [Google Scholar]
- 33.Makar KW, et al. Active recruitment of DNA methyltransferases regulates interleukin 4 in thymocytes and T cells. Nat Immunol. 2003;4:1183–90. doi: 10.1038/ni1004. [DOI] [PubMed] [Google Scholar]
- 34.Zhong XP, Krangel MS. An enhancer-blocking element between alpha and delta gene segments within the human T cell receptor alpha/delta locus. Proc Natl Acad Sci U S A. 1997;94:5219–24. doi: 10.1073/pnas.94.10.5219. [DOI] [PMC free article] [PubMed] [Google Scholar]
- 35.Gombert WM, et al. The c-myc insulator element and matrix attachment regions define the c-myc chromosomal domain. Mol Cell Biol. 2003;23:9338–48. doi: 10.1128/MCB.23.24.9338-9348.2003. [DOI] [PMC free article] [PubMed] [Google Scholar]
- 36.Grogan JL, Locksley RM. T helper cell differentiation: on again, off again. Curr Opin Immunol. 2002;14:366–72. doi: 10.1016/s0952-7915(02)00340-0. [DOI] [PubMed] [Google Scholar]
- 37.Avni O, et al. T(H) cell differentiation is accompanied by dynamic changes in histone acetylation of cytokine genes. Nat Immunol. 2002;3:643–51. doi: 10.1038/ni808. [DOI] [PubMed] [Google Scholar]
- 38.Fields PE, Kim ST, Flavell RA. Cutting edge: changes in histone acetylation at the IL-4 and IFN-gamma loci accompany Th1/Th2 differentiation. J Immunol. 2002;169:647–50. doi: 10.4049/jimmunol.169.2.647. [DOI] [PubMed] [Google Scholar]
- 39.Spilianakis CG, Lalioti MD, Town T, Lee GR, Flavell RA. Interchromosomal associations between alternatively expressed loci. Nature. 2005;435:637–45. doi: 10.1038/nature03574. [DOI] [PubMed] [Google Scholar]
- 40.Vigneau S, et al. Homology between a 173-kb region from mouse chromosome 10, telomeric to the Ifng locus, and human chromosome 12q15. Genomics. 2001;78:206–13. doi: 10.1006/geno.2001.6656. [DOI] [PubMed] [Google Scholar]
- 41.Bernstein BE, et al. A bivalent chromatin structure marks key developmental genes in embryonic stem cells. Cell. 2006;125:315–26. doi: 10.1016/j.cell.2006.02.041. [DOI] [PubMed] [Google Scholar]
- 42.Ansel KM, Djuretic I, Tanasa B, Rao A. Regulation of Th2 differentiation and Il4 locus accessibility. Annu Rev Immunol. 2006;24:607–56. doi: 10.1146/annurev.immunol.23.021704.115821. [DOI] [PubMed] [Google Scholar]
- 43.Hatton RD, et al. A distal conserved sequence element controls Ifng gene expression by T cells and NK cells. Immunity. 2006;25:717–29. doi: 10.1016/j.immuni.2006.09.007. [DOI] [PubMed] [Google Scholar]
- 44.Chang S, Aune TM. Histone hyperacetylated domains across the Ifng gene region in natural killer cells and T cells. Proc Natl Acad Sci U S A. 2005;102:17095–100. doi: 10.1073/pnas.0502129102. [DOI] [PMC free article] [PubMed] [Google Scholar]
- 45.Biemont C, Vieira C. Genetics: junk DNA as an evolutionary force. Nature. 2006;443:521–4. doi: 10.1038/443521a. [DOI] [PubMed] [Google Scholar]
- 46.Xie MH, et al. Interleukin (IL)-22, a novel human cytokine that signals through the interferon receptor-related proteins CRF2-4 and IL-22R. J Biol Chem. 2000;275:31335–9. doi: 10.1074/jbc.M005304200. [DOI] [PubMed] [Google Scholar]
- 47.Liang SC, et al. Interleukin (IL)-22 and IL-17 are coexpressed by Th17 cells and cooperatively enhance expression of antimicrobial peptides. J Exp Med. 2006;203:2271–9. doi: 10.1084/jem.20061308. [DOI] [PMC free article] [PubMed] [Google Scholar]
- 48.Koyanagi M, et al. EZH2 and histone 3 trimethyl lysine 27 associated with Il4 and Il13 gene silencing in Th1 cells. J Biol Chem. 2005;280:31470–7. doi: 10.1074/jbc.M504766200. [DOI] [PubMed] [Google Scholar]
- 49.Messi M, et al. Memory and flexibility of cytokine gene expression as separable properties of human T(H)1 and T(H)2 lymphocytes. Nat Immunol. 2003;4:78–86. doi: 10.1038/ni872. [DOI] [PubMed] [Google Scholar]
- 50.Fitzpatrick DR, et al. Distinct methylation of the interferon gamma (IFN-gamma) and interleukin 3 (IL-3) genes in newly activated primary CD8+ T lymphocytes: regional IFN-gamma promoter demethylation and mRNA expression are heritable in CD44(high)CD8+ T cells. J Exp Med. 1998;188:103–17. doi: 10.1084/jem.188.1.103. [DOI] [PMC free article] [PubMed] [Google Scholar]
Associated Data
This section collects any data citations, data availability statements, or supplementary materials included in this article.