

Abstract
Purpose
There is a need for new technologies to study tissue-based biomarkers. The current gold standard, immunohistochemistry, is compromised by variability in tissue processing and observer bias. Reverse transcription-PCR (RT-PCR), immunocytochemistry, and reverse-phase lysate microarrays (RPM) are promising alternative technologies but have not yet been validated, or correlated, on the same patient-derived tissues. Furthermore, RPM is currently limited by time-consuming microdissection and low amounts of evaluable protein lysates.
Experimental Design
Metastatic melanoma was surgically excised from 30 patients and macroscopically dissected from surrounding stroma. Each specimen was processed by formalin-fixation (immunohistochemistry), cytospin (immunocytochemistry), or disaggreagation and enrichment (RT-PCR and RPM). The latter protocol uses immunochromatography to remove hematopoetic-derived cells, thus enriching for melanoma cells. Each sample was measured for the expression of gp100 or MART-1normalized to actin.
Results
Immunochromatography coupled with RPM (I-RPM) is reproducible (r ≥ 0.70) and, for gp100, correlates strongly with immunohistochemistry and immunocytochemistry (r = 0.78 and 0.76, respectively) and moderately with transcript levels, measured by RT-PCR (r = 0.61). In contrast, for MART-1, I-RPM correlates strongly with transcript level (r = 0.78) but only moderately strong correlations are noted with immunohistochemistry and immunocytochemistry (r = 0.64 and 0.59, respectively). In general, transcript levels show only moderately strong correlations with immunohistochemistry and immunocytochemistry (r = 0.41–0.64).
Conclusion
I-RPM is a promising technology for quantitative grading of tissue biomarkers; however, antigen-dependent correlations are noted.
There is a great need for quantitative and reproducible technologies to profile tissue biological markers (biomarkers; ref. 1). Immunohistochemistry, the most frequently used tool for studying tissue biomarkers, is routinely used for drug target discovery or validation, for pharmacodynamic evaluation, for diagnosing the site of primary tumors, and for guiding immunotherapy protocols. Immunohistochemistry is superior to whole tumor lysates because, for example, it allows identification of antigen expression from a tumor cell even in the presence of greater numbers of infiltrating leukocytes. However, immunohistochemistry has been reported to be subjective, nonquantitative, and subject to processing variability (e.g., formalin fixation artifacts) and thus may not be ideal for clinical biomarker studies (2).
Newer technologies (e.g., proteomics and genomics) are promising alternatives to study tumor biomarkers (3). One high-profile, proteomic-based protocol was designed to provide quantitative levels of tumor antigens and to circumvent the need for formalin fixation and to avoid observer bias. In the so-called reverse-phase lysate microarray (RPM), laser capture microdissection is coupled with immunostaining of lysates arrays, which are then scored by image analysis (4–6). Like immunohistochemistry, laser capture microdissection allows protein extraction from a target cell population without ‘‘contamination’’ by leukocytes. However, this technology, when applied to tumor tissue, requires time-consuming microdissection by pathologist and typically yields minimal quantities of evaluable protein. Finally, RNA transcript levels, measured by reverse transcription-PCR (RT-PCR), have a wide dynamic range and so are frequently used as tissue-based biomarkers. However, transcript levels frequently do not reflect the levels of the proteins they encode and so may not be accurate biomarkers (7).
Accurately measuring expression of melanoma antigens is especially important for an on-going National Cancer Institute immunotherapy trial for metastatic melanoma. Therefore, to identify the optimal protocol for evaluating tissue-based biomarkers, we measured the expression of two such antigens (gp100 and MART-1) from surgically excised tumor samples by four different protocols: immunohistochemistry, immunocytochemistry, RT-PCR, and RPM. For separating tumor cells from leukocytes, negative immunoselection is an effective alternative to, and more rapid than, laser capture microdissection. The strength of this study is that all protocols were done on the same patient-derived tissue samples. Moderate to strong correlations were noted among all assays; however, the strength of the correlation was antigen dependent.
Materials and Methods
Processing of tumor specimens
Excisional tumor biopsies were obtained with informed consent and appropriate institutional review board approval from patients who were referred to the Surgery Branch of the National Cancer Institute for treatment. All patients had histologically confirmed metastatic melanoma. Shortly after surgical excision, nodules of metastatic melanoma were dissected away from surrounding stroma. The tumor were subjected to fine-needle aspiration and processed using cytospins. A representative section of the tumor was submitted for routine formalin fixation and embedded in paraffin. Most of the remaining tissue was disaggregated with collagenase, DNase, and hyaluronidase (yielding 5.5 × 10⁷ to 3 × 10⁹ viable cells per sample) as described elsewhere (8). Aliquots of the cells were cryopreserved and stored in a liquid nitrogen freezer.
Immunochromatography
Thawed disaggregated cells were washed thrice in PBS and resuspended in 0.5 mL PBS supplemented with 0.5% bovine serum albumin and 2 mmol/L EDTA (PBS-BE). Cells were incubated with magnetic beads conjugated with anti-CD45, at a ratio of 20 μL bead slurry per 107 cells (Miltenyi Biotec, Auburn, CA) for 20 minutes at 4°C, according to the protocol of the manufacturer. The cell-bead suspension volume was adjusted to 0.5 mL with PBS-BE and applied to a MiniMACS magnetic columns (Miltenyi Biotec) preequilibrated with PBS-BE. The flow through and two subsequent column washes (0.5 mL PBS-BE each) were collected in separate tubes. The column was then removed from the magnetic field and eluted in the presence of 0.5 mL PBS-BE by positive pressure. Cell viability and concentration were then scored by trypan blue exclusion (Biowhittaker, Walkersville, MD). By visualization, >90% of the enriched cell population are tumors.
Reverse-phase lysate microarrays
The general protocol for RPM has previously been validated and is published elsewhere (9). Approximately 2 × 10⁵ viable cells were lysed in 100 μL TPER (Pierce Biotechnology, Rockford, IL) containing 1× SDS sample buffer (Invitrogen, Carlsbad, CA) and 2% β-mercaptoethanol (Sigma, St. Louis, MO). The lysates were boiled for 5 minutes and aliquoted in serial 2-fold dilutions in a 96-well plate. The serial dilutions were printed in triplicate on Schleicher & Schuell FastSlides nitrocellulose slides (Schleicher & Schuell, Keene, NH) using a GMS417 arrayer (Affymetrix, Santa Clara, CA). The slides were incubated with I-block (Tropix, Bedford, MA) for 3 hours at room temperature and stained with antibodies using the catalyzed signal amplification kit (DakoCytomation, Carpinteria, CA). Slides were stained with anti-β-actin (1:200; Alpha Diagnostics, San Antonio, TX) and the following DAKO antibodies: anti–leukocyte common antigen (1:200), anti-HMB45 (1:6), and anti-S100 (1:100). The stained slides were then scanned and images were quantified using the ImageQuant 5.2 software (Molecular Dynamics, Piscataway, NJ).
Immunohistochemical grading of tissues and cytology samples
Formalin-fixed, paraffin-embedded tissue sections were deparaffinized and subjected to 20-minute heat-induced antigen retrieval in 10 mm citrate buffer. After blocking, the slides were then stained with MART-1 and HMB45 for 32 minutes and 2 hours, respectively, at room temperature. The reactions were developed on a Ventana autostainer (Ventana, Tucson, AZ). The reactions were scored by an experienced, board-certified pathologist on a four-tiered scale (0–3) for intensity and percentage of viable tumor cells that were positive (0, rare <5%, 5–50%, and >50%). An intensity index was constructed by multiplying the two measured variables (range of 0–9). Immunocytochemistry was done on the cytospin preparations and scored for intensity as above and as described elsewhere (10). However, in contrast to immunohistochemistry, the percentage of viable tumor cells that were positive was scored on a five-tiered scale (0–4; 0, rare <25%, 25–50%, 50–75%, and >75%, respectively), resulting in a range of calculated intensity index from 0 to 12.
Real-time quantitative RT-PCR
Total RNA was extracted from ∼1 × 10⁵ to 5 × 10⁵ enriched melanoma tumor cells using RNeasy mini kit (Qiagen, Valencia, CA). RNA was reverse transcribed using the ThermoScript RT-PCR system (Invitrogen Life Technologies, Carlsbad, CA). cDNA was amplified with specific primers and probes for MART-1, gp100, and β-actin. MART-1 RT-PCR was done using predeveloped TaqMan Gene Expression Assays from Applied Biosystems (Foster City, CA). Primers and probe for gp100 were the following: gp100 TaqMan probe 5′-6FAM-ACATTGTCCAGGGTATTGAAAGTGCCGAGAT-TAMRA-3′, forward primer 5′-GGTTCCTTTTCCGTCACCCT-3′, and reverse primer 5′-CTCACCGGACGGCACAG-3′. Primers and probe for β-actin were the following: β-actin TaqMan probe 5′-FAM-CCA-GCCATGTACGTTGCTATCCAGGC-TAMRA-3′, forward primer 5′-GCGAGAAGATGATGACCCAGATC-3′, and reverse primer 5′-CCAGTGGTACGGCCAGAGG-3′. Real-time RT-PCR was done using the ABI PRISM 5700 Sequence Detection System (Applied Biosystems). The mRNA for MART-1, gp100, and β-actin were quantified by comparing the unknown samples to the standard curves that were generated by using serial dilutions of plasmids that carried the MART-1, gp100, and β-actin genes. β-Actin values were used to normalize the mRNA (11).
Statistical analysis
The correlation between pairs of variables was determined using Spearman nonparametric correlation analysis because many of the variables were determined to not be normally distributed. Correlation coefficients such that |r| >0.70 are considered to indicate strong correlations; 0.5 < |r| < 0.70 indicates moderately strong correlations, 0.3 < |r| < 0.5 indicates weak to moderately strong correlations, and |r| < 0.3 indicates weakly correlated variables. In addition to using Spearman correlation, the assessment of reproducibility of the variables was done using a Wilcoxon signed rank test to determine if the ratio of successive values was significantly different from 1.0. All P values are two-tailed and have not been adjusted for multiple comparisons.
Results
Immunochromatography coupled with RPM
The analysis of lysates prepared from gross tumor specimens is frequently compromised by the presence of infiltrating leukocytes and histiocytes. Although laser capture microdissection eliminates this problem, it is time-consuming and typically yields minimal protein samples. Because all cells of hematopoietic origin (except platelets and erythrocytes) express the CD45 antigen, we used magnetic beads conjugated with anti-CD45 antibody to remove all leukocytes and histiocytes from a tumor cell suspension. A similar protocol, coupled with RT-PCR, can detect at least one melanoma cell per milliliter of blood (12). Lysates (or RNA) are then prepared from the enriched tumor cells, avoiding the need for time-consuming microdissection or a skilled pathologist (Fig. 1).
Fig. 1.
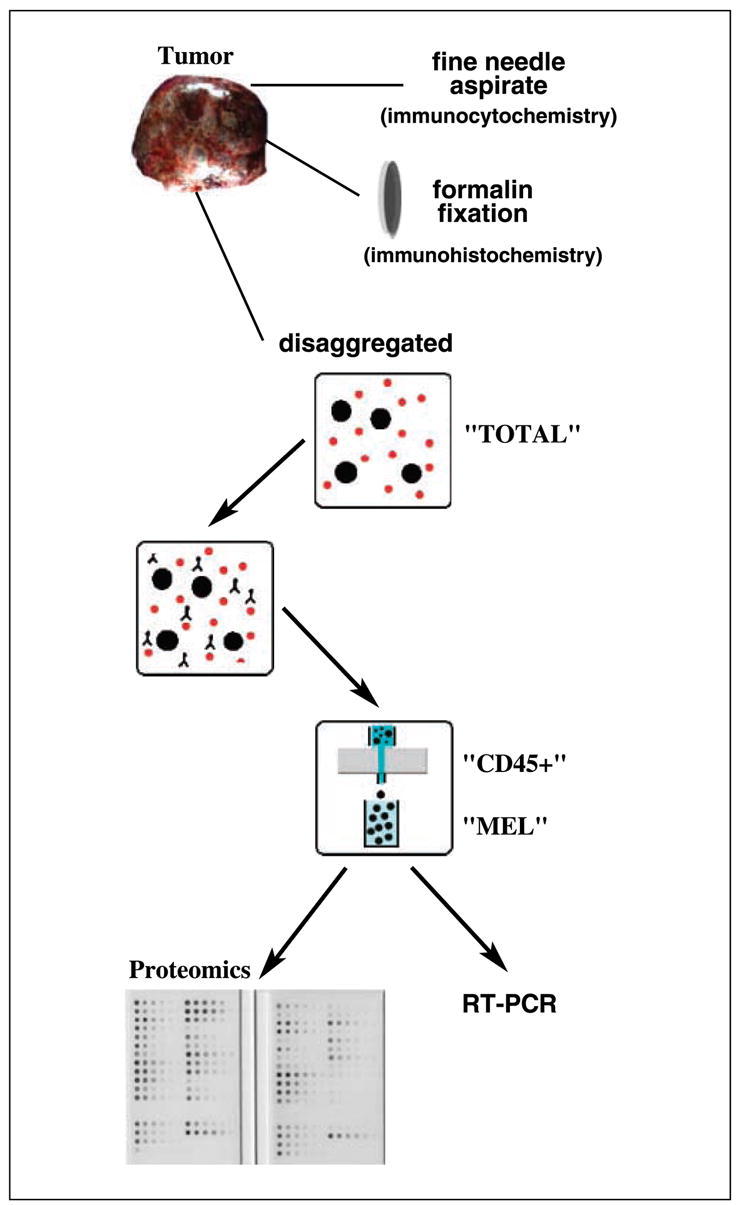
Summary of tissue processing. Surgically excised melanoma tumor specimens were macroscopically dissected free of benign stroma and then subjected to fine needle aspiration (for immunocytochemistry), formalin fixation (for immunohistochemistry), or enrichment by negative immunochromatography (for RPM and RT-PCR). The latter purification separates disaggregated cells (TOTAL) into leukocytes/histiocytes (CD45+) and tumor (MEL) fractions.
Surgically excised nodules of metastatic melanoma were macroscopically dissected from surrounding stroma. The tumor was then disaggregated (TOTAL) and fractionated by negative immunochromatography for CD45-expressing mononuclear cells into bead-free melanocyte (MEL) and bead-binding mononuclear cells (CD45+) fractions. The high efficiency of separation can be seen by microscopic visualization of cytospin preparations from the TOTAL and MEL fractions (Fig. 2A).
Fig. 2.

Processing of disaggregated cells from melanoma tumors by negative I-RPM. A, cytospin preparations (stained with Diffquick) reveal almost complete purity of melanoma (large arrows) in the MEL fractions and infiltrating leukocytes (small arrows) in theTOTAL fraction. B, lysates fromTOTAL, MEL, and CD45+ fractions were arrayed in minidilution format onto multiple slides.The slides were then stained with antibodies to gp100, S100, actin, and CD45 (leukocyte common antigen, LCA) or negative control.
Lysates were prepared from equivalent cell numbers of all three fractions. The lysates were then printed onto nitrocellulose slides in a minidilution format and the slides were probed with the relevant antibodies (Fig. 2B). Positive reactions were scored using a computer program that measures intensity of scanned images. The minidilution series allows identification, and exclusion of, signal saturation. As noted above, the fractionation protocol is efficient because immunostaining with antibodies to leukocyte common antigen and the gp100 antigen revealed a high degree of enrichment for lymphocytes and melanocytes in the CD45+ and MEL fractions, respectively (Fig. 2B).
Comparison among immunochromatography coupled with RPM, immunohistochemistry, immunocytochemistry, and RT-PCR
Metastatic melanoma tumors were surgically excised from 30 patients and processed so that all four assays could be done on the same tissue sample (Fig. 1). First, fine-needle aspiration was done shortly after surgical excision and the aspirated cells were prepared by cytospin, without exposure to formalin or paraffin, for immunocytochemistry. A representative portion of each tumor was then submitted for formalin fixation and embedding in paraffin for immunohistochemistry. Finally, most of the remaining sample was disaggregated and subjected to negative immunoselection for melanoma cells.
Lysates were prepared from the enriched melanoma cells and the melanoma antigens analyzed by RPM. The reaction intensities were normalized to a replicate slide stained for β-actin. To assess reproducibility, the same lysates were arrayed and stained for gp100 on 2 separate days (data not shown). All staining reactions were done in triplicate. Strong correlations were observed when the arraying and staining assays were done on separate days (r = 0.83, P < 0.0001). For each individual assay, the SD values were low (Table 1). However, the mean ratio of the two staining values was 1.75, and a Wilcoxon signed rank test of whether the ratio was equal to 1.0 had an associated P value of 0.0001, indicating that the two values differed by a constant that was significantly different from 1.0.
Table 1.
Biomarker expression
| Patient | Site | gp100
|
MART1
|
||||||
|---|---|---|---|---|---|---|---|---|---|
| IH | IC | RPM (SD) | RT-PCR | IH | IC | RPM (SD) | RT-PCR | ||
| 1 | Lymph node | 6 | 0 | 1.3 (0.1) | ND | 0 | 0 | 0.82 (0.1) | ND |
| 2 | Not available | 9 | 12 | 2.1 (0.3) | ND | 0 | 0 | 0.32 (0.05) | ND |
| 3 | Lymph node | 4 | 2 | 0.6 (0.09) | 2,871 | 1 | 2 | 0.95 (0.02) | 5,274 |
| 4 | Thigh | 1 | 1 | 0.9 (0.3) | 35 | 3 | 2 | 1.68 (0.07) | 10,370 |
| 5 | Lymph node | 2 | 6 | 1 (0.3) | ND | 1 | 2 | 0.21 (0.02) | ND |
| 6 | Thigh | 3 | 12 | 1 (0.2) | ND | 3 | 2 | 0.85 (0.007) | ND |
| 7 | Lymph node | 9 | 12 | 1.6 (0.5) | 1,667 | 1 | 3 | 0.32 (0.002) | 448 |
| 8 | Axilla | 1 | 1 | 0.8 (0.1) | ND | 0 | 1 | 0.13 (0.02) | ND |
| 9 | Chest wall mass | 9 | 4 | 2.2 (0.04) | 3,460 | 2 | 2 | 1.39 (0.1) | 3,699 |
| 10 | Chest wall mass | 6 | 2 | 1.6 (0.07) | 1,746 | 0 | 2 | 0.99 (0.04) | 2,611 |
| 11 | S.c. | 4 | 8 | 2.6 (0.3) | 11,673 | 3 | 1 | 2.06 (0.08) | 7,682 |
| 12 | Back | 9 | 3 | 0.6 (0.2) | ND | 6 | 2 | 0.71 (0.002) | ND |
| 13 | Buttock | 6 | 4 | 0.9 (0.1) | ND | 3 | 2 | 0.78 (0.06) | ND |
| 14 | Lymph node | 9 | 8 | 1.5 (0.2) | ND | 0 | 8 | 1.57 (0.05) | ND |
| 15 | Lymph node | 2 | 1 | 0.7 (0.1) | 5,771 | 6 | 1 | 0.91 (0.05) | 3,884 |
| 16 | Axilla | 0 | 1 | 0.3 (0.07) | ND | 0 | 1 | 0.04 (0.01) | ND |
| 17 | S.c. | 0 | 0 | 0.3 (0.05) | 1 | 0 | 0 | 0.07 (0.01) | 0 |
| 18 | Groin | 3 | 1 | 0.5 (0.1) | ND | 3 | 1 | 0.77 (0.02) | ND |
| 19 | S.c. | 6 | 6 | 2.9 (0.5)* | 4,147 | 6 | ND | 1.34 (0.2) | 5,733 |
| 20 | Popliteal fossa | 9 | 2 | 1.1 (0.3) | 6,049 | 9 | 2 | 1.08 (0.03) | 3,373 |
| 21 | Buttock | 6 | 4 | 1.3 (0.3) | ND | 3 | 2 | 0.65 (0.01) | ND |
| 22 | Lymph node | 1 | 0 | 0.4 (0.08) | ND | 0 | 0 | 0.52 (0.04) | ND |
| 23 | Breast | 0 | 0 | 0.5 (0.2) | ND | 0 | 0 | 0.07 (0.01) | ND |
| 24 | Axilla | 0 | 0 | 0.5 (0.1) | ND | 0 | 0 | 0.08 (0.008) | ND |
| 25 | Upper arm | 0 | 0 | 1.3 (0.7)* | ND | 0 | ND | 0.31 (0.02) | ND |
| 26 | Lymph node | 0 | 0 | 1.4 (0.5)* | 0 | 0 | 0 | 0.27 (0.05) | 24 |
| 27 | Arm and axilla | 0 | 0 | 0.6 (0.3) | 5 | 0 | 0 | 0.11 (0.02) | 57 |
| 28 | Small bowel | 0 | 0 | 0.4 (0.1) | ND | 0 | 0 | 0.09 (0.008) | ND |
| 29 | Brain | ND | ND | 0.4 (0.1) | ND | ND | ND | 0.8 (0.004) | ND |
| 30 | Lymph node | 9 | ND | 5.6 (0.2) | ND | 9 | ND | 18.29 (0.1) | ND |
NOTE:Values were calculated as detailed in Materials and Methods.
Abbreviations: IH, immunohistochemistry; IC, immunocytochemistry; ND, not done.
Low actin values; not included in correlation analysis.
The entire experiment (tumor enrichment, arraying, and staining) was then repeated for 12 of the patient samples and by using a separate vial of cryopreserved cells (data not shown). By Spearman correlation analysis, strong correlations were observed between the two independent assays for both gp100 and MART-1 (r = 0.70, P = 0.083 and r = 0.84, P = 0.0006 for gp100 and MART-1, respectively). For the MART-1 assay, the mean ratio of the first assay to the repeat assay was fairly constant for each patient at 1.66, which was marginally significantly different from 1.0 by the Wilcoxon signed rank test (P = 0.052).
gp100 and MART-1 expression (intensity index) were also assessed by immunocytochemistry on the cytospin preparations and immunohistochemistry on the formalin-fixed, paraffin-embedded tissue (Table 1). For gp100 expression, immunohistochemistry and immunocytochemistry were strongly correlated (r = 0.80, P < 0.0001) and both strongly correlated with immunochromatography coupled with RPM (I-RPM; r = 0.78 and r = 0.76, respectively, with each P < 0.0001). MART-1 immunohistochemistry displayed moderate correlation with I-RPM (r = 0.64, P = 0.0002). MART-1 immunocytochemistry was moderately well correlated with both immunohistochemistry (r = 0.56, P = 0.0027) and with I-RPM (r = 0.59, P = 0.0015).
Finally, aliquots from the enriched melanoma cells were analyzed by RT-PCR for the levels of gp100 and MART-1 transcripts (Table 1). As above, these levels were normalized to actin. For gp100, RT-PCR displayed moderate correlation with immunohistochemistry, immunocytochemistry, and I-RPM (r = 0.61, P = 0.034; r = 0.64, P = 0.025; and r = 0.61, P = 0.061, respectively). In contrast, RT-PCR for MART-1 strongly correlated with I-RPM (r = 0.78, P = 0.0026) and displayed moderately strong correlation with immunohistochemistry (r = 0.52, P = 0.086), but a weaker correlation with immunocytochemistry (r = 0.41, P = 0.22). A summary of the Spearman correlations is shown in Table 2.
Table 2.
Spearman correlation coefficients (gp100/MART-1)
| IH | IC | I-RPM | RT-PCR | |
|---|---|---|---|---|
| IH | — | 0.80/0.56 | 0.78/0.64 | 0.61/0.52 |
| IC | — | — | 0.76/0.59 | 0.64/0.41 |
| I-RPM | — | — | — | 0.61/0.78 |
| RT-PCR | — | — | — | — |
Conclusion
Tissue-based biomarkers provide integral data for drug discovery, pharmacodynamic studies, and for selection of therapy. To identify the optimal technology for studying tissue biomarkers, we measured the expression of two melanoma antigens using four different protocols. To reduce bias, all assays were applied to the same patient-derived tissue specimens. For macroscopically pure tumor samples, we show that enrichment for melanoma cells by negative immunochromatography effectively eliminates tumor-infiltrating leukocytes and histiocytes, yielding a pure population of tumor cells. Negative I-RPM assay is efficient and reproducible and displays moderate to strong correlation with the gold standard of immunohistochemistry.
Several studies have shown that, even for a single antigen, different immunostaining profiles in formalin-fixed, paraffin-embedded tissue can result from interlaboratory (e.g., processing protocols, pathologist bias, and antibody clone) and intralaboratory (e.g., age of formalin-fixed, paraffin-embedded tissue) variability (13, 14). Although not yet available for routine use, computer-based technologies promise to reduce observer bias and increase the dynamic range of measuring biomarkers (15). In this study, grading for gp100 by immunohistochemistry correlated strongly with immunocytochemistry. Although we did not assess interobserver differences in interpreting immunohistochemistry or immunocytochemistry, this is a frequent source of bias (2). Thus, although grading of gp100 expression is not compromised by observer bias, processing protocols, or formalin fixation, immunohistochemistry is be limited by a poor dynamic range and possible interobserver bias.
In contrast to immunohistochemistry, RPM was designed to objectively quantify tumor antigens by avoiding exposure to formalin or subjective grading by a pathologist (4). However, classic RPM is compromised by the need for laser capture microdissection, which typically yields minimal protein quantities. Because the majority, if not all, of ‘‘contaminating’’ cells are leukocytes and histiocytes, negative immunochromatography on macroscopically pure tumor samples routinely yielded evaluable protein lysate. This modified protocol, called I-RPM, was reproducible and showed moderate to strong correlation with immunohistochemistry and immunocytochemistry. These results are intriguing because I-RPM is more quantitative than immunohistochemistry and, therefore, may be a more effective method for studying tissue biomarkers. Furthermore, this modified RPM can be done exclusive of pathology expertise or time-consuming microdissection.
The strength of RT-PCR lies in its large dynamic range and the ability to reproducibly quantify transcript levels on a continuous scale. In this study, RT-PCR displayed only moderate correlation with immunohistochemistry. Furthermore, the strength of correlation with RPM was antigen dependent, strongly for MART-1 and moderately for gp100. This is not surprising because RNA transcript levels in patient-derived tissues frequently do not correlate with protein level (7). Therefore, although RT-PCR has several advantages over immunohistochemistry and RPM, correlations between RNA levels and protein expression should be confirmed for each gene/antigen.
Although immunostaining of tissues remains the gold standard, I-RPM is a promising technology that allows quantification of protein expression on a continuous scale and without the need for laser-capture microscopy or a pathologist. Further experiments are warranted to validate our results and determine whether, in fact, quantification of protein levels by I-RPM provides clinically useful information. Finally, all assays are, to some degree, antigen dependent, and thus it may be prudent to validate novel biomarkers by at least immunohistochemistry and reverse-phase lysate microarrays.
References
- 1.Zolg JW, Langen H. How industry is approaching the search for new diagnostic markers and biomarkers. Mol Cell Proteomics. 2004;3:345–54. doi: 10.1074/mcp.M400007-MCP200. [DOI] [PubMed] [Google Scholar]
- 2.Taylor CR. The total test approach to standardization of immunohistochemistry. [see comment] Arch Pathol Lab Med. 2000;124:945–51. doi: 10.5858/2000-124-0945-TTTATS. [DOI] [PubMed] [Google Scholar]
- 3.Stoughton RB, Friend SH. Innovation: how molecular profiling could revolutionize drug discovery. Nat Rev Drug Discov. 2005;4:345–50. doi: 10.1038/nrd1696. [DOI] [PubMed] [Google Scholar]
- 4.Liotta LA, Espina V, Mehta AI, et al. Protein microarrays: meeting analytical challenges for clinical applications. Cancer Cell. 2003;3:317–25. doi: 10.1016/s1535-6108(03)00086-2. [DOI] [PubMed] [Google Scholar]
- 5.Chan SM, Ermann J, Su L, Fathman CG, Utz PJ. Protein microarrays for multiplex analysis of signal transduction pathways. Nat Med. 2004;10:1390–6. doi: 10.1038/nm1139. [DOI] [PubMed] [Google Scholar]
- 6.Nishizuka S, Charboneau L, Young L, et al. Proteomic profiling of the NCI-60 cancer cell lines using new high-density reverse-phase lysate microarrays. Proc Natl Acad Sci U S A. 2003;100:14229–34. doi: 10.1073/pnas.2331323100. [DOI] [PMC free article] [PubMed] [Google Scholar]
- 7.Ginestier C, Charafe-Jauffret E, Bertucci F, et al. Distinct and complementary information provided by use of tissue and DNA microarrays in the study of breast tumormarkers. Am J Pathol. 2002;161:1223–33. doi: 10.1016/S0002-9440(10)64399-4. [DOI] [PMC free article] [PubMed] [Google Scholar]
- 8.Yannelli JR, Hyatt C, McConnell S, et al. Growth of tumor-infiltrating lymphocytes from human solid cancers: summary of a 5-year experience. Int J Cancer. 1996;65:413–21. doi: 10.1002/(SICI)1097-0215(19960208)65:4<413::AID-IJC3>3.0.CO;2-#. [DOI] [PubMed] [Google Scholar]
- 9.Paweletz CP, Charboneau L, Bichsel VE, et al. Reverse phase protein microarrays which capture disease progression show activation of pro-survival pathways at the cancer invasion front. Oncogene. 2001;20:1981–9. doi: 10.1038/sj.onc.1204265. [DOI] [PubMed] [Google Scholar]
- 10.Fetsch PA, Steinberg SM, Riker AI, Marincola FM, Abati A. Melanoma antigen expression in serial fine-needle aspiration samples in patients with metastatic malignant melanoma participating in immunotherapy clinical trials: a preliminary look. Cancer. 2001;93:409–14. doi: 10.1002/cncr.10138. [DOI] [PubMed] [Google Scholar]
- 11.Aerts JL, Gonzales MI, Topalian SL. Selection of appropriate control genes to assess expression of tumor antigens using real-time RT-PCR. Biotechniques. 2004;36:84–6. 88, 90–1. doi: 10.2144/04361ST04. [DOI] [PubMed] [Google Scholar]
- 12.Georgieva J, Milling A, Orfanos CE, Geilen CC. Magnetic bead RT-PCR: establishment of a new method for detecting circulating melanoma cells. Melanoma Res. 2002;12:309–17. doi: 10.1097/00008390-200208000-00002. [DOI] [PubMed] [Google Scholar]
- 13.Atkins D, Reiffen KA, Tegtmeier CL, Winther H, Bonato MS, Storkel S. Immunohistochemical detection of EGFR in paraffin-embedded tumor tissues: variation in staining intensity due to choice of fixative and storage time of tissue sections. J Histochem Cytochem. 2004;52:893–901. doi: 10.1369/jhc.3A6195.2004. [DOI] [PubMed] [Google Scholar]
- 14.Sauter G, Simon R, Hillan K. Tissue microarrays in drug discovery. Nat Rev Drug Discov. 2003;2:962–72. doi: 10.1038/nrd1254. [DOI] [PubMed] [Google Scholar]
- 15.Giltnane J, Rimm D. Technology insight: identification of biomarkers with tissue microarray technology. Nat Clin Pract Oncology. 2004;1:104–11. doi: 10.1038/ncponc0046. [DOI] [PubMed] [Google Scholar]