Abstract
Cardiolipin is a prominent component of the mitochondrial inner membranes contributing to the regulation of multiple discrete mitochondrial functions. Here, we extend shotgun lipidomics to identify and quantitate cardiolipin molecular species directly from lipid extracts of biological samples. Three shotgun lipidomics approaches for analyses of cardiolipin molecular species were developed using either a continuous ion-transmission instrument (i.e., triple-quadrupole type) with either low or high mass resolution settings or a high mass resolution hybrid pulsed instrument [i.e., quadrupole time-of-flight (QqTOF) type]. Three chemical principles were used for the development of these approaches. These include the marked enrichment of linoleate in cardiolipin to maximize the signal-to-noise ratio, the specific neutral loss of ketenes from doubly charged cardiolipin molecular ions to yield doubly charged triacyl monolysocardiolipins, and the doubly charged character of two phosphates in each cardiolipin molecular species. Through these techniques, we identified and quantified the specific molecular species profiles of cardiolipin directly from lipid extracts of mouse heart, liver, and skeletal muscle. The accuracy (~5%) and the low end of the linear dynamic range (10 fmol/μl) for quantitation make these approaches useful for studying alterations in cardiolipin metabolism in multiple disease states using either type of mass spectrometer.
Cardiolipin (1,3-diphosphatidyl-sn-glycerol) is a unique class of anionic phospholipids, because each molecular species is composed of a dimer of two phosphatidyl moieties, three chiral centers in three distinct glycerol moieties, and four fatty acyl chains. Cardiolipin is predominantly, if not nearly exclusively, present in mitochondrial membranes in eukaryotic cells (1, 2), and its genetic ancestry can be traced back to bacterial membranes. Thousands of distinct molecular species, including regioisomers, would be present in the cellular membranes if all naturally occurring fatty acids were randomly incorporated into cardiolipin molecular species (3). However, biological organisms selectively use a very limited array of fatty acids for the biosynthesis of cardiolipin molecular species in a stereoselective manner that is species-, organ-, and cell type-specific. This is accomplished through remodeling enzymes (e.g., the tazaffins), which exist in multiple splice variants. In heart, linoleate is present predominantly in the acyl chains of cardiolipin molecular species (3, 4). Therefore, in heart, cardiolipin represents an enriched storage depot of linoleic acid relative to other phospholipid classes. The biochemical mechanisms underlying the production of linoleate-enriched cardiolipin and its effects on biological function remain incompletely understood. In large part, this results from previous technical difficulties in accurately identifying and quantifying low-abundance individual cardiolipin molecular species.
Cardiolipin possesses unique physical and chemical properties that promote its role as an effector of multiple highly specific biological functions (for recent reviews, see 2, 5–7). The essential role of cardiolipin in mitochondrial function and cardiac hemodynamics was underscored recently through the identification of a genetic disorder, Barth’s syndrome, in which genetic mutations in this X-linked gene (Xq28) induce altered cardiolipin metabolism, resulting in cardiolipin depletion and molecular species changes, thereby precipitating mitochondrial dysfunction and a striking cardiomyopathy and neutropenia (8–12). Recently, we demonstrated that cardiolipin was substantially depleted in diabetic mouse myocardium (13), in which mitochondrial dysfunction is manifest. The importance of cardiolipin in regulating multiple mitochondrial signaling functions and bioenergetics in mammalian cells is becoming increasingly appreciated.
Despite the obvious importance of cardiolipin in physiological function and its role in mediating the pathological sequelae of disease states, the quantitative analysis of cardiolipin, particularly at the molecular species level, greatly lags behind that of other cellular lipid classes. Historically, researchers have used thin-layer chromatographic techniques or HPLC coupled with various detector devices to quantitate the mass content of cardiolipin (3, 14). In these approaches, cardiolipin molecular species were only identified by GC-MS after multiple chemical reactions and/or derivatization procedures, which destroy important chemical information affecting membrane properties. Recently, Valianpour and colleagues (15) reported electrospray ionization (ESI)-MS product ion analyses of doubly charged cardiolipin molecular ions to identify and quantify cardiolipin molecular species in platelet lipid extracts from Barth syndrome patients after separation of cardiolipin class by normal-phase HPLC. In addition, Sparagna and colleagues (4) used singly charged cardiolipin molecular ions to identify and quantify cardiolipin molecular species in rat myocardial or mitochondrial lipid extracts after separation of the cardiolipin class by normal-phase HPLC.
Recently, we developed an approach to globally analyze individual lipid molecular species of a biological sample without chromatographic separation directly from lipid extracts; this approach is now known as shotgun lipidomics (16–19). Shotgun lipidomics is a multistep process using multiplexed extractions, intrasource separation, and multidimensional mass spectrometry and array analysis. Quantitation in shotgun lipidomics is accomplished by a two-step procedure. In the first step, the abundant and nonoverlapping molecular species of a class are quantitated by ratiometric comparisons with a preselected internal standard of the class after deisotoping. In the second step, all of the determined molecular species of the class plus the preselected internal standard are used as standards to determine the mass content of other low-abundance or overlapping molecular species using one or more tandem mass traces (each of which characterizes a specific feature of the class of interest) by two-dimensional MS. Through the use of this second ratiometric step for quantitation, the linear dynamic range for quantitation can be extended dramatically by eliminating background noise and eliminating the overlapping molecular species through this multidimensional approach.
Although this technology has already been used to estimate the nonoverlapping molecular species of cardiolipin on several occasions (13), the full power of this approach for the accurate quantitation of individual low-abundance molecular species present in the entire cardiolipin class has not yet been realized. In this study, we extended shotgun lipidomics to identify and quantitate multiple low-abundance cardiolipin molecular species directly from lipid extracts of biological samples. Three shotgun lipidomics approaches for analyses of cardiolipin molecular species were developed using either a continuous ion-transmission instrument [i.e., triple-quadrupole (QqQ) type] with either a low or high mass resolution setting or a high mass resolution hybrid pulsed mass spectrometer (i.e., QqTOF type). Three chemical principles were used for the development of shotgun lipidomics for cardiolipin analysis. These include exploiting the marked enrichment of linoleate in cardiolipin to maximize the signal-to-noise ratio, using the specific neutral loss of ketenes from doubly charged cardiolipin molecular ions to yield doubly charged triacyl monolysocardiolipins, and taking advantage of the doubly charged character of two phosphates in each cardiolipin molecular species. No evidence of “ion suppression” resulting from the presence of other more abundant lipids in the solution was manifest as long as an appropriately diluted solution was used. Through these techniques, accurate quantitation of multiple low-abundance cardiolipin molecular species was accomplished and we identified the specific profiles of cardiolipin molecular species in the lipid extracts of mouse heart, liver, and skeletal muscle. The accuracy (~5%) and the low end of the linear dynamic range (10 fmol/μl) for quantitation make these approaches useful for studying alterations in cardiolipin metabolism in multiple disease states using either type of mass spectrometer.
MATERIALS AND METHODS
Materials
Synthetic phospholipids, including 1,1′,2,2′-tetramyristoyl cardiolipin (T14:0 CL) and 1,1′,2,2′-tetraoleoyl cardiolipin (T18:1 CL) were purchased from Avanti Polar Lipids, Inc. (Alabaster, AL). Both cardiolipin molecular species were quantitated by capillary gas chromatography after methanolysis (20). Solvents for sample preparation and for mass spectrometric analysis were obtained from Burdick and Jackson (Honeywell International, Inc., Muskegon, MI). All other chemical reagents were of at least analytical grade or the best grade available and were obtained from either Fisher Scientific (Pittsburgh, PA) or Sigma-Aldrich Chemical Co. (St. Louis, MO), or as indicated.
Sample preparation for mass spectrometric analyses
Individual stock solutions of T14:0 CL and T18:1 CL in chloroform-methanol (1:1, v/v) were prepared and stored under nitrogen at −20°C. The solutions were brought to room temperature just before use. One mixture of each ratio of T14:0 CL to T18:1 CL at a total concentration of 100 nmol/μl was prepared from the stock solutions using gas-tight syringes. All of the mixed solutions with various ratios of T14:0 CL to T18:1 CL were extracted twice by a modified Bligh and Dyer technique (21) using 10 mM LiCl in an aqueous layer. The extracts were dried under a nitrogen stream, dissolved in chloroform, filtered with 0.2 μm Gelman acrodisc CR polytetrafluoroethylene (PTFE) syringe filters (Gelman Science, Ann Arbor, MI), and dried under a nitrogen stream. The dried cardiolipin mixtures were resuspended in chloroform-methanol (1:1, v/v) to reconstitute the originally prepared concentration, stored at −20°C after gently flushing with nitrogen, and used within 1 week after preparation. Before infusion of cardiolipin solution into an ESI ion source, these stock mixtures were diluted to the desired concentrations with chloroform-methanol (1:1, v/v).
Male mice (C57BL/6, 4 months of age) were purchased from The Jackson Laboratory (Bar Harbor, ME). The tissues, including heart, liver, and skeletal muscle, from each mouse were dissected quickly and perfused with diluted (10-fold) phosphate-buffered saline. Extraneous tissue and fat were removed from the liver and heart. Each of the collected tissues was quickly dried with Kimwipes after perfusion and immediately freeze-clamped at the temperature of liquid nitrogen. Wafers were pulverized into a fine powder with a stainless-steel mortar and pestle. Protein assays were performed on the fine powder. A sample (~10 mg) from each tissue was weighed to a disposable glass culture test tube, and 4 ml of chloroform-methanol (1:1, v/v) and 1.8 ml of 50 mM LiCl were added to each test tube before addition of the internal standard (i.e., T14:0 CL) for quantitation of cardiolipin molecular species. The amount of T14:0 CL added to each sample was 3.0 nmol/mg protein for mouse heart, liver, and skeletal muscle samples, based on the protein assay result. Lipids were extracted and then back-extracted by the modified method of Bligh and Dyer (21), as described previously (13, 17). Each lipid extract was reconstituted to a concentration of 100 μl/mg protein (which was based on the original protein content of the samples as determined from protein assays) in chloroform-methanol (1:1, v/v). The lipid extracts were finally flushed with nitrogen, capped, and stored at −20°C for ESI-MS (typically analyzed within 1 week). Each lipid solution was further diluted ~100-fold for the solutions from heart, liver, and muscle just before infusion and analysis of cardiolipin molecular species.
An additional lipid extract of mouse liver without the addition of internal standard was also prepared as described above from 50 mg of the pulverized powder of mouse liver. The extract was reconstituted to a final concentration of 260 nmol total lipids/mg protein/100 μl, which was facilitated based on our previous study results (17) and a protein assay. Different amounts of equimolar mixtures of T14:0 CL and T18:1 CL as indicated were mixed with part of the lipid extract before dilution and infusion of lipid solution.
Instrumentation and mass spectrometry
ESI-MS analyses were performed on a QqQ mass spectrometer (ThermoElectron TSQ Quantum Ultra, San Jose, CA) equipped with an electrospray ion source and operated with the Xcalibur software system (22). The settings for peak width (which is related to mass resolution) were varied as indicated. The diluted lipid extract solution was infused directly into the ESI source at a flow rate of 4 μl/min with a syringe pump and analyzed in the negative ion mode. Typically, a 2 min period of signal averaging in the profile mode was used for each MS spectrum. Product ion analysis was performed by selecting an ion of interest in the first quadrupole and analyzing the fragments in the third quadruple while collision activation was performed in the second quadrupole. Tandem mass spectrometry in the precursor ion mode was performed by scanning the first quadrupole in the mass range of interest and monitoring the third quadruple with an ion of interest while collision activation was performed in the second quadrupole. For tandem mass spectrometry in the negative ion neutral loss mode, both the first and third quadrupoles were coordinately scanned with a mass difference (i.e., neutral loss) corresponding to the neutral loss of a ketene (representing a building block of cardiolipin molecular species) from doubly charged cardiolipin ions while collisional activation was performed in the second quadrupole. The collision gas pressure was set at 1.0 mTorr, and the collision energy was varied as follows: precursor ion analysis of a glycerophosphate derivative (precursor ion 153.1), 35 eV; precursor ion analyses of a variety of fatty acyl carboxylates, 28 eV; neutral loss analyses of a variety of ketenes, 22 eV; and product ion analyses of cardiolipin molecular ions, 28 eV. Typically, a 4 min period of signal averaging in the profile mode was used for each tandem MS spectrum. All of the MS spectra and tandem MS spectra were automatically acquired by a customized sequence subroutine and smoothed by a Gaussian peak-fitting process operated with Xcalibur software. Data processing of two-dimensional mass spectrometric analyses, including ion peak selection, data transferring, peak intensity comparison, and quantitation, was conducted as described previously (17) using MicroSoft Excel macros.
The ion peak intensities of doubly charged cardiolipin molecular species using the QqQ instrument at low mass resolution (e.g., setting at a peak width of 0.7 Th) were determined by deconvolution using multiple Gaussian functions of the Origin 7.0 nonlinear least-squares-fitting software (www.OriginLab.com). The number of Gaussian functions used was determined by adding Gaussians until the residual was structureless. For example, a two-feature curve (e.g., two peaks in a heavily overlapped spectrum) generally requires two Gaussians, a three-feature curve needs three Gaussians, etc. The fitting procedure yielded Gaussian features with fitted peak intensities, peak positions, and the full-width-at-half-maximums. The fitted peak intensity, which has subtracted the contributions from its neighbor peaks, was attributed to the real peak intensity of the corresponding m/z.
ESI-MS analyses were also performed on a QqTOF mass spectrometer (MDS Sciex QStar XL; Applied Biosystems, Concord, Canada) equipped with an electrospray ion source. The instrument was operated with Analyst QS 1.1 software. The following instrumental settings were used: spray voltage, −4,500 V; declustering potential, −60 V; focusing potential, −265 V; declustering potential 2, −15 V; focusing rod offset, −15; ion source gas, scale 2; curtain gas, scale 20; collision gas, 2 mTorr; ion release delay, 2 ms. All ESI-MS analyses of lipids were conducted by direct infusion using a Harvard syringe pump at a flow rate of 6 μl/min. Typically, a 1 min period of signal averaging was used for each TOF-MS spectrum. For product ion analyses, the precursor ion was selected by the first quadrupole with a mass window of 0.7 Th, collision-induced dissociation occurred in the second quadrupole, and the resulting fragments were analyzed with a time-of-flight analyzer. The collision gas (nitrogen) pressure was set at 1.0 mTorr, and a collision energy of 40 eV was used for all cardiolipin molecular species. Typically, a 2 min period of signal averaging in the profile mode was used for each tandem MS spectrum.
Miscellaneous
Protein concentration was determined with a bicinchoninic acid protein assay kit (Pierce, Rockford, IL) using BSA as a standard. Data from biological samples were normalized to the protein content, and all data are presented as means ± SD of four separate animals.
RESULTS AND DISCUSSION
Quantitative analyses of mixtures composed of synthetic cardiolipin molecular species with a QqQ mass spectrometer with a mass resolution setting of peak width 0.7 Th
Negative ion ESI mass spectrometric analyses of equimolar mixtures of T14:0 CL and T18:1 CL ranging from 0.01 to 10 pmol/μl of each species on a QqQ-type instrument using a low mass resolution setting demonstrated two intense peaks corresponding to deprotonated, doubly charged cardiolipin molecular ions of T14:0 CL and T18:1 CL (Fig. 1). These ions were confirmed by product ion analyses (spectra not shown), as described previously (23). Peaks corresponding to deprotonated, singly charged cardiolipin molecular ions were minimal (data not shown) when samples were analyzed under the experimental conditions.
Fig. 1.
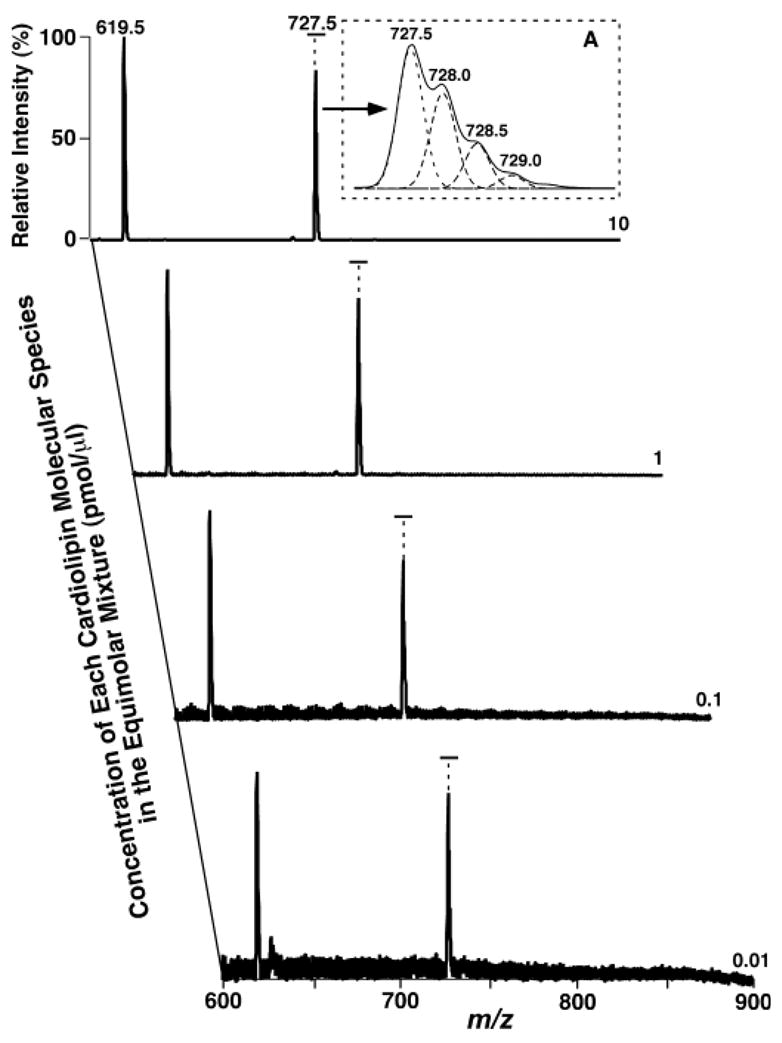
Electrospray ionization (ESI)-MS analyses of equimolar mixtures of cardiolipin molecular species at selected concentrations. Preparation of equimolar mixtures of 1,1′,2,2′-tetramyristoyl cardiolipin (T14:0 CL) and T18:1 CL at selected concentrations and negative ion ESI-MS analyses of these equimolar mixtures in the negative ion mode by direct infusion were performed on a triple-quadrupole (QqQ) mass spectrometer using a peak width setting of 0.7 Th, as described in detail in Materials and Methods. The abundant ions at m/z 619.5 and 727.5 are doubly charged T14:0 CL and T18:1 CL molecular species, respectively, as indicated. Inset A shows an expanded spectrum of the doubly charged T18:1 CL molecular ion. The dashed line peaks in inset A are the results of deconvolution analysis of the doubly charged T18:1 CL isotopomers.
The mass resolution of a QqQ-type instrument at the setting of peak width 0.7 Th is unit resolution. However, this level of mass resolution represents that available for many QqQ-type mass spectrometers. The 13C isotopomers of the doubly charged cardiolipin molecular species cannot be completely resolved using a setting of peak width 0.7 Th (Fig. 1, inset A). Therefore, these ion peak intensities had to be determined using a deconvolution program (Fig. 1, inset A). The intensities of the paired ions from each of the equimolar mixtures of T14:0 CL and T18:1 CL were essentially equal within experimental errors after both ion peaks were deconvoluted and subsequently deisotoped, as described previously (18, 24). Figure 1 shows examples of mass spectra that were acquired using different concentrations of the equimolar mixtures in which the T18:1 CL ion peak intensity was normalized to that of T14:0 CL after deisotoping.
Negative ion ESI-MS analyses of T18:1 CL and T14:0 CL mixtures were also performed under these experimental conditions in a much wider range of total concentrations (i.e., 0.005–100.0 pmol/μl) and a much wider molar concentration ratio (i.e., 0.065–26.0) than that shown in Fig. 1. Figure 2A shows a plot of the normalized ratios (i.e., the ratios of the peak intensity ratios to molar concentration ratios of T18:1 CL to T14:0 CL) versus the concentration of one cardiolipin molecular species (e.g., T14:0 CL) in the mixtures. The results demonstrated that, in a 1,000-fold concentration range from 0.01 to 10 pmol/μl, the averaged, normalized ratios were equal to the theoretical ratio of 1 within experimental error (Fig. 2). The ion peak intensity ratios of T18:1 CL to T14:0 CL in this concentration region were well correlated with the molar ratios of the mixtures, with a slope of 0.962 and a correlation coefficient of 0.9942 (Fig. 2B).
Fig. 2.
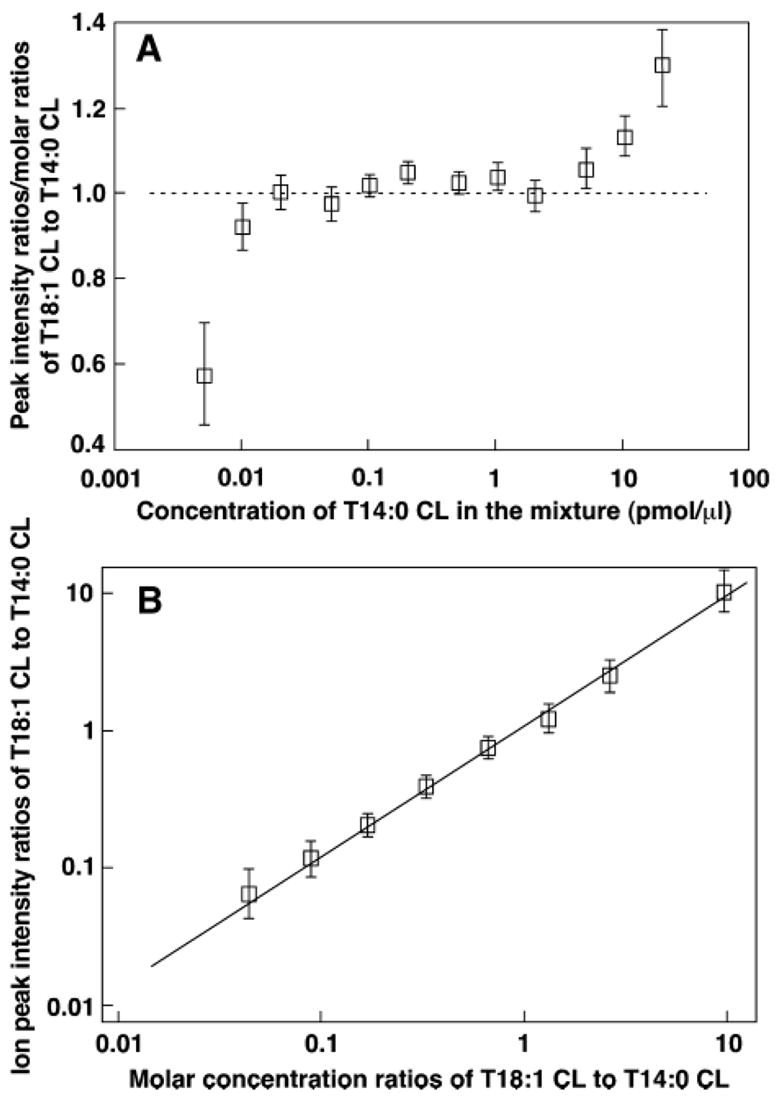
Quantitative analyses of cardiolipin mixtures with different molar ratios and at various concentrations with a QqQ-type ESI mass spectrometer. Preparation of T14:0 CL and T18:1 CL mixtures with different molar ratios and at various concentrations and ESI-MS analyses in the negative ion mode by direct infusion were performed on a QqQ mass spectrometer using a peak width setting of 0.7 Th, as described in Materials and Methods. A: Plot of the normalized ratios (i.e., ion peak intensity ratios vs. molar concentration ratios of T18:1 CL and T14:0 CL) versus the concentrations of T14:0 CL in the lipid mixtures. Each of the normalized ratios of T18:1 CL and T14:0 CL represents an averaged ratio from all determinations of different molar ratios of T18:1 CL and T14:0 CL with the concentration of T14:0 CL in the mixture as indicated. B: Linear correlation between ion peak intensity ratios and molar ratios of T18:1 CL and T14:0 CL in the molar ratio range 0.065–10. Each of the peak intensity ratios was determined from the linear concentration region as shown in A (i.e., 0.02–7 pmol/μl of each cardiolipin molecular species). Each data point represents the mean ± SD from different ratios of T18:1 CL and T14:0 CL at each given concentration of T14:0 CL.
These results demonstrated that at least a 1,000-fold linear dynamic range for the quantitation of individual cardiolipin molecular species by ratiometric comparison of the peak intensity of a cardiolipin molecular ion with that of a selected internal standard after deisotoping was possible. The accuracy of quantitation is ~5%, according to the linear correlation slope that is deviated from a theoretical slope of 1. The low-end limitation of the linear quantitation is ~10 fmol/μl (Fig. 2A). The best concentration range of an internal standard to be used for quantitation using the QqQ ESI mass spectrometer is between 0.02 and 7 pmol/μl in a very broad molar ratio (i.e., 0.065–26.0 as examined) of two cardiolipin species (Fig. 2A).
The averaged, normalized ratios in the very low concentration range (e.g., <10 fmol/μl T14:0 CL) were significantly less than the theoretical ratio of 1, and the ratios decreased as the concentrations of T14:0 CL decreased (Fig. 2A). This deviation likely results from the influence of background noise that contributes a substantial component of the peak intensity of the selected internal standard (i.e., T14:0 CL) at the low concentration relative to the other cardiolipin molecular species, of which the concentrations varied, thereby leading to a smaller T18:1 CL to T14:0 CL peak intensity ratio. This also explains why the deviation of the data in this low concentration region is much wider than that of the data acquired from the higher concentration range, because the background noise differentially contributes to the peak intensity of the T18:1 CL molecular ion in a concentration-dependent manner. The influence of background noise can be minimized by either using a more sensitive instrument or using shotgun lipidomics, with a second step process for quantitation that will be discussed below, thereby extending the linear dynamic range through which quantitation is possible. We limited the total concentration of the cardiolipin mixture to the 5 fmol/μl at the lowest concentration used in this study.
In contrast to the low-end concentrations studied, the averaged, normalized ratios in the high concentration regime (i.e., >10 pmol/μl) were greater than the theoretical ratio of 1, and the ratios were increased as the concentrations increased. This phenomenon likely results from lipid-lipid interactions leading to a loss of ionization efficiency, as we have discussed extensively (18). For example, the total concentration of the mixture at 10 pmol/μl T14:0 CL with a molar ratio of T18:1 CL to T14:0 CL at 5 is 60 pmol/μl, at which the averaged, normalized ratio determined was 1.10 (i.e., a 10% deviation from the theoretical value). Therefore, the upper limit of the total concentration of cardiolipin in the mixture was set to 100 pmol/μl.
Next, the effects of lipid molecular species in other lipid classes on the quantitation of cardiolipin molecular species were also examined by the addition of different amounts of equimolar mixtures of T18:1 CL and T14:0 CL into a diluted lipid extract of mouse liver. The total lipid concentration of the diluted liver lipid extract was fixed at 100 pmol/μl. Negative ion ESI-MS analyses demonstrated a theoretical peak intensity ratio of 1, with an equimolar mixture of T18:1 CL and T14:0 CL molecular ions at m/z 619.5 and 727.5 after deisotoping, when different amounts of cardiolipin were added as indicated into the diluted mouse liver lipid extract (Fig. 3). Thus, ratiometric comparisons of the peak intensities of cardiolipin molecular ions after deisotoping can be used to directly quantitate individual cardiolipin molecular species from a diluted total lipid extract (i.e., shotgun lipidomics of cardiolipin). It should be noted that the increases in the ion peak intensities were not linearly correlated with the mass of cardiolipin that was spiked into the hepatic lipid extracts, as a result of the intrasource separation and selective ionization of anionic lipids from other lipid classes, as described recently (25).
Fig. 3.
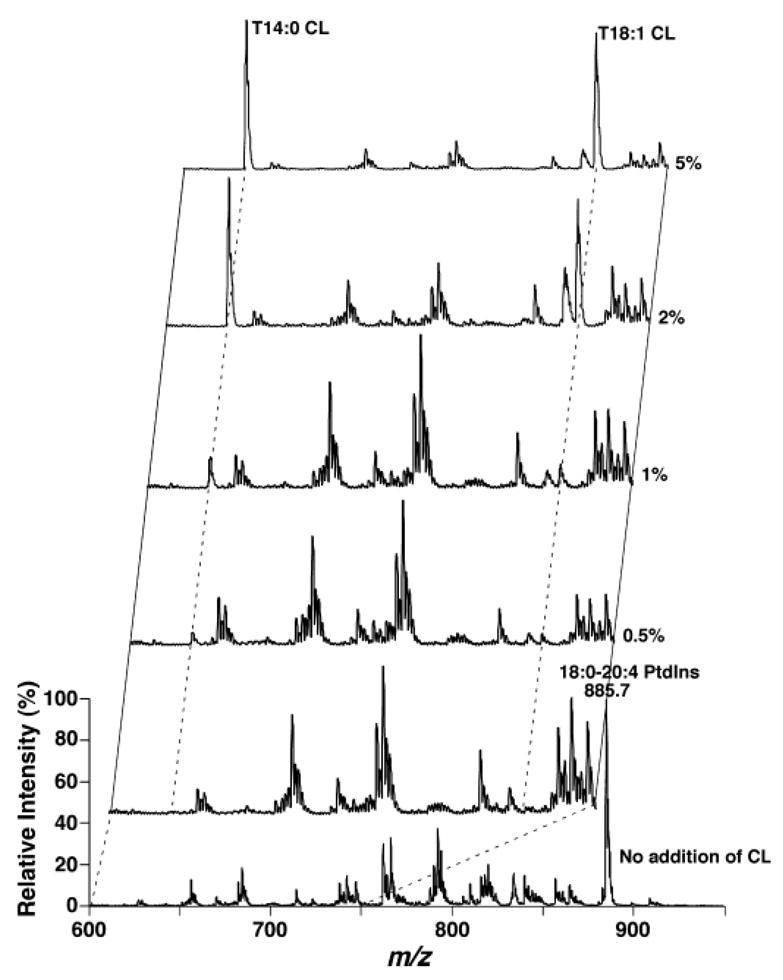
Effects of coexisting large amounts of mouse hepatic lipids on quantitative analyses of equimolar mixtures of cardiolipin molecular species at different concentrations. A small amount of an equimolar mixture of cardiolipin molecular species was added into the lipid extracts of mouse liver before dilution of the total lipid solution to <100 pmol/μl and direct infusion. The concentrations of the lipid extracts of mouse livers were estimated based on our quantitative determination, as described previously (17). Mass spectrometric analyses were performed in the negative ion mode after spiking 0.5, 1, 2, and 5 mol% of total cardiolipin into the mouse liver extracts on a QqQ mass spectrometer using a peak width setting of 0.7 Th. The insets represent the expanded spectra of the region containing doubly charged cardiolipin molecular ions as indicated. PtdIns, phosphatidylinositol.
Shotgun lipidomics of cardiolipin of lipid extracts from biological samples with a QqQ mass spectrometer using a low mass resolution setting of peak width 0.7 Th
Because quantitative ratiometric comparisons between abundant individual cardiolipin molecular ions and the ion of the preselected internal standard were established above, identification (Fig. 4, inset A) and quantitation of abundant and nonoverlapping doubly charged cardiolipin molecular species are straightforward even using a QqQ mass spectrometer at a low mass resolution setting (e.g., peak width 0.7 Th). However, identification and quantitation of minor and/or overlapping cardiolipin molecular species in lipid extracts of biological samples require additional considerations when a low mass resolution setting is used. In shotgun lipidomics performed using a low mass resolution setting, cardiolipin molecular species were identified by two-dimensional MS analyses of the building blocks of cardiolipin in the negative ion mode directly from a diluted lipid extract (Fig. 4). The building blocks of cardiolipin molecular species include glycerophosphate (m/z 153.1), the neutral loss of ketenes from doubly charged cardiolipin ions to yield doubly charged triacyl monolysocardiolipins, and all of the potential naturally occurring fatty acyl carboxylates (18, 19). Because of the features of the neutral loss scanning of ketenes (corresponding to all of the potential naturally occurring fatty acids) from cardiolipins, the peak resolution of the resultant triacyl monolysocardiolipin fragments were much higher compared with those of other cardiolipin building blocks that were obtained by precursor ion scanning, as discussed previously (18). Moreover, neutral loss scanning of ketene building blocks acts as a pseudofilter to minimize the 13C isotopomers, thereby resulting in well-resolved unit resolution ion peaks compared with the molecular ion clusters (see expanded cluster at m/z 747.6 of neutral loss 131.1 in Fig. 4). Furthermore, these ketene building blocks to yield doubly charged triacyl lysocardiolipin ions are highly specific to the doubly charged cardiolipin molecular species. Therefore, identification of the low-abundance and/or overlapping cardiolipin molecular species is now apparent under the experimental conditions used even with a low mass resolution setting.
Fig. 4.
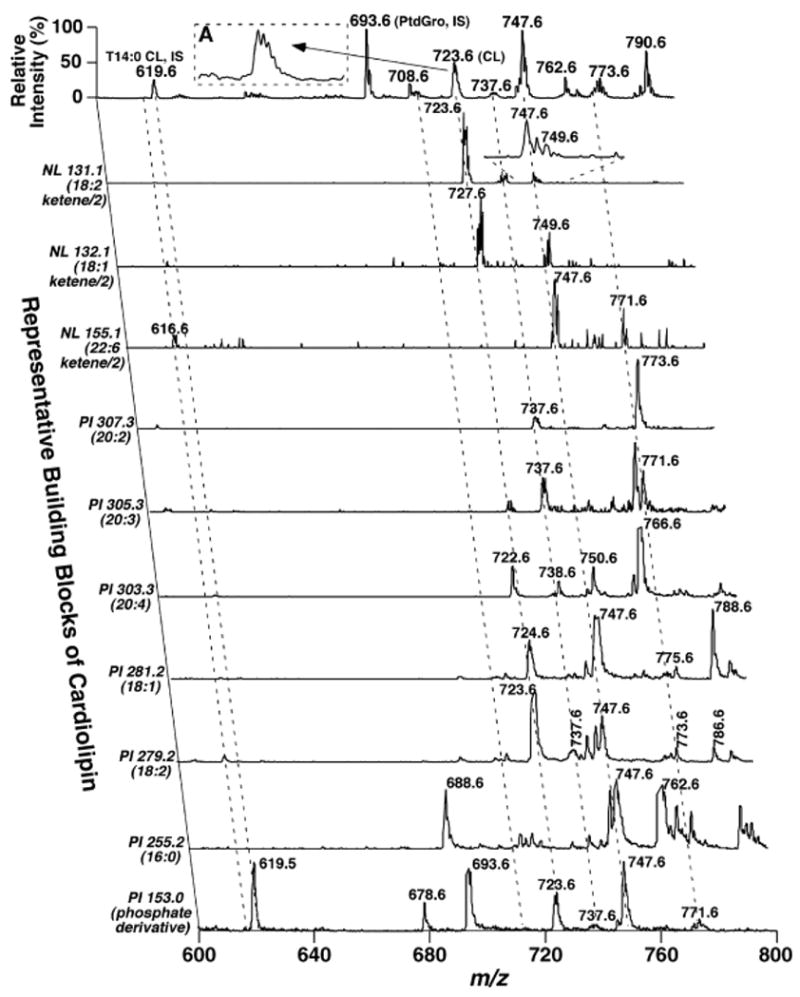
Two-dimensional mass spectrometric analysis of cardiolipin molecular species in lipid extracts of mouse myocardium. Each MS or tandem MS trace of two-dimensional ESI mass spectra was acquired by sequentially programmed custom scans with Xcalibur software on a QqQ mass spectrometer using a peak width setting of 0.7 Th, as described in Materials and Methods. For negative ion tandem mass spectrometry in the precursor ion (PI) mode, the first quadrupole was scanned in the selected mass range, the second quadruple was used as a collision cell, and the third quadrupole was fixed to monitor the building block ions of cardiolipin (i.e., either glycerophosphate or a fatty acyl carboxylate). For tandem mass spectrometry in the negative ion neutral loss (NL) mode, both the first and third quadrupoles were coordinately scanned with a mass difference (i.e., neutral loss) corresponding to the neutral loss of a ketene (representing a building block of cardiolipin molecular species) from doubly charged cardiolipin ions, whereas collisional activation was performed in the second quadrupole. Most of the mass spectral traces were displayed after normalization to the most intense peak (base peak) in each individual trace, although some of them were displayed after truncating the most abundant ion peak to show the low-abundance fragments. IS denotes internal standard; CL represents doubly charged cardiolipin. The broken lines indicate the analyses of some of the cardiolipin molecular species. PtdGro, phosphatidylglycerol.
Regarding the quantitation of these low-abundance and/or overlapping cardiolipin molecular species, we exploited the marked enrichment of linoleate in cardiolipin compared with that in other lipid classes and the presence of at least one linoleate chain in almost all cardiolipin molecular species (3, 4) to use a strategy that maximally measured the signal-to-noise ratios using precursor ion scanning of linoleate. Because the linoleate fragment is much more intense than glycerophosphate and triacyl lysocardiolipin fragment ions (Fig. 5) and the linoleate ion intensity signal is amplified by the presence of multiple linoleoyl chains in most cardiolipin species, the sensitivity and accuracy with linoleate are much higher than that using glycerophosphate (or other less abundant fatty acids in cardiolipin) or ion peaks resulting from ketene loss for the quantitation of minor and/or overlapping cardiolipin molecular species in the second step of the quantitation process.
Fig. 5.
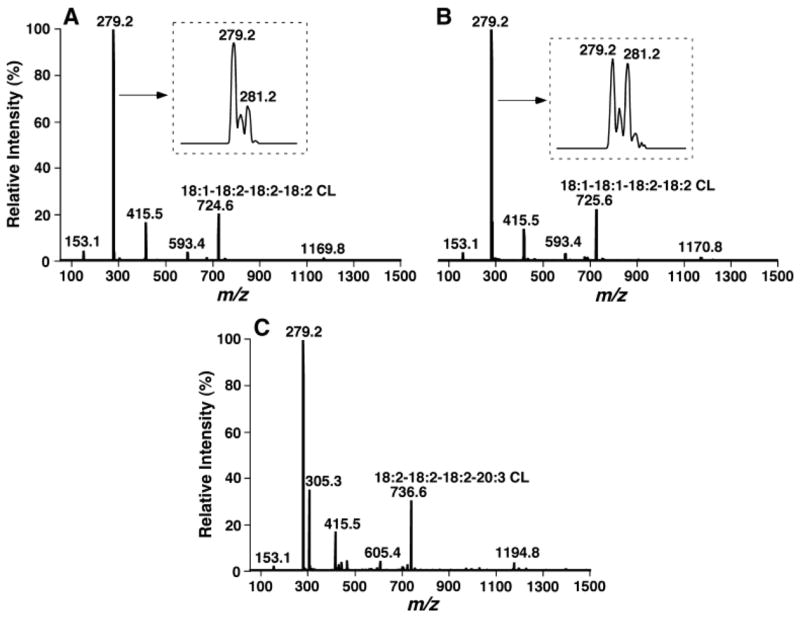
Product ion analyses of cardiolipin molecular species present in lipid extracts of biological samples. Product ion ESI-MS analyses of cardiolipin molecular species in lipid extracts of mouse myocardium at m/z 724.6 (A), 725.6 (B), and 736.6 (C) were performed on a QqQ mass spectrometer using a peak width setting of 0.7 Th by selection of the molecular ion in the first quadrupole, collision activation in the second quadrupole with a collision energy of 28 eV and gas pressure of 1 mTorr, and analysis of the resultant product ions in the third quadrupole.
Moreover, product ion ESI-MS analyses demonstrated that the peak intensity ratio of fatty acyl carboxylates from each of the doubly charged cardiolipin molecular ions from all examined lipid extracts of biological samples was quite proportional to the ratio of the numbers of identical acyl chains present in the cardiolipin molecule (Fig. 5). For example, product ion analysis of the doubly charged cardiolipin molecular ion at m/z 724.6 in the lipid extracts of mouse cardiolipin yielded two fragment ions corresponding to linoleate (m/z 279.2) and oleate (m/z 281.2) (Fig. 5A, inset) in a ratio of 3:1 after deisotoping, indicating that the cardiolipin molecular species is 18:1-18:2-18:2-18:2 CL. A doubly charged cardiolipin molecular ion at m/z 725.5 in the same solution yielded two fragments in a ratio of ~1:1 corresponding to linoleate (m/z 279.2) and oleate (m/z 281.2) in the product ion analysis (Fig. 5B, inset), indicating that the cardiolipin molecular species is 18:1-18:1-18:2-18:2 CL. Similarly, the product ion mass spectrum of m/z 736.6 (18:2-18:2-18:2-20:3 CL) in the negative ion ESI-MS analysis of lipid extracts of mouse myocardium demonstrated a ratio of ~3:1 of fragment ions at m/z 279.2 and 305.3 (Fig. 5C). Additional product ion analyses of doubly charged cardiolipin molecular species from other biological samples also support this conclusion. It should be noted that as a result of a secondary fragmentation of some fatty acyl carboxylates (e.g., an alkene ion at m/z 283.3 can result from a 22:6 ion), the apparent ion peak intensity ratio of fatty acyl carboxylates arising from a cardiolipin species might be different from the ratio of fatty acyl chain numbers in the species, but this difference does not affect the quantitation of low-abundance and/or overlapping cardiolipin molecular species, based on the peak intensity of linoleate.
It should be pointed out that these results do not contradict a conclusion from a careful study by Hsu et al. (26) (i.e., the fragment intensities of the fatty acyl chains in cardiolipin molecular species depend on the regiospecific position of each fatty acyl chain). In that study, the acyl chain fragment intensities were dependent on the acyl chain regiospecificity if singly charged cardiolipin ions were examined. In the case of doubly charged cardiolipin ions, a smaller effect was present. In our study, naturally occurring cardiolipins were examined in which multiple regioisomers are likely present at the selected isobaric cardiolipin ion peak, which may result in an apparently even smaller effect. The potential existing cardiolipin regioisomers may only be resolved using a specific chiral column, chiral surface, or chiral reagent gas. In addition, the differences in peak intensities between the acyl chain fragment ions are dependent on the collision energy used and the physical properties of acyl chains. Thus, using a proper collision energy or sequence of differential energies, the differences between the peak intensity ratio of acyl chains and the ratio of the numbers of the identical acyl chains present in a cardiolipin molecular species can be minimized.
We applied this technique for the identification and quantitation of cardiolipin molecular species in the lipid extracts of mouse heart, liver, and muscle (Tables 1–3). Figure 4 shows a two-dimensional mass spectrum from the analysis of cardiolipin molecular species in the lipid extracts of mouse heart. Each of the broken lines shows an example of an analysis of the molecular ion peak corresponding to the cardiolipin molecular species [i.e., the molecular ion crossing with the glycerophosphate (m/z 153.1), ketene building blocks, linoleate (m/z 279.2), and other fatty acyl carboxylates, by which only cardiolipin molecular species can be built]. We identified and quantitated >30 cardiolipin molecular species directly from lipid extracts of mouse heart by this technique (Table 1). Intriguingly, a triacyl lysocardiolipin molecular species corresponding to 18:2-18:1-22:6 was identified in this mass range (see the left-most broken line in Fig. 4). Other triacyl lysocardiolipin molecular species of less than m/z 600 were also identified (spectra not shown). The cardiolipin mass levels of mouse heart determined in this study were relatively higher than those of our recent study, in which the overlapping cardiolipin molecular species were not reported (13). Similarly, cardiolipin molecular species in lipid extracts of mouse liver and skeletal muscle were also identified and quantitated (Tables 2, 3, respectively).
TABLE 1.
Mass content of cardiolipin molecular species in lipid extracts of mouse heart
| [M-2H]2− | Major Species | Mass Content (Low) | Mass Content (High) |
|---|---|---|---|
| 710.465 | 18:2-18:2-18:2-16:1 | 0.22 ± 0.02 | 0.21 ± 0.04 |
| 711.476 | 18:2-18:2-18:1-16:1
18:2-18:2-18:2-16:0 |
0.09 ± 0.01 | 0.14 ± 0.05 |
| 712.484 | 18:2-18:1-18:1-16:1
18:2-18:2-18:1-16:0 |
0.06 ± 0.02 | 0.08 ± 0.02 |
| 713.492 | 18:2-18:1-18:1-16:0 | 0.05 ± 0.02 | |
| 722.472 | 18:2/18:2/18:2/18:3 | 0.12 ± 0.01 | |
| 723.483 | 18:2-18:2-18:2-18:2 | 5.93 ± 0.32 | 5.46 ± 0.28 |
| 724.488 | 18:2-18:2-18:2-18:1 | 2.04 ± 0.20 | 2.26 ± 0.20 |
| 725.493 | 18:2-18:2-18:1-18:1 | 0.24 ± 0.04 | 0.40 ± 0.04 |
| 726.499 | 18:1-18:1-18:1-18:2 | 0.04 ± 0.02 | 0.08 ± 0.04 |
| 727.510 | 18:1-18:1-18:1-18:1 | 0.05 ± 0.01 | 0.03 ± 0.01 |
| 734.474 | 22:6-18:2-18:2-16:1 | 0.07 ± 0.03 | 0.09 ± 0.03 |
| 735.480 | 20:4-18:2-18:2-18:2
22:6-18:2-18:1-16:1 20:4-20:3-18:2-16:1 20:4-20:4-18:2-16:0 22:6-18:2-18:2-16:0 |
0.19 ± 0.02 | 0.17 ± 0.04 |
| 736.490 | 20:3-18:2-18:2-18:2 | 0.80 ± 0.04 | 0.58 ± 0.08 |
| 737.496 | 20:2-18:2-18:2-18:2 | 0.58 ± 0.05 | 0.50 ± 0.09 |
| 738.498 | 20:2-18:2-18:2-18:1 | 0.29 ± 0.06 | 0.26 ± 0.07 |
| 739.503 | 20:1-18:2-18:2-18:1 | 0.05 ± 0.01 | 0.06 ± 0.02 |
| 740.491 | 20:1-18:2-18:1-18:1 | 0.04 ± 0.03 | 0.02 ± 0.00 |
| 747.520 | 22:6-18:2-18:2-18:2 | 2.53 ± 0.26 | 2.43 ± 0.17 |
| 748.493 | 22:6-18:2-18:2-18:1 | 0.15 ± 0.02 | 0.74 ± 0.04 |
| 749.499 | 22:6-18:2-18:1:18:1
22:5-18:2-18:2-18:1 20:4-20:4-18:1-18:1 20:4-20:3-18:2-18:2 20:3-20:3-18:2-18:2 |
0.12 ± 0.01 | 0.13 ± 0.02 |
| 750.502 | 20:4-20:2-18:2-18:2 | 0.04 ± 0.01 | |
| 751.514 | 20:4-20:1-18:2-18:2 | 0.02 ± 0.01 | |
| 758.510 | 22:6-20:4-18:3-18:2 | 0.02 ± 0.00 | |
| 759.486 | 18:2-18:2-20:4-22:6
18:2-20:4-20:4-20:4 |
0.08 ± 0.02 | 0.04 ± 0.01 |
| 760.493 | 22:6-20:3-18:2-18:2 | 0.18 ± 0.02 | 0.17 ± 0.04 |
| 761.499 | 22:6-20:3-18:2-18:1
22:6-20:2-18:2-18:2 |
0.11 ± 0.01 | 0.15 ± 0.05 |
| 771.482 | 22:6-22:6-18:2-18:2 | 0.42 ± 0.09 | 0.34 ± 0.05 |
| Total | 14.26 ± 0.65 | 14.58 ± 1.31 | |
| Mass and composition of linoleate | 46.87 ± 2.51 (82.2) | 46.25 ± 3.45 (79.3) |
Mouse myocardial lipids were extracted by a modified Bligh and Dyer procedure (21). The cardiolipin molecular species in the lipid extracts were identified using two-dimensional MS analyses, or by searching for m+1 isotopomers of doubly charged cardiolipin ions followed by two-dimensional MS analyses, or by searching for m+1 isotopomers of doubly charged cardiolipin ions followed by product ion analyses of these m+1 isotopomers when a triple-quadrupole (QqQ) instrument with low or high mass resolution or a QqTOF mass spectrometer was used. The data listed under Mass Content (Low) were quantitated using a two-step quantitation process with a QqQ instrument with a low mass resolution. The data listed under Mass Content (High) are the averaged results of those quantitated with a QqQ instrument using a high mass resolution setting using equation 1 in combination with the two-step quantitation process and those quantitated with a QqTOF mass spectrometer using equation 1 only. The results are expressed in nmol/mg protein and represent means ± SD of four different animals. Data in parentheses represent the percentage of linoleate in the cardiolipin pool. The molecular mass values listed in the left column were obtained with the QqTOF mass spectrometer. The ion peaks of cardiolipin molecular species that constitute <0.01 nmol/mg protein, as determined with the QqTOF mass spectrometer, were omitted.
TABLE 3.
Mass content of cardiolipin molecular species in lipid extracts of mouse skeletal muscle
| [M-2H]2− | Major Species | Mass Content (Low) | Mass Content (High) |
|---|---|---|---|
| 697.471 | 18:2-18:2-16:1-16:1 | 0.02 ± 0.01 | |
| 698.486 | 18:2-18:2-16:1-16:0
18:2-18:1-16:1-16:1 |
0.04 ± 0.02 | |
| 699.491 | 18:2-18:1-16:1-16:0
18:1-18:1-16:1-16:1 18:2-18:2-16:0-16:0 |
0.02 ± 0.01 | |
| 700.493 | 18:1-18:1-16:1-16:0
18:2-18:1-16:0-16:0 |
0.02 ± 0.00 | |
| 710.448 | 18:2-18:2-18:2-16:1 | 0.08 ± 0.03 | 0.06 ± 0.01 |
| 711.471 | 18:2-18:2-18:2-16:0
18:2-18:2-18:1-16:1 |
0.08 ± 0.03 | 0.08 ± 0.02 |
| 712.485 | 18:2-18:2-18:1-16:0
18:2-18:1-18:1-16:1 |
0.04 ± 0.03 | 0.08 ± 0.03 |
| 713.495 | 18:2-18:1-18:1-16:0 | 0.04 ± 0.01 | |
| 714.502 | 18:1-18:1-18:1-16:0 | 0.02 ± 0.00 | |
| 715.508 | 20:4-20:4-16:1-16:1 | 0.03 ± 0.01 | |
| 722.488 | 20:4-18:2-18:2-16:1
18:3-18:2-18:2-18:2 20:4-20:4-16:1-16:0 |
0.02 ± 0.01 | |
| 723.483 | 18:2-18:2-18:2-18:2 | 0.35 ± 0.13 | 0.27 ± 0.02 |
| 724.487 | 18:2-18:2-18:2-18:1 | 0.33 ± 0.06 | 0.25 ± 0.02 |
| 725.493 | 18:2-18:2-18:1-18:1 | 0.19 ± 0.09 | 0.14 ± 0.03 |
| 726.512 | 18:2-18:1-18:1-18:1 | 0.03 ± 0.01 | |
| 727.522 | 18:2-18:1-18:1-18:0 | 0.01 ± 0.01 | |
| 734.480 | 22:6-18:2-18:2-16:1 | 0.05 ± 0.02 | 0.06 ± 0.02 |
| 735.479 | 22:6-18:2-18:2-16:0
22:6-18:2-18:1-16:1 20:4-18:2-18:2-18:2 |
0.03 ± 0.01 | 0.06 ± 0.02 |
| 736.488 | 20:4-18:2-18:2-18:1
20:3-18:2-18:2-18:2 |
0.05 ± 0.02 | 0.06 ± 0.01 |
| 737.496 | 20:2-18:2-18:2-18:2 | 0.05 ± 0.02 | 0.05 ± 0.02 |
| 738.504 | 20:1-18:2-18:2-18:2
20:2-18:2-18:2-18:1 |
0.05 ± 0.03 | 0.06 ± 0.03 |
| 739.506 | 20:1-18:2-18:2-18:1
20:2-18:2-18:1-18:1 |
0.01 ± 0.00 | |
| 747.512 | 22:6-18:2-18:2-18:2 | 0.16 ± 0.07 | 0.14 ± 0.02 |
| 748.502 | 22:6-18:2-18:2-18:1 | 0.06 ± 0.02 | 0.10 ± 0.00 |
| 750.517 | 22:6-18:2-18:1-18:0 | 0.02 ± 0.00 | |
| 760.504 | 22:6-20:3-18:2-18:2 | 0.01 ± 0.00 | |
| 761.499 | 22:6-20:2-18:2-18:2
22:6-20:3-18:2-18:1 |
0.04 ± 0.02 | |
| Total | 1.58 ± 0.28 | 1.73 ± 0.22 | |
| Mass and composition of linoleate | 4.31 ± 0.25 (68.3) | 4.46 ± 0.18 (64.5) |
The lipids of mouse skeletal muscle were extracted by a modified Bligh and Dyer procedure (21), as described in Materials and Methods. The cardiolipin molecular species in the lipid extracts were identified using two-dimensional MS analyses, or by searching for m+1 isotopomers of doubly charged cardiolipin ions followed by two-dimensional MS analyses, or by searching for m+1 isotopomers of doubly charged cardiolipin ions followed by product ion analyses of these m+1 isotopomers when a QqQ instrument with low or high mass resolution or a QqTOF mass spectrometer was used. The data listed under Mass Content (Low) were quantitated using a two-step quantitation process with a QqQ instrument with a low mass resolution. The data listed under Mass Content (High) are the averaged results of those quantitated with a QqQ instrument using a high mass resolution setting using equation 1 in combination with the two-step quantitation process and those quantitated with a QqTOF mass spectrometer using equation 1 only. The results are expressed in nmol/mg protein and represent means ± SD of four different animals. Data in parentheses represent the percentage of linoleate in the cardiolipin pool. The molecular mass values listed in the left column were obtained with the QqTOF mass spectrometer. The ion peaks of cardiolipin molecular species that constitute <0.01 nmol/mg protein, as determined with the QqTOF mass spectrometer, were omitted.
TABLE 2.
Mass content of cardiolipin molecular species in lipid extracts of mouse liver
| [M-2H]2− | Major Species | Mass Content (Low) | Mass Content (High) |
|---|---|---|---|
| 697.470 | 18:2-18:2-16:1-16:1 | 0.02 ± 0.00 | |
| 698.458 | 18:2-18:2-16:1-16:0 | 0.02 ± 0.00 | |
| 699.480 | 18:2-18:1-16:1-16:0 | 0.02 ± 0.00 | |
| 700.479 | 18:2-18:1-16:0-16:0 | 0.04 ± 0.01 | |
| 710.465 | 18:2-18:2-18:2-16:1 | 0.32 ± 0.03 | 0.31 ± 0.02 |
| 711.474 | 18:2-18:2-18:2-16:0
18:2-18:2-18:1-16:1 |
0.07 ± 0.01 | 0.18 ± 0.05 |
| 712.485 | 18:2-18:1-18:1-16:1
18:2-18:2-18:1-16:0 |
0.11 ± 0.02 | 0.06 ± 0.02 |
| 713.497 | 18:2-18:1-18:1-16:0 | 0.06 ± 0.02 | |
| 722.482 | 18:2-18:2-18:2-18:3 | 0.12 ± 0.01 | |
| 723.485 | 18:2-18:2-18:2-18:2 | 2.92 ± 0.23 | 2.48 ± 0.11 |
| 724.489 | 18:2-18:2-18:2-18:1 | 1.06 ± 0.06 | 1.14 ± 0.07 |
| 725.494 | 18:2-18:2-18:1-18:1 | 0.29 ± 0.03 | 0.33 ± 0.05 |
| 726.500 | 18:2-18:2-18:1-18:0
18:2-18:1-18:1-18:1 |
0.04 ± 0.02 | |
| 734.465 | 20:4-20:4-18:2-16:1 | 0.03 ± 0.00 | 0.02 ± 0.01 |
| 735.475 | 20:4-18:2-18:2-18:2 | 0.08 ± 0.01 | 0.06 ± 0.01 |
| 736.492 | 20:3-18:2-18:2-18:2 | 0.20 ± 0.02 | 0.19 ± 0.02 |
| 737.500 | 20:2-18:2-18:2-18:2 | 0.15 ± 0.01 | 0.23 ± 0.04 |
| 738.509 | 20:1-18:2-18:2-18:2
20:2-18:2-18:2-18:1 |
0.09 ± 0.01 | 0.12 ± 0.00 |
| 739.510 | 20:1-18:2-18:2-18:1 | 0.09 ± 0.01 | 0.03 ± 0.01 |
| 747.511 | 22:6-18:2-18:2-18:2 | 0.08 ± 0.01 | 0.06 ± 0.00 |
| 748.513 | 22:5-18:2-18:2-18:2 | 0.04 ± 0.00 | 0.05 ± 0.01 |
| Total | 5.53 ± 0.38 | 5.58 ± 0.31 | |
| Mass and composition of linoleate | 18.42 ± 0.42 (83.3) | 18.26 ± 1.01 (81.8) |
Mouse hepatic lipids were extracted by a modified Bligh and Dyer procedure (21). The cardiolipin molecular species in the lipid extracts were identified using two-dimensional MS analyses, or by searching for m+1 isotopomers of doubly charged cardiolipin ions followed by two-dimensional MS analyses, or by searching for m+1 isotopomers of doubly charged cardiolipin ions followed by product ion analyses of these m+1 isotopomers when a QqQ instrument with low or high mass resolution or a QqTOF mass spectrometer was used. The data listed under Mass Content (Low) were quantitated using a two-step quantitation process with a QqQ instrument with a low mass resolution. The data listed under Mass Content (High) are the averaged results of those quantitated with a QqQ instrument using a high mass resolution setting using equation 1 in combination with the two-step quantitation process and those quantitated with a QqTOF mass spectrometer using equation 1 only. The results are expressed in nmol/mg protein and represent means ± SD of four different animals. Data in parentheses represent the percentage of linoleate in the cardiolipin pool. The molecular mass values listed in the left column were obtained with the QqTOF mass spectrometer. The ion peaks of cardiolipin molecular species that constitute <0.01 nmol/mg protein, as determined with the QqTOF mass spectrometer, were omitted.
It should be pointed out that, although it is helpful to use precursor ion scanning of linoleate as a tool for the quantitation of low-abundance and/or overlapping cardiolipin molecular species in the second quantitation step because of its high sensitivity, this analysis is not specific for cardiolipin molecular species, and the peak resolution in precursor ion scanning is relatively low compared with that in molecular ion analysis. It is also true that linoleate is not present in every very low-abundance cardiolipin molecular species. In addition, the sensitivity of neutral loss scanning of ketenes is lower than that of precursor ion scanning of linoleate. These issues are only important in the identification and quantitation of very low-abundance cardiolipin molecular species. However, further improvement in identifying these very low-abundance cardiolipin molecular species using a QqQ-type instrument can be achieved by increasing instrument sensitivity, increasing instrument mass resolution (see below), and/or increasing the sensitivity and specificity of the building blocks of cardiolipin, which might be achieved after derivatization similar to the analyses of ethanolamine glycerophospholipid, as described previously (27).
Shotgun lipidomics of cardiolipin of lipid extracts from biological samples with a QqQ mass spectrometer using a high mass resolution setting
Some of the QqQ mass spectrometers could possess much higher mass resolving power than that described above. For example, baseline-resolved doubly charged ion peaks were obtained in the analysis of equimolar mixtures of T14:0 CL and T18:1 CL when a mass resolution setting of peak width 0.3 Th was used for the identical QqQ mass spectrometer that was used in the experiments described above (Fig. 6A, insets). Therefore, the strategy for the identification and quantitation of cardiolipin molecular species needs to be modified somewhat from the technique that was used with the low mass resolution setting.
Fig. 6.
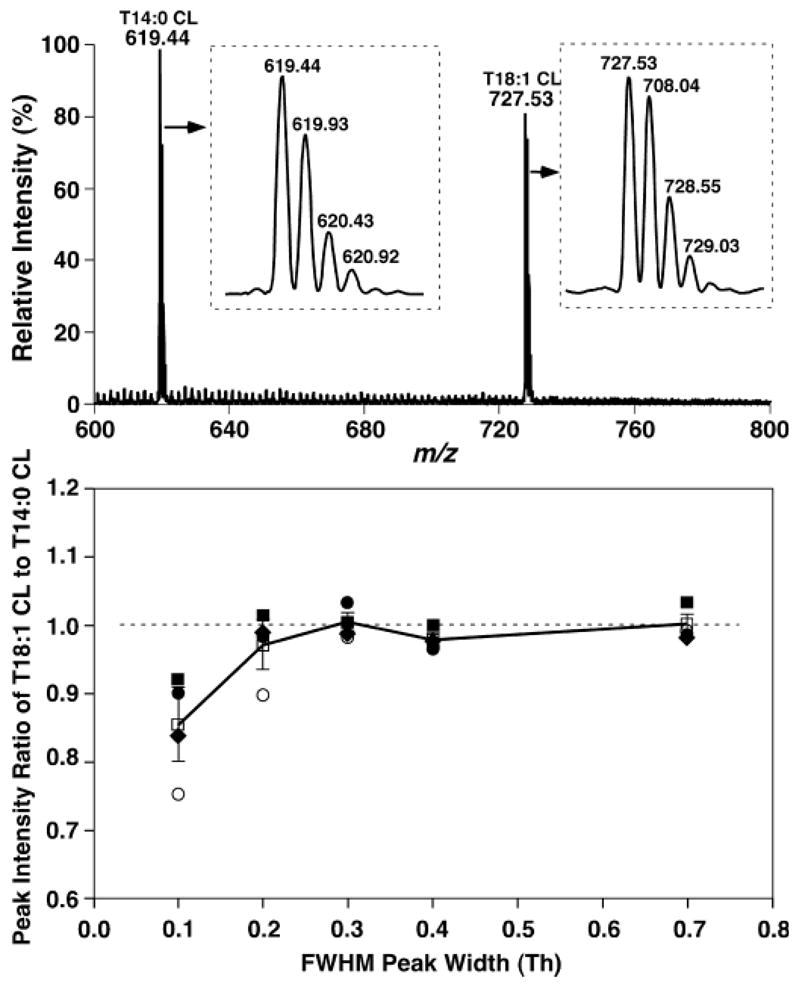
ESI-MS analyses of equimolar mixtures of cardiolipin molecular species at different mass resolutions and different concentrations. Preparation of equimolar mixtures of T14:0 CL and T18:1 CL at selected concentrations and negative ion ESI-MS analyses of these equimolar mixtures in the negative ion mode by direct infusion were performed as described in the legend to Fig. 1 except that the setting of the mass resolution was varied. A: ESI mass spectrum of the equimolar mixture of T14:0 CL and T18:1 CL (0.1 pmol/μl each) with a mass resolution setting of peak width 0.3 Th. Insets show the expanded spectra of doubly charged T14:0 CL and T18:1 CL ions. B: Peak intensity ratios of T14:0 CL and T18:1 CL equimolar mixtures at different concentrations and different mass resolution settings. The concentration of each CL molecular species in the equimolar mixture at each mass resolution setting was varied from 0.01 (closed circles) to 0.1 (closed squares) to 1 (closed diamonds) to 10 (open circles) pmol/μl. The data represent means (open squares) ± SD from the different concentrations with each mass resolution setting. FWHM, full width at half-maximum height.
First, we examined the effects of mass resolution settings on cardiolipin quantitation by ratiometric comparisons. Examination of the peak intensity ratios of equimolar mixtures of T14:0 CL and T18:1 CL at four different concentrations in a 1,000-fold dynamic range demonstrated that mass resolution settings did not affect the ratiometric comparison (i.e., quantitation) after 13C isotoping in quite broad mass resolution settings (i.e., peak width of >0.2 Th; Fig. 6B). However, when mass resolution settings of <0.2 Th (i.e., at a high mass resolution) were used, a lower intensity of the CL molecular species having greater molecular mass was determined (Fig. 6B). The higher the mass resolution used, the larger the deviation of the determined concentration ratio from the prepared concentration ratio (Fig. 6B). This likely results from the increased peak broadening as mass-to-charge ratio increases. Therefore, at a high mass resolution (e.g., a setting of peak width 0.1 Th), the loss of a peak area is not equal but is proportional to the mass-to-charge ratio.
Second, as the settings of a mass resolution become smaller (i.e., the mass detection window becomes smaller), ion signals apparently become lower. We found ion currents of ion peak intensities were reduced at least 2-fold from the setting of peak width 0.7 Th to 0.2 Th. Therefore, to balance the mass resolution, quantitation accuracy, and ion signals, we used a setting of 0.3 Th for all mass spectrometric analyses of cardiolipin molecular species and settings of 0.4 Th at both Q1 and Q3 for all tandem mass spectrometric analyses during the study.
Close examination of negative ion mass spectrometric analyses of lipid extracts of mouse myocardium using a QqQ mass spectrometer with a mass resolution setting of 0.3 Th (Fig. 7) demonstrated many doubly charged molecular ions corresponding to cardiolipin molecular species (Fig. 7, inset). As is well known, doubly charged molecular ions of other lipid classes are rarely present in the m/z region of 600 and 800. Thus, the presence of the isotopomer peaks (i.e., [M-2H+1]2− or [M-2H+3]2−, whereas the [M-2H+2]2− ion peak may be overlapped with molecular ions in other lipid classes) of doubly charged cardiolipin molecular species is very unique in lipid analysis and can be easily recognized, even though the doubly charged cardiolipin molecular ion may be overlapped with molecular ions of other lipid classes.
Fig. 7.
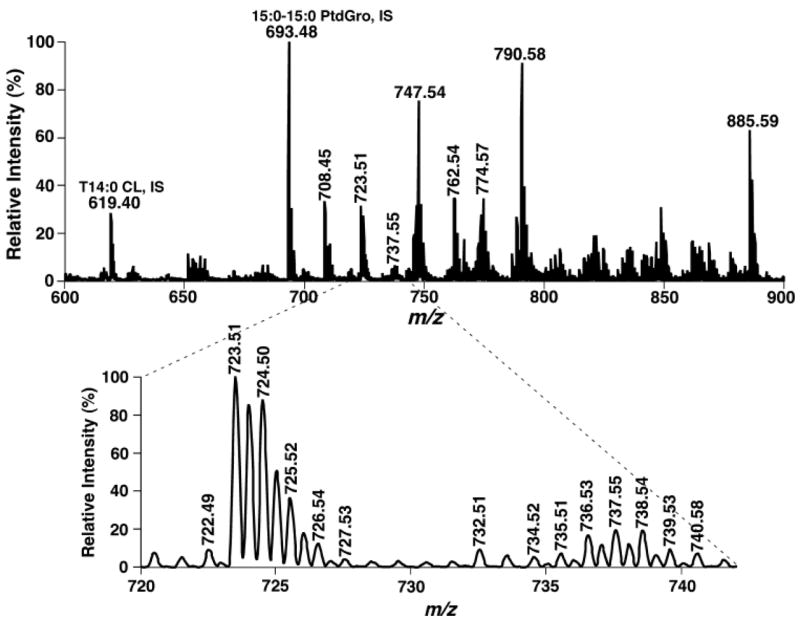
Negative ion ESI-MS analysis of a lipid extract of mouse myocardium with a QqQ ESI mass spectrometer at a high mass resolution setting. The identical diluted lipid extract of mouse myocardium that was used for Fig. 4 was analyzed in the negative ion mode using a QqQ instrument at a mass resolution setting of peak width 0.3 Th. The expanded mass spectrum at bottom clearly shows the presence of many baseline-resolved doubly charged ions corresponding to cardiolipin molecular species. IS, internal standard. PtdGro, phosphatidylglycerol.
Therefore, this unique characteristic of doubly charged cardiolipin molecular ions was used to search for cardiolipin molecular species in shotgun lipidomics of cardiolipin when sufficient mass resolution of an instrument was present (e.g., a QqQ-type instrument with a high mass resolution setting or other high-resolution mass spectrometers; see below). By searching the plus-one isotopomer peaks of doubly charged cardiolipin ions, we found at least 26, 21, and 27 (isobaric) doubly charged ion peaks from shotgun lipidomics of cardiolipin molecular species in the lipid extracts of mouse heart, liver, and skeletal muscle, respectively (Fig. 7, Tables 1–3).
Two-dimensional mass spectrometric analyses that were performed similarly to those of low mass resolution (i.e., Fig. 4) show very well-resolved doubly charged fragment ions in each of the building block analyses of cardiolipin molecular species. Figure 8 shows the mass spectra of two typical building blocks of cardiolipin molecular species in two-dimensional MS analyses: neutral loss of a ketene (neutral loss 131.1, representing C18:2 ketene) from doubly charged cardiolipin molecular species to yield doubly charged triacyl monolysocardiolipin (Fig. 8A, inset), and precursor ion monitoring of linoleate (m/z 279.2) (Fig. 8B, inset). Therefore, two-dimensional MS analyses (spectra not shown) efficiently and clearly identified the isobaric molecular species of doubly charged cardiolipin ions. The presence of so many cardiolipin molecular species in biological extracts was unanticipated. Recognition and quantitation of the multiplicity of these molecular species were quite difficult previously but can be readily achieved by shotgun lipidomics using a high mass resolution instrument.
Fig. 8.
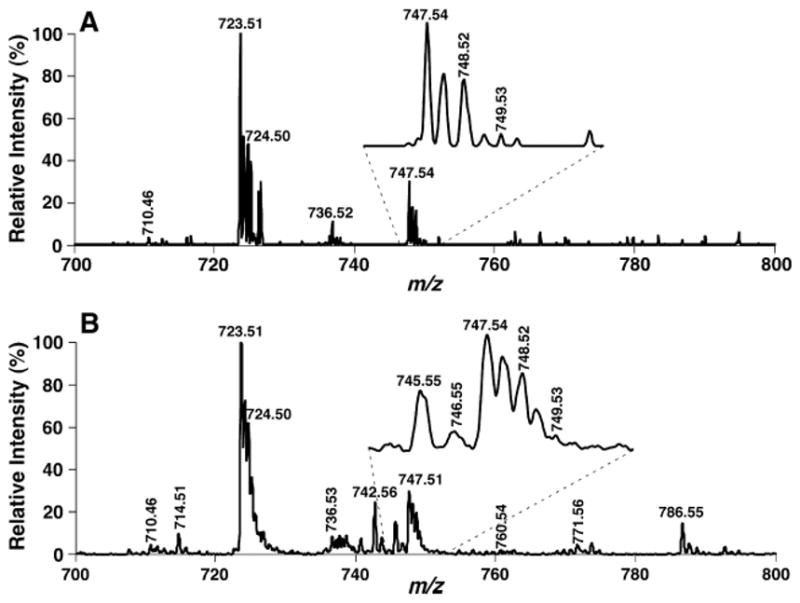
Representative building block analyses of cardiolipin molecular species in a lipid extract of mouse myocardium by two-dimensional mass spectrometry with a high mass resolution. Two-dimensional mass spectrometric analyses of cardiolipin molecular species in a diluted lipid extract of mouse myocardium identical to that used in Fig. 4 were performed as described in the legend to Fig. 4 except that a mass resolution setting of peak width 0.4 Th was used to replace the setting of 0.7 Th used for Fig. 4. A neutral loss scanning of C18:2 ketene (neutral loss 131.1) from doubly charged cardiolipin ions (A) and a precursor ion scanning of linoleate at m/z 279.2 (B) of a diluted lipid extract of mouse myocardium display highly resolved ion peaks (see insets).
Once the cardiolipin molecular ion is recognized by searching the m+1 isotopomer peak of doubly charged ions and identified by two-dimensional MS analyses, quantitation can be readily performed by ratiometric comparison of the deisotoped ion peak intensity of the cardiolipin molecular species (which can be calculated from the peak intensity of the m+1 isotopomer) with the deisotoped intensity of the preselected internal standard for cardiolipin quantitation. The calculation of the deisotoped intensity from the intensity of the m+1 isotopomer peak can be made as follows:
where Itotal is the deisotoped ion intensity of an individual cardiolipin molecular species of interest, I1 is the peak intensity of its m+1 isotopomer, and n is the total carbon number in the species. The quantitative results of cardiolipin molecular species in the lipid extracts of various mouse organs using a QqQ mass spectrometer with high mass resolution were tabulated (Tables 1–3).
It should be specifically noted that baseline noise inherited in the QqQ instrument could introduce a quite large error into the quantitation of low-abundance cardiolipin molecular species using equation 1. To minimize this type of artifact, the second step in the quantitation processing of shotgun lipidomics, the use of precursor ion scanning of linoleate, as discussed previously, should also be used. Furthermore, the additional cardiolipin molecular species identified and quantitated through the use of a high mass resolution setting from a QqQ instrument account for <5 mol% of the total cardiolipin mass in the samples (Tables 1–3). Finally, during a search of the doubly charged cardiolipin molecular species of mouse myocardial lipid extracts, the presence of multiple doubly charged ion peaks present in the region around or less than m/z 600 was also found. Two-dimensional mass spectrometric analyses demonstrated that these molecular ions corresponded to triacyl monolysocardiolipin molecular species (spectra not shown).
Shotgun lipidomics of cardiolipin molecular species of lipid extracts from biological samples with a QqTOF mass spectrometer
Next, we used a high mass resolution hybrid pulsed instrument (i.e., QqTOF) to identify and quantitate cardiolipin molecular species. In this type of instrument, the first quadrupole (i.e., Q) was used for ion transmission or ion filtering, whereas the second quadrupole (i.e., q) was used as either an ion-trapping device or a collision cell in MS or product ion analyses, respectively. Mass spectrometric analyses of cardiolipin using the QqTOF mass spectrometer demonstrated a much lower background noise level (reduction in chemical noise) and a much higher resolving power (Fig. 9A, inset) compared with the QqQ-type instrument, even with a high mass resolution setting, as shown in Fig. 6.
Fig. 9.
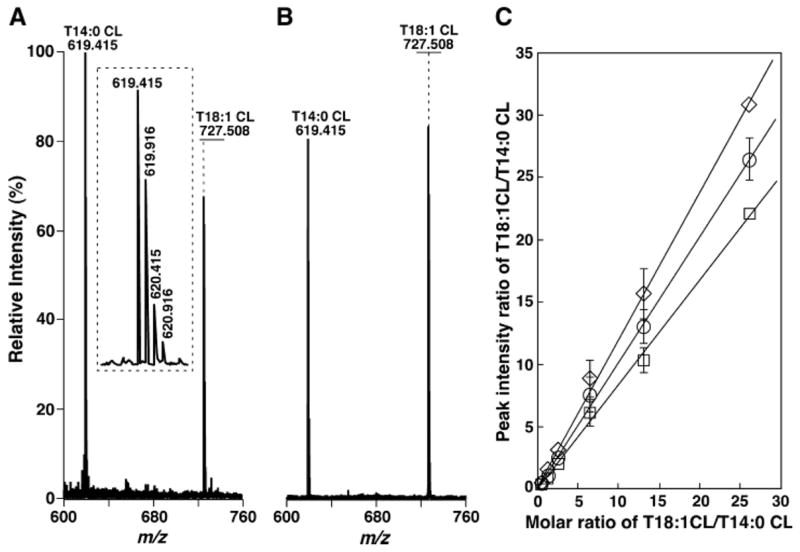
Quantitative analyses of cardiolipin mixtures with different molar ratios and at various concentrations with a QqTOF-type ESI mass spectrometer. Preparation of T18:1 CL and T14:0 CL mixtures with different molar ratios and at various concentrations and ESI-MS analyses of these mixtures in the negative ion mode after direct infusion are described in Materials and Methods. A: Negative ion ESI mass spectrum of an equimolar mixture of T18:1 CL and T14:0 CL at 100 fmol/μl, each acquired with an ion-transmission setting of 580. B: Negative ion ESI mass spectrum of the equimolar mixture used in A acquired with an ion-transmission setting of 772. C: Linear correlation of molar ratios versus the ion peak intensity ratio of T18:1 CL and T14:0 CL at different concentrations and various molar ratios. Open squares, open diamonds, and open circles represent data obtained from mass spectrometric analyses with ion-transmission settings of 580/100%, 772/50%, and 580(50%)/772(100%), respectively. Data represent means ± SD from analyses of multiple mixtures of T18:1 CL and T14:0 CL with different concentrations at the indicated molar ratios.
However, unlike the QqQ-type mass spectrometer, the peak intensity ratios of the equimolar mixture of T18:1 CL and T14:0 CL in the mass spectrum acquired with a QqTOF mass spectrometer were dependent on the set point of the maximal ion transmission through the Q. Appropriate stitching of the Q is necessary for quantitation. For example, when a setting value (i.e., 580/100%) was used for the analysis of the equimolar mixture of T18:1 CL and T14:0 CL in the m/z range 600–1,000 at different concentrations, a peak intensity ratio of 0.82 ± 0.05 of T18:1 CL to T14:0 CL molecular ions after deisotoping was obtained (Fig. 9A). In contrast, when a weighted setting value (i.e., 772/100%) was used to analyze the same set of samples, a peak intensity ratio of 1.24 ± 0.05 was obtained (Fig. 9B). Importantly, with stitching using aggregates from multiple settings of both values, a peak intensity ratio of 1.02 ± 0.05 was manifest.
Quantitative analyses of T14:0 CL and T18:1 CL mixtures at different molar ratios and different concentrations were performed with selected settings, as described for a QqQ-type instrument. Linear correlation analyses of the results demonstrated three sets of quite different data corresponding to the three setting values [i.e., slopes of 0.837, 1.18, and 1.01, with correlation coefficient factors of 0.998, 0.993, and 0.997, from the setting values of 580/100%, 772/100%, and 580(50%)/772(50%), respectively] (Fig. 9C). These results underscore the importance of appropriate stitching in the quantitative analyses of individual cardiolipin molecular species by ratiometric comparison using a QqTOF-type instrument. Although validation of this conclusion for the quantitative analysis of lipid classes other than cardiolipin is beyond the scope of this study, these results demonstrate that appropriate attention should be focused on setting points and transmission levels for other lipids using a quadrupole for pulsed ion transmission.
Because the isotopomer peaks of doubly charged cardiolipin molecular species are more precisely resolved using a QqTOF hybrid mass spectrometer than a QqQ instrument with a high mass resolution (compare insets in Figs. 6, 9A), searching these unique doubly charged cardiolipin molecular ions in negative ion mass spectrometric analysis of lipid extracts of biological samples can be readily performed (Fig. 10, insets) in shotgun lipidomics of cardiolipin molecular species. Through product ion analyses of the plus-one isotopomer peaks, the identities of cardiolipin molecular species and the possible presence of isobaric cardiolipin molecular species can be identified. Figure 11 shows an example of product ion analyses from each cluster of mouse heart cardiolipin molecular species in a two-dimensional mass spectrometric format in which only the region containing the building blocks of cardiolipin molecular species is shown. This pseudo-two-dimensional mass spectrum (Fig. 11) is comparable to the two-dimensional MS array analyses with a QqQ-type instrument (Fig. 4) but is only targeted for cardiolipin molecular species. In the former case, the building blocks of lipid molecular species (the horizontal broken lines in Fig. 11) are apparent, whereas in the latter case, a product ion spectrum (each of the vertical broken lines in Fig. 4) can be readily reconstituted from the crossing peaks of building blocks with each individual molecular ion. It should be pointed out that because the quadrupole is involved in product ion analysis using a QqTOF instrument, the high mass resolution is lost and the presence of some fragments from neighboring ion peak(s) in a product ion spectrum is possible as a result of ion leakage with the use of a QqTOF mass spectrometer.
Fig. 10.
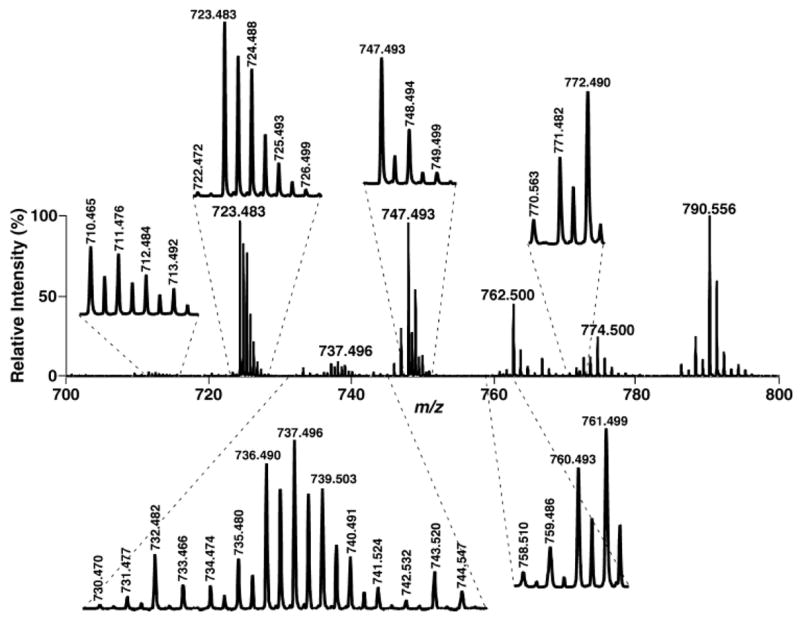
Negative ion ESI-MS analysis of cardiolipin molecular species in lipid extracts of mouse myocardium with a QqTOF-type mass spectrometer. Diluted lipid extracts of mouse myocardium identical to those used for Fig. 4 were analyzed in the negative ion mode with a QqTOF instrument, as described in Materials and Methods. Different regions of the mass spectrum are expanded to clearly show the presence of doubly charged ions.
Fig. 11.
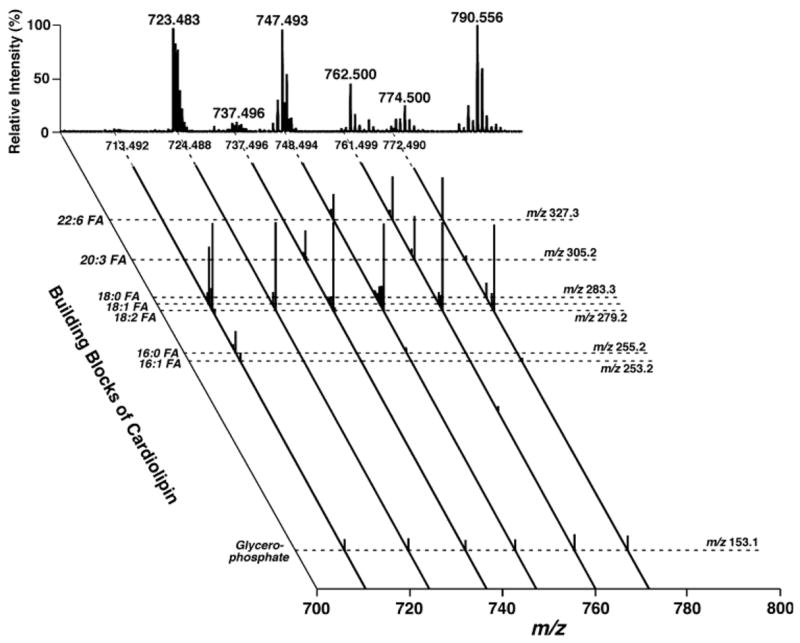
Representative product ion analyses of cardiolipin molecular species in lipid extracts of mouse myocardium with a QqTOF-type mass spectrometer in a two-dimensional format. Diluted lipid extracts of mouse myocardium identical to those used for Fig. 4 were analyzed. Each product ion ESI mass spectrum was acquired by selecting an ion of interest in the quadrupole and analyzing the fragments in the TOF while collision activation was performed in the second quadrupole. Only the mass region between m/z 100 and 350 from each product ion mass spectrum of cardiolipin molecular species is shown. All product ion mass spectra were displayed after normalization to the most intense peak (i.e., base peak) in each individual trace.
Once the cardiolipin molecular ion is identified through the product ion analysis of the m+1 isotopomer peak, quantitation can be readily performed by ratiometric comparison of the deisotoped ion peak intensity (or peak area) of the cardiolipin molecular species (which can be calculated from the peak intensity of the m+1 isotopomer using equation 1) with the deisotoped intensity of the preselected internal standard for cardiolipin quantitation. Of course, as discussed previously, the mass spectrum has to be acquired with stitching using aggregates from multiple settings of at least two values of maximal ion-transferring points for quantitation purposes. Because the background noise in a mass spectrum acquired with a QqTOF mass spectrometer is much lower than that acquired with a QqQ-type instrument, the contribution of background noise to the quantitative results of lower abundance ions is minimal. The quantitative results of cardiolipin molecular species in the lipid extracts of various mouse organs using the QqTOF mass spectrometer were essentially identical to those obtained with a QqQ-type instrument with a high mass resolution setting (Tables 1–3) within experimental errors.
During searching of the doubly charged cardiolipin molecular species of mouse myocardial lipid extracts, it was found that multiple doubly charged ion peaks at m/z 730.470, 731.477, and 732.482 correspond to the cardiolipin molecular species containing an oxidized C18:2 fatty acyl chain, based on accurate mass calculation (Fig. 10, inset) and product ion analysis (Fig. 12). The total mass content of these species was estimated by comparison with the internal standard of cardiolipin (i.e., T14:0 CL) as 0.05 nmol/mg protein, which was 0.3 mol% of the total mass content of mouse myocardial cardiolipin molecular species. These results further demonstrate the power of shotgun lipidomics of cardiolipin using a QqTOF mass spectrometer (which possesses high mass resolution and mass accuracy) in broad and diverse areas of biological and biomedical studies investigating the roles of cardiolipin in physiological function and disease states.
Fig. 12.
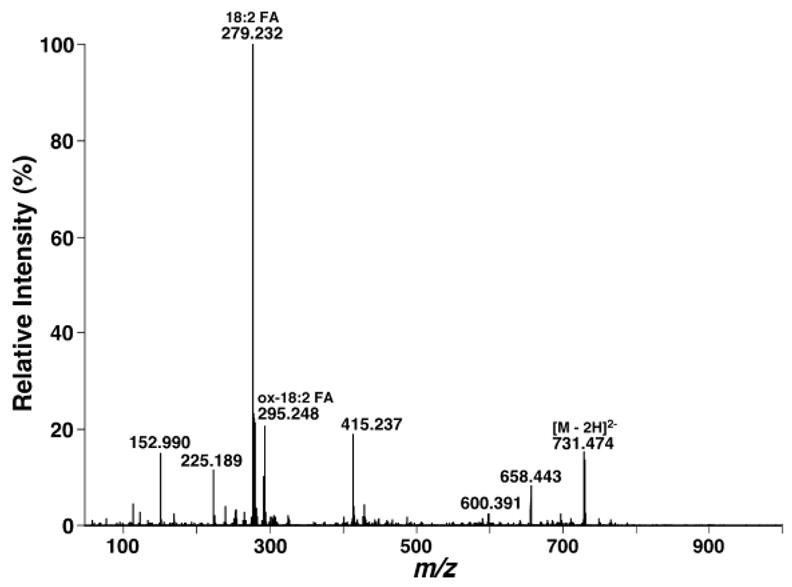
Product ion analysis of oxidized cardiolipin molecular species in lipid extracts of mouse myocardium with a QqTOF-type mass spectrometer in the negative ion mode. Product ion analysis of m/z 731.477 was performed as described in the legend to Fig. 11. The ion peak at m/z 295.248 indicates the presence of an oxidized fatty acyl chain of C18:2 in the cardiolipin molecular species.
In summary, in this study, we extended our shotgun lipidomics technology to accurately analyze a multitude of individual cardiolipin molecular species directly from lipid extracts of biological samples. Alternative strategies, each using a shotgun lipidomics approach, using either a QqQ-type mass spectrometer (either low or high mass resolution) with neutral loss scanning or a high mass resolution QqTOF mass spectrometer with product ion analyses are possible. The key elements of these techniques were established to exploit unique chemical identifiers of cardiolipin molecular species, such as the enrichment of linoleate, the specificity of building blocks (doubly charged triacyl monolysocardiolipins resulting from the neutral loss of ketenes from doubly charged cardiolipin molecular ions), and the presence of two phosphates in each molecular species. The quantitation accuracy (i.e., ~5%) and the low-end sensitivity in a linear dynamic range analysis (i.e., 10 fmol/μl) on both types of instruments were demonstrated using mixtures of synthetic cardiolipin molecular species. The effects of a large amount of other coexisting lipids (i.e., commonly but incorrectly called ion suppression) on accurate quantitation were also examined, and no influence of “ion suppression” on the quantitation of targeted molecular species was found using shotgun lipidomics under appropriate experimental conditions. Collectively, these results identified efficient and accurate techniques providing alternative tools for the quantitation of individual cardiolipin molecular species in biological extracts and represent an enabling technology for identifying the complexities of cardiolipin structure and function in biological systems.
Acknowledgments
This work was supported by National Institutes of Health Grant P01 HL-57278 and National Institute on Aging Grant R01 AG-23168.
Abbreviations
- ESI
electrospray ionization
- m
n, acyl chain containing m carbons and n double bonds
- QqQ
triple-quadrupole
- T14
0 CL, tetramyristoyl cardiolipin
References
- 1.van Klompenburg W, Nilsson I, von Heijne G, de Kruijff B. Anionic phospholipids are determinants of membrane protein topology. EMBO J. 1997;16:4261–4266. doi: 10.1093/emboj/16.14.4261. [DOI] [PMC free article] [PubMed] [Google Scholar]
- 2.Schlame M, Rua D, Greenberg ML. The biosynthesis and functional role of cardiolipin. Prog Lipid Res. 2000;39:257–288. doi: 10.1016/s0163-7827(00)00005-9. [DOI] [PubMed] [Google Scholar]
- 3.Schlame M, Ren M, Xu Y, Greenberg ML, Haller I. Molecular symmetry in mitochondrial cardiolipins. Chem Phys Lipids. 2005;138:38–49. doi: 10.1016/j.chemphyslip.2005.08.002. [DOI] [PubMed] [Google Scholar]
- 4.Sparagna GC, Johnson CA, McCune SA, Moore RL, Murphy RC. Quantitation of cardiolipin molecular species in spontaneously hypertensive heart failure rats using electrospray ionization mass spectrometry. J Lipid Res. 2005;46:1196–1204. doi: 10.1194/jlr.M500031-JLR200. [DOI] [PubMed] [Google Scholar]
- 5.McMillin JB, Dowhan W. Cardiolipin and apoptosis. Biochim Biophys Acta. 2002;1585:97–107. doi: 10.1016/s1388-1981(02)00329-3. [DOI] [PubMed] [Google Scholar]
- 6.Cristea IM, Degli Esposti M. Membrane lipids and cell death: an overview. Chem Phys Lipids. 2004;129:133–160. doi: 10.1016/j.chemphyslip.2004.02.002. [DOI] [PubMed] [Google Scholar]
- 7.Hatch GM. Cell biology of cardiac mitochondrial phospholipids. Biochem Cell Biol. 2004;82:99–112. doi: 10.1139/o03-074. [DOI] [PubMed] [Google Scholar]
- 8.Vreken P, Valianpour F, Nijtmans LG, Grivell LA, Plecko B, Wanders RJ, Barth PG. Defective remodeling of cardiolipin and phosphatidylglycerol in Barth syndrome. Biochem Biophys Res Commun. 2000;279:378–382. doi: 10.1006/bbrc.2000.3952. [DOI] [PubMed] [Google Scholar]
- 9.Schlame M, Towbin JA, Heerdt PM, Jehle R, DiMauro S, Blanck TJ. Deficiency of tetralinoleoyl-cardiolipin in Barth syndrome. Ann Neurol. 2002;51:634–637. doi: 10.1002/ana.10176. [DOI] [PubMed] [Google Scholar]
- 10.Valianpour F, Wanders RJ, Overmars H, Vreken P, Van Gennip AH, Baas F, Plecko B, Santer R, Becker K, Barth PG. Cardiolipin deficiency in X-linked cardioskeletal myopathy and neutropenia (Barth syndrome, MIM 302060): a study in cultured skin fibroblasts. J Pediatr. 2002;141:729–733. doi: 10.1067/mpd.2002.129174. [DOI] [PubMed] [Google Scholar]
- 11.Barth PG, Valianpour F, Bowen VM, Lam J, Duran M, Vaz FM, Wanders RJ. X-linked cardioskeletal myopathy and neutropenia (Barth syndrome): an update. Am J Med Genet. 2004;126:349–354. doi: 10.1002/ajmg.a.20660. [DOI] [PubMed] [Google Scholar]
- 12.Gu Z, Valianpour F, Chen S, Vaz FM, Hakkaart GA, Wanders RJ, Greenberg ML. Aberrant cardiolipin metabolism in the yeast taz1 mutant: a model for Barth syndrome. Mol Microbiol. 2004;51:149–158. doi: 10.1046/j.1365-2958.2003.03802.x. [DOI] [PubMed] [Google Scholar]
- 13.Han X, Yang J, Cheng H, Yang K, Abendschein DR, Gross RW. Shotgun lipidomics identifies cardiolipin depletion in diabetic myocardium linking altered substrate utilization with mitochondrial dysfunction. Biochemistry. 2005;44:16684–16694. doi: 10.1021/bi051908a. [DOI] [PubMed] [Google Scholar]
- 14.Teng JI, Smith LL. High-performance liquid chromatography of cardiolipin. J Chromatogr. 1985;339:35–44. doi: 10.1016/s0378-4347(00)84625-3. [DOI] [PubMed] [Google Scholar]
- 15.Valianpour F, Wanders RJ, Barth PG, Overmars H, van Gennip AH. Quantitative and compositional study of cardiolipin in platelets by electrospray ionization mass spectrometry: application for the identification of Barth syndrome patients. Clin Chem. 2002;48:1390–1397. [PubMed] [Google Scholar]
- 16.Han X, Gross RW. Global analyses of cellular lipidomes directly from crude extracts of biological samples by ESI mass spectrometry: a bridge to lipidomics. J Lipid Res. 2003;44:1071–1079. doi: 10.1194/jlr.R300004-JLR200. [DOI] [PubMed] [Google Scholar]
- 17.Han X, Yang J, Cheng H, Ye H, Gross RW. Towards fingerprinting cellular lipidomes directly from biological samples by two-dimensional electrospray ionization mass spectrometry. Anal Biochem. 2004;330:317–331. doi: 10.1016/j.ab.2004.04.004. [DOI] [PubMed] [Google Scholar]
- 18.Han X, Gross RW. Shotgun lipidomics: electrospray ionization mass spectrometric analysis and quantitation of the cellular lipidomes directly from crude extracts of biological samples. Mass Spectrom Rev. 2005;24:367–412. doi: 10.1002/mas.20023. [DOI] [PubMed] [Google Scholar]
- 19.Han X, Gross RW. Shotgun lipidomics: multi-dimensional mass spectrometric analysis of cellular lipidomes. Expert Rev Proteomics. 2005;2:253–264. doi: 10.1586/14789450.2.2.253. [DOI] [PubMed] [Google Scholar]
- 20.Gross RW. High plasmalogen and arachidonic acid content of canine myocardial sarcolemma: a fast atom bombardment mass spectroscopic and gas chromatography-mass spectroscopic characterization. Biochemistry. 1984;23:158–165. doi: 10.1021/bi00296a026. [DOI] [PubMed] [Google Scholar]
- 21.Bligh EG, Dyer WJ. A rapid method of total lipid extraction and purification. Can J Biochem Physiol. 1959;37:911–917. doi: 10.1139/o59-099. [DOI] [PubMed] [Google Scholar]
- 22.Han X, Cheng H, Mancuso DJ, Gross RW. Caloric restriction results in phospholipid depletion, membrane remodeling and triacylglycerol accumulation in murine myocardium. Biochemistry. 2004;43:15584–15594. doi: 10.1021/bi048307o. [DOI] [PubMed] [Google Scholar]
- 23.Han X, Gross RW. Structural determination of picomole amounts of phospholipids via electrospray ionization tandem mass spectrometry. J Am Soc Mass Spectrom. 1995;6:1202–1210. doi: 10.1016/1044-0305(95)00568-4. [DOI] [PubMed] [Google Scholar]
- 24.Han X, Gross RW. Quantitative analysis and molecular species fingerprinting of triacylglyceride molecular species directly from lipid extracts of biological samples by electrospray ionization tandem mass spectrometry. Anal Biochem. 2001;295:88–100. doi: 10.1006/abio.2001.5178. [DOI] [PubMed] [Google Scholar]
- 25.Han X, Yang K, Yang J, Fikes KN, Cheng H, Gross RW. Factors influencing the electrospray intrasource separation and selective ionization of glycerophospholipids. J Am Soc Mass Spectrom. 2006;17:264–274. doi: 10.1016/j.jasms.2005.11.003. [DOI] [PubMed] [Google Scholar]
- 26.Hsu FF, Turk J, Rhoades ER, Russell DG, Shi Y, Groisman EA. Structural characterization of cardiolipin by tandem quadrupole and multiple-stage quadrupole ion-trap mass spectrometry with electrospray ionization. J Am Soc Mass Spectrom. 2005;16:491–504. doi: 10.1016/j.jasms.2004.12.015. [DOI] [PubMed] [Google Scholar]
- 27.Han X, Yang K, Cheng H, Fikes KN, Gross RW. Shotgun lipidomics of phosphoethanolamine-containing lipids in biological samples after one-step in situ derivatization. J Lipid Res. 2005;46:1548–1560. doi: 10.1194/jlr.D500007-JLR200. [DOI] [PMC free article] [PubMed] [Google Scholar]


