

Abstract
Arabidopsis thaliana has emerged as a leading model species in plant genetics and functional genomics including research on the genetic causes of heterosis. We applied a triple testcross (TTC) design and a novel biometrical approach to identify and characterize quantitative trait loci (QTL) for heterosis of five biomass-related traits by (i) estimating the number, genomic positions, and genetic effects of heterotic QTL, (ii) characterizing their mode of gene action, and (iii) testing for presence of epistatic effects by a genomewide scan and marker × marker interactions. In total, 234 recombinant inbred lines (RILs) of Arabidopsis hybrid C24 × Col-0 were crossed to both parental lines and their F1 and analyzed with 110 single-nucleotide polymorphism (SNP) markers. QTL analyses were conducted using linear transformations Z1, Z2, and Z3 calculated from the adjusted entry means of TTC progenies. With Z1, we detected 12 QTL displaying augmented additive effects. With Z2, we mapped six QTL for augmented dominance effects. A one-dimensional genome scan with Z3 revealed two genomic regions with significantly negative dominance × additive epistatic effects. Two-way analyses of variance between marker pairs revealed nine digenic epistatic interactions: six reflecting dominance × dominance effects with variable sign and three reflecting additive × additive effects with positive sign. We conclude that heterosis for biomass-related traits in Arabidopsis has a polygenic basis with overdominance and/or epistasis being presumably the main types of gene action.
THE improved vigor of F1 hybrids in comparison with their parental homozygous lines, defined as heterosis (Shull 1922), is a widely exploited phenomenon in plant breeding (Schnell 1982; Duvick 1999). In general, heterosis is largest in allogamous and smallest in strictly autogamous crops. Furthermore, its relative amount usually increases with the complexity of a trait and can exceed 100% for traits such as grain yield in maize (Becker 1993).
Ever since its discovery at the beginning of the 20th century (East 1908; Shull 1908), heterosis has attracted the attention of geneticists and breeders because of its poorly understood genetic nature. The first hypotheses on the genetic causes underlying heterosis are based on dominance and overdominance gene action. Regarding the former, superiority of hybrids results from the accumulation of dominant favorable alleles from both homozygous parents (Davenport 1908; Bruce 1910; Jones 1917). In contrast, the overdominance hypothesis suggests the superiority of the heterozygous state over either homozygote (Hull 1945; Crow 1948). A third hypothesis implies that heterosis results from epistatic interactions among alleles at different loci (Powers 1944; Williams 1959).
Quantitative trait loci (QTL) mapping approaches have proven to be powerful in dissecting the genetic basis of complex traits and heterosis in crops. In a pioneer QTL study with maize, Stuber et al. (1992) detected 11 QTL for grain yield, mostly with a strong tendency toward dominance and overdominance. A reanalysis of their data set with a different biometrical model (Cockerham and Zeng 1996) led to the conclusion that heterosis in the maize hybrid B73 × Mo17 was attributable not only to dominance of favorable alleles but also to epistatic effects between linked QTL. Contradictory results were reported in studies on heterosis in rice. Findings of several authors (Xiao et al. 1995; Li et al. 2001; Luo et al. 2001) indicated that heterozygotes were superior to both parental homozygotes at most QTL, suggesting the presence of overdominance or pseudo-overdominance. In contrast, a study by Yu et al. (1997) as well as more recent investigations with an immortalized F2 population (Hua et al. 2002, 2003) showed that heterozygosity was not necessarily advantageous for trait performance in genotypes derived from a highly heterotic hybrid.
To determine the contribution of different genetic effects to midparent heterosis (MPH) of quantitative traits, Melchinger et al. (2007, accompanying article in this issue) developed a novel theory based on classical quantitative genetic approaches utilizing design III (Comstock and Robinson 1952) and the triple testcross (TTC) design (Kearsey and Jinks 1968). They developed a generalized derivation of the relative contributions of different genetic effects to MPH for multiple QTL and all types of higher-order epistasis and derived genetic expectations of heterotic QTL identified by QTL mapping. Furthermore, they devised a joint likelihood-ratio test for detecting QTL involved in heterosis.
Arabidopsis has emerged as a leading model species in plant genetics and functional genomics. It possesses considerable advantages for studies on the causes underlying heterosis such as the ease with which appropriate large mapping populations can be established, genotyped, and phenotyped. However, only few investigations on heterosis for biomass-related traits have been published up to now (Barth et al. 2003; Kearsey et al. 2003; Meyer et al. 2004; Kroymann and Mitchell-Olds 2005). In a previous study (Kusterer et al. 2007), we used a TTC design to estimate the relative contribution of dominance and epistatic effects to heterosis by biometric analyses of first- and second-degree statistics.
The goals of this study were to apply the novel approach of Melchinger et al. (2007) to detect and characterize QTL for heterosis of biomass-related traits in Arabidopsis hybrid C24 × Col-0, using the TTC design. In particular, our objectives were to (i) estimate the number, genomic positions, and genetic effects of QTL contributing to heterosis, (ii) characterize their mode of gene action, and (iii) elucidate the role of epistasis in the manifestation of heterosis.
MATERIALS AND METHODS
Plant materials, experimental design, and traits measured:
Plant materials and phenotypic data were described in detail in our previous article (Kusterer et al. 2007). Briefly, of 409 recombinant inbred lines (RILs) derived from the cross between Col-0 (parent P1) and C24 (parent P2), we studied a randomly chosen subset of 234 RILs together with their TTC progenies. Performance of testcross progenies of the nth RIL with testers P1, P2, and F1 is denoted by H1n, H2n, and H3n (n = 1, 2, … , 234), respectively. Owing to the large number of entries to be tested, the entire set of 234 RILs and their 702 TTC progenies was subdivided into three experiments, each with 78 RILs plus their corresponding TTC progenies and six checks. Each experiment was arranged in a split-plot design with three replicates. Checks and RILs with their TTC progenies were grown in different main plots. Main plots were arranged in a 12 × 7 α-design. Each main plot comprised four entries: 1 RIL and its 3 TTC progenies. The main plots of checks also comprised four entries: parents P1 and P2, as well as the F1 and F2 generations from one of the two reciprocal forms P1 × P2 and P2 × P1. In all instances, the entries within each main plot were randomly assigned to the subplots. We recorded rosette diameter (in millimeters) of individual plants 22 days after sowing (RD22) and 29 days after sowing (RD29) and calculated the absolute growth rate per day (GR) (in millimeters per day) as GR = (RD29 − RD22)/7. Biomass yield above ground (BY) (in milligrams) was recorded for the bulk of 10 plants from each subplot after drying in an oven to practically 0% moisture content. Dry matter content (DMC) (in percentage) was calculated as the ratio between dry and fresh biomass, multiplied by 100.
Molecular markers and linkage maps:
Single-nucleotide polymorphism (SNP) analyses were performed according to Törjék et al. (2003) for 110 SNP markers across the 409 RILs. A linkage map was constructed as described in detail by Törjék et al. (2006). Deviation of marker allele frequencies from 0.5 was tested with a χ2-test statistic using a sequential Bonferroni correction of P-values (Holm 1979).
Data analysis:
For each RIL, we calculated the linear transformations Z1 = (H1 + H2)/2, Z2 = H1 − H2, and Z3 = H1 + H2 − 2H3 at the main plot level. These transformations provided the basis for all further biometric and quantitative genetic analyses. The checks were not included in the analysis.
Entry means adjusted for incomplete blocks and experiments were calculated for each transformation Zs (s = 1, 2, 3) by a mixed-model analysis across experiments. Following Kearsey and Jinks (1968), presence of additive × additive epistasis at the level of the entire genome was examined by testing the average of adjusted-entry means of Z3 across RILs for deviation from zero using an appropriate χ2-test. Genotypic ( ) and error variances (
 ) as well as phenotypic and genotypic correlations between Zs and Zu (s ≠ u) were estimated by established procedures (Mode and Robinson 1959; Searle 1971) from analyses of variance and covariance of the transformed observations. In addition, heritability (h2) on an entry-mean basis was computed for each Zs from variance components as
  /(
/( ), where r corresponds to the number of replicates. Significance of variance components estimated by restricted maximum likelihood (REML) was tested by Wald statistics. This test is approximate and asymptotically equivalent to a likelihood-ratio test (Rao 1973). The Wald statistic was compared with a chi-square distribution with 1 d.f. and the P-value was halved to account for the fact that the null hypothesis places the parameter on the boundary of the parameter space (Stram and Lee 1994). All computations were performed with SAS PROC MIXED (Sas Institute 2004).
QTL analyses:
QTL analyses were carried out by using adjusted entry means of Z1, Z2, Z3, and H3 of each RIL as well as their SNP data and the linkage map. Composite-interval mapping (CIM) (Jansen and Stam 1994; Zeng 1994) was used for the detection, mapping, and characterization of QTL. For all Zs as well as H3, a genetic model fitting only one genetic effect (corresponding to the additive effect in conventional QTL mapping) was chosen for QTL mapping, as described by Utz et al. (2000), because the SNP marker data referred to RILs. LOD threshold levels for QTL detection were determined by a permutation test (Churchill and Doerge 1994) using 2000 permutations. For Zs and H3 of each trait, the LOD threshold ranged between 1.7 and 1.9 for an experimentwise error rate of 30%. Therefore, a LOD threshold value of 1.8 was used to declare presence of a QTL for every Zs and H3. Estimates of QTL positions and effects for Zs as well as H3 were obtained at the position where the corresponding LOD score reached a global maximum in the region under consideration. In addition, genetic effects of QTL for the other transformations Zu (u ≠ s) were determined at the position of Zs to obtain estimates of the augmented dominance ratio (ratio of augmented dominance effect di* to augmented additive effect ai* estimated by Z2 and Z1, respectively, see below for definitions) and also potential QTL × genetic background interactions revealed by Z3 (Table 1). The proportion of the genotypic variance explained (p) was determined according to the procedure described by Utz et al. (2000) from the ratio  , where h2 is the heritability and
  is the adjusted partial correlation coefficient of a putative QTL or the multiple correlation coefficient of a set of QTL in the simultaneous fit. It must be noted that partial R2 values for the detected QTL do not add up to the R2 of the multiple-QTL model due to linkage disequilibrium between markers and corresponding multicollinearity of the regression problem.
TABLE 1.
Expectation (ɛ(X)), variance ( (X)), and conditional expectation (ɛ(X | QTL i)) of the contrast between the two homozygous marker classes at the position of QTL i and conditional expectation (ɛ(X | QTL i × QTL j)) of the interaction between the two homozygous marker classes at the positions i and j for X = Z1, Z2, Z3, and H3 in terms of genetic effects of the F2-metric under digenic epistasis in the absence of linkage
| Statistica
|
|||||||
|---|---|---|---|---|---|---|---|
| Variable X | ɛ(X) |  |
ɛ(X | QTL i) | ɛ(X | QTL i × QTL j) | |||
| Z1 |
|
|
|
aaij + ddij | |||
| Z2 |
|
|
|
adij + daij | |||
| Z3 |
|
|
|
2ddij | |||
| H3 | μ |
|
ai | aaij | |||

For description of Z1, Z2, Z3, and H3 and for notation of genetic effects see materials and methods.
Summation is over the entire set of QTL involved in the trait expression.
In addition to one-dimensional genome scans for epistasis with Z3, we also tested Z3 and H3 for presence of digenic epistatic effects by two-way analyses of variance between all pairs of marker loci. As a modification of the procedure described by Holland (1998), in this search for significant marker pairs we included the same set of markers as cofactors as used in CIM for QTL mapping of main effects, to eliminate their influence on the detection of epistatic QTL. Marker pairs were selected on the basis of the Bayesian information criterion (BIC) (Piepho and Gauch 2001), if the BIC value for the model with epistasis was at least 2 units below the BIC value for the model without epistasis, following Raftery (1995). Finally, all selected epistatic marker pairs as well as the positions of QTL from CIM for a given trait and Z3 or H3 were subjected to a further step of backward elimination in multiple regression based on the BIC. For those marker × marker interactions remaining in the final model, epistatic effects were estimated simultaneously with the QTL main effects.
In addition to separate QTL scans for each transformation Zs, we followed for each trait the method of Jiang and Zeng (1995) to conduct a joint mapping for all three transformations Zs, as proposed by Melchinger et al. (2007) for QTL mapping with design III. Using the permutation test (Churchill and Doerge 1994), we obtained the following LOD threshold values (corresponding to an experimentwise error rate of 30%) to declare presence of a QTL in the joint analysis: 3.1 for RD22, RD29, and GR; 3.3 for DMC; and 3.4 for BY.
All QTL computations were performed with the software package PLABQTL (Utz and Melchinger 1996), with an extension for calculation of the BIC according to the method of Burnham and Anderson (2004) to accommodate selection of cofactors and comparison of the models with and without digenic epistatic interactions.
Quantitative genetic expectations:
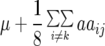
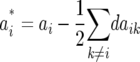
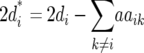
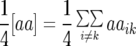
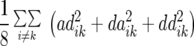
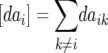
Melchinger et al. (2007) provided general formulas for first- and second-degree statistics as well as QTL parameters for the transformations Zs under the F2-metric model with arbitrary linkage and digenic epistasis. Quantitative genetic expectations of the statistics most relevant to our further analyses, ignoring linkage, are given in Table 1, using the following notation: ai and di denote the additive and the dominance effect at QTL i, respectively; and aaij, adij, daij, and ddij denote the additive × additive, additive × dominance, dominance × additive, and dominance × dominance epistatic effects between loci i and j, respectively. QTL detected by genome scans with Z1 reflect augmented additive effects ai* = ai −  [dai] that, apart from the additive effect ai, also include [dai], i.e., the sum of dominance × additive effects of QTL i with all other QTL in the genetic background. QTL detected with Z2 capture augmented dominance effects di* = di −
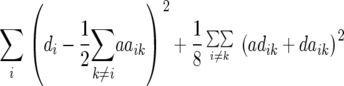
  [aai], which include the dominance effect di and [aai], i.e., the sum of additive × additive effects of QTL i with all other QTL in the genetic background. Finally, QTL mapping with Z3 provides a one-dimensional genome scan for QTL × genetic background interactions of type dominance × additive [dai]. Interactions between marker pairs linked to QTL i and j depend for Z3 only on dominance × dominance effects (ddij) and for H3 only on additive × additive effects (aaij) (Table 1). In contrast, different types of epistatic effects are confounded in interactions between marker pairs for Z1 and Z2 and, hence, the latter were not considered in our study.
RESULTS
Linkage map construction:
The SNP assays of the 409 RILs yielded an almost complete data set with <0.1% missing data points. The complete linkage map with 110 markers covered all five Arabidopsis chromosomes uniformly and spanned in total 425.7 cM, with an average interval length of 3.9 cM between markers (Figure 1). The maximum distance between markers was 13 cM. Altogether, the total length of our map was within the range of other crosses with Arabidopsis (Loudet et al. 2002; Malmberg et al. 2005). Allele frequencies on one chromosomal region of chromosomes 1, 4, and 5, as well as on two chromosomal regions of chromosome 3 deviated significantly (P < 0.05) from Mendelian expectations. On chromosomes 1, 3 (position 3/52–3/57), and 5, there were excesses of Col-0 alleles of 10, 20, and 10% over genomic regions of 8, 5, and 11 cM, respectively. On chromosomes 3 (position 3/0–3/2) and 4, predomination of C24 alleles reached ∼10 and 20% over genomic regions of 2 and 5 cM, respectively. A detailed description of the segregation distortion was given by Törjék et al. (2006). Heterozygosity across the 110 SNP markers in each RIL averaged 1.8%, with a maximum of 8.2%.
Figure 1.—

Genomic locations and proportion (p) of the genetic variance ( (Zs)) explained by QTL detected for linear transformations Z1, Z2, Z3 for five biomass-related traits in Arabidopsis hybrid C24 × Col-0. For description of linear transformations and traits see materials and methods.
Trait means, variances, and heritability:
Means, genetic variances, and heritabilities of the original observations H1, H2, and H3 for the TTC progenies were presented in our previous article (Kusterer et al. 2007). Means and genetic variances for the transformation Z1 were significantly (P < 0.01) greater than zero for all traits (Table 2). Heritability of Z1 ranged between 59% for DMC and 80% for RD29. For Z2, the mean deviated significantly (P < 0.01) from zero for all traits except RD22. Estimates of  (Z2) were always highly significant (P < 0.01) and almost twice as large as
  (Z1) for RD22 and BY. Heritability of Z2 ranged between 45% for GR and 78% for RD22 and BY. For Z3, the mean deviated significantly (P < 0.05) from zero only for RD29. Estimates of
  (Z3) were highly significant (P < 0.01) for all traits and approximately twice the corresponding values of
  (Z2) for RD22, RD29, and BY. For GR and DMC, estimates of
  (Zs) were of similar size for Z1, Z2, and Z3. Estimates of
  (Zs) differed for Z1, Z2, and Z3, because (i) Z1 refers to the mean of H1 and H2, whereas Z2 and Z3 refer to contrasts of H1, H2 and H3, and (ii) the error of main plots contributes to
  (Z1) but cancels in the model equation of Z2 and Z3. Heritability of Z3 ranged from 30% for GR and DMC to 81% for BY. Genotypic correlations between Z1 and Z2 were mostly close to zero, as expected from theory (Melchinger et al. 2007) and the small differences between parents C24 and Col-0 in comparison with the range between RILs for per se performance of all traits reported in our previous study (Kusterer et al. 2007). By comparison, moderately positive correlations were observed between Z1 and Z3.
TABLE 2.
Summary statistics (mean, genotypic variance  , error variance
  , heritability h2, phenotypic correlation rp, genotypic correlation rg) with associated standard errors for linear transformations Z1, Z2, and Z3 of five biomass-related traits in Arabidopsis hybrid C24 × Col-0
| Linear transformation | Trait
|
|||||
|---|---|---|---|---|---|---|
| Statistic | RD22 (mm) | RD29 (mm) | GR (mm/day) | DMC (%) | BY (mg) | |
| Z1 | Mean | 30.3 ± 0.3** | 77.5 ± 0.5** | 6.78 ± 0.04** | 7.79 ± 0.03** | 98.6 ± 1.6** |
 |
34.1 ± 4.2** | 99.0 ± 11.9** | 0.42 ± 0.07** | 0.24 ± 0.04** | 776.3 ± 109.8** | |
 |
27.1 ± 1.8** | 75.0 ± 5.2** | 0.71 ± 0.05** | 0.49 ± 0.03** | 1084.4 ± 72.6** | |
| h2 | 79.1 ± 2.5 | 79.8 ± 2.4 | 64.00 ± 4.37 | 59.10 ± 5.06 | 68.2 ± 3.7 | |
| Z2 | Mean | 0.7 ± 0.4 | 2.5 ± 0.7** | 0.26 ± 0.06** | 0.57 ± 0.04** | 9.6 ± 2.0** |
 |
51.2 ± 6.3** | 124.2 ± 17.5** | 0.46 ± 0.11** | 0.25 ± 0.06** | 1513.5 ± 186.0** | |
 |
44.6 ± 3.0** | 163.6 ± 11.4** | 1.73 ± 0.12** | 0.73 ± 0.05** | 1296.7 ± 87.0** | |
| h2 | 77.5 ± 2.6 | 69.5 ± 3.6 | 44.56 ± 6.83 | 50.36 ± 6.69 | 77.8 ± 2.6 | |
| Z3 | Mean | −1.0 ± 0.6 | −2.0 ± 1.0* | −0.13 ± 0.09 | −0.05 ± 0.05 | 1.4 ± 3.3 |
 |
124.6 ± 15.8** | 211.9 ± 33.6** | 0.61 ± 0.23** | 0.25 ± 0.09** | 4421.2 ± 523.1** | |
 |
119.5 ± 8.0** | 370.7 ± 26.0** | 4.18 ± 0.29** | 1.72 ± 0.12** | 3058.7 ± 206.8** | |
| h2 | 75.8 ± 2.8 | 63.2 ± 4.4 | 30.60 ± 8.60 | 29.77 ± 8.78 | 81.3 ± 2.2 | |
| rp (Z1, Z2) | −0.02 | 0.11 | 0.16* | −0.04 | −0.09 | |
| rp (Z1, Z3) | 0.37** | 0.30** | 0.23** | 0.16* | 0.41** | |
| rp (Z2, Z3) | −0.05 | 0.03 | −0.07 | 0.01** | −0.15* | |
| rg (Z1, Z2) | −0.04 | 0.11* | 0.24** | 0.09 | −0.12* | |
| rg (Z1, Z3) | 0.38** | 0.27** | 0.13 | 0.24* | 0.42** | |
| rg (Z2, Z3) | −0.06 | 0.00 | −0.21* | −0.05 | −0.14* | |
Phenotypic correlation was significant at *P < 0.05 and **P < 0.01, respectively, and the genotypic correlation exceeded twice and three times its standard error, respectively. For description of the linear transformations and traits see materials and methods.
Identification of QTL affecting biomass-related traits:
We detected a total of 20 QTL for the five biomass-related traits in Arabidopsis hybrid C24 × Col-0 (Table 3 and Figure 1). Several of these QTL regions affected more than one trait. However, each QTL position was declared significant only for one of the three transformations Zs, on the basis of the LOD thresholds determined by permutation tests. In the joint QTL analysis of all three transformations, 7 of the 20 QTL detected in the separate analyses of Z1, Z2, or Z3 were also found, but no additional QTL could be detected.
TABLE 3.
QTL positions and effects for linear transformations Z1, Z2, and Z3 as well as dominance ratio di*/|ai*| and joint mapping of five biomass-related traits in Arabidopsis hybrid C24 × Col-0
|
Z1
|
Z2
|
Z3
|
||||||||||
|---|---|---|---|---|---|---|---|---|---|---|---|---|
| Chromosome | Position (cM)a | LOD scoreb | Effect ai* | p (%)c | LOD score | Effect 2di* | p (%) | di*/|ai*| | LOD score | Effect [dai] | p (%) | Joint LOD scored |
| RD22 (mm) | ||||||||||||
| 3 | 6 | 1.85 | −2.03** | 3.9 | 0.23 | −0.55 | 0.5 | −0.13 | 0.02 | 0.18 | 0.0 | 2.08 |
| 4 | 24 | 3.10 | 2.87** | 6.3 | 0.03 | 0.17 | 0.0 | 0.03 | 0.24 | −0.78 | 0.4 | 4.24 |
| 5 | 14 | 1.87 | 2.14** | 4.2 | 0.08 | −0.19 | 0.1 | −0.04 | 0.78 | 1.43 | 1.4 | 2.87 |
| Total | 12.6 | 0.6 | 1.8 | |||||||||
| RD29 (mm) | ||||||||||||
| 1 | 52 | 0.38 | −3.13 | 1.2 | 0.00 | −0.46 | 0.1 | −0.07 | 2.11 | −3.92** | 5.4 | 2.30 |
| 1 | 70 | 0.02 | 2.04 | 0.5 | 2.12 | 3.20** | 5.8 | 0.78 | 0.01 | 0.33 | 0.0 | 2.17 |
| 2 | 58 | 2.02 | −5.89** | 4.9 | 0.28 | 0.99 | 0.7 | 0.08 | 0.32 | 1.50 | 0.9 | 2.85 |
| 4 | 20 | 2.10 | 5.92** | 5.3 | 0.34 | 1.13 | 1.0 | 0.09 | 0.00 | 0.19 | 0.0 | 2.53 |
| 5 | 60 | 0.54 | −2.28 | 0.7 | 1.82 | 2.55** | 4.6 | 0.56 | 0.01 | 0.43 | 0.0 | 2.23 |
| Total | 10.4 | 12.5 | 7.1 | |||||||||
| GR (mm/day) | ||||||||||||
| 1 | 70 | 0.0 | −0.03 | 0.0 | 3.95 | 0.31** | 15.3 | 5.17 | 0.03 | 0.00 | 0.0 | 3.99 |
| 2 | 50 | 2.02 | −0.31** | 5.0 | 0.12 | 0.14 | 3.6 | 0.22 | 0.02 | 0.04 | 0.0 | 0.40 |
| 3 | 6 | 2.23 | −0.34** | 6.4 | 0.01 | −0.01 | 0.0 | −0.01 | 0.06 | −0.13 | 0.3 | 0.22 |
| 5 | 60 | 0.10 | −0.04 | 0.0 | 2.38 | 0.26** | 11.4 | 3.25 | 0.00 | 0.06 | 0.0 | 2.46 |
| Total | 10.5 | 28.0 | 0.6 | |||||||||
| DMC (%) | ||||||||||||
| 2 | 60 | 4.59 | 0.29** | 6.6 | 0.23 | 0.13 | 1.1 | 0.22 | 0.51 | −0.02 | 0.0 | 5.79 |
| 2 | 68 | 0.06 | 0.02 | 0.0 | 2.92 | −0.30** | 11.1 | −7.50 | 0.06 | 0.00 | 0.0 | 4.68 |
| 3 | 14 | 3.58 | 0.23** | 10.5 | 0.01 | −0.01 | 0.0 | −0.02 | 0.26 | 0.11 | 2.7 | 6.55 |
| 3 | 84 | 2.17 | 0.20** | 6.6 | 0.02 | −0.01 | 0.0 | −0.02 | 0.26 | 0.04 | 0.3 | 2.48 |
| 4 | 8 | 0.02 | 0.02 | 0.0 | 0.06 | 0.02 | 0.2 | 0.50 | 3.41 | −0.31** | 16.4 | 3.47 |
| Total | 31.1 | 13.7 | 20.5 | |||||||||
| BY (mg) | ||||||||||||
| 3 | 30 | 0.40 | −3.25 | 1.0 | 2.41 | 6.59* | 3.2 | 1.01 | 0.02 | 0.96 | 0.0 | 2.64 |
| 4 | 16 | 3.43 | 10.69** | 9.8 | 0.01 | −0.82 | 0.0 | −0.04 | 0.03 | 2.32 | 0.2 | 4.38 |
| 5 | 16 | 2.69 | 9.33** | 8.9 | 0.21 | −2.80 | 0.6 | −0.15 | 0.50 | 5.87 | 1.5 | 3.24 |
| Total | 17.4 | 3.6 | 1.7 | |||||||||
For description of linear transformations and traits see materials and methods.
Position on chromosome according to the map published by Törjék et al. (2006).
Estimates of QTL, for which the LOD score surpassed the threshold level, are given in italics.
Proportion of genotypic variance explained by the QTL in a simultaneous fit.
Joint mapping over all linear transformations Z1, Z2, and Z3.
For RD22, we revealed three QTL, all by QTL mapping with Z1 (Table 3). They were located on chromosomes 3, 4, and 5 and explained individually from 3.9 to 6.3% and simultaneously 12.6% of  (Z1). Effects of these QTL for Z2 and Z3 were practically zero.
For RD29, we detected five QTL (Table 3). Two of them were found for Z1, one located on chromosome 2 and the other on chromosome 4 at the same marker interval as the QTL for RD22, each explaining ∼5% of  (Z1). Two QTL were detected for Z2, one located on chromosome 1 and one on chromosome 5, explaining 6 and 5% of
  (Z2), respectively. For Z3, we found one QTL on chromosome 1, explaining ∼5% of
  (Z3).
(Z3).
For GR, we detected four QTL (Table 3). For Z1, we found two QTL, one located on chromosome 2 in the same region as the Z1 QTL for RD29 and DMC and the other on chromosome 3, explaining individually 5 and 6% of  (Z1). For Z2, two QTL, explaining 15 and 11% of
  (Z2), were detected on chromosomes 1 and 5, respectively, at exactly the same positions as Z2 QTL for RD29. In a simultaneous fit, these QTL accounted for 28% of
  (Z2).
(Z2).
For DMC, we detected five QTL (Table 3). Three of them were found for Z1, located on chromosomes 2 and 3, explaining between 7 and 11% of  . The simultaneous fit of all five QTL explained 31.1% of
  (Z1). Only one QTL was detected for Z2, located on chromosome 2 and explaining 11% of
  (Z2). Likewise, for Z3 we detected only one QTL located on chromosome 4, which accounted for 16% of
  (Z3).
(Z3).
For BY, we detected three QTL (Table 3). Two of these were found for Z1 on chromosomes 4 and 5 and explained ∼9% of  (Z1). One QTL was detected for Z2 on chromosome 3, which explained only 3.2% of
  (Z2).
(Z2).
We detected a total of six marker pairs with significant epistatic effects for Z3 across all traits (Table 4). Three of these marker pairs were found for RD22 with variable sign of the estimated effect ddij, explaining between 4.6 and 6.5% of  (Z3). Likewise, three marker pairs displaying epistatic effects ddij with variable sign were detected with Z3 for BY, explaining between 3.0 and 6.7% of
  (Z3); one of the markers involved in significant interactions was always located on the long arm of chromosome 5. For H3, we detected consistently one epistatic marker pair with a positive sign of the estimated effect aaij for RD29, GR, and DMC, explaining between 5.6 and 10.7% of
  (H3). Each of these marker pairs involved the same marker on the long arm of chromosome 5; for RD29 and GR, the other marker was also identical.
TABLE 4.
Marker positions and estimated digenic epistatic effects ddij and aaij determined by two-way analyses of variance with variables Z3 and H3 of five biomass-related traits in Arabidopsis hybrid C24 × Col-0
| Marker i
|
Marker j
|
ddij
|
|||||
|---|---|---|---|---|---|---|---|
| Trait | Chromosome | Positiona | Chromosome | Positiona | LOD score | Effect | p (%)b |
| Variable Z3 | |||||||
| RD22 | 1 | 81 | 2 | 55 | 1.96 | −2.68 | 5.06 |
| RD22 | 2 | 24 | 5 | 37 | 1.77 | 2.53 | 4.57 |
| RD22 | 4 | 24 | 5 | 14 | 2.54 | −3.30 | 6.53 |
| BY | 2 | 10 | 5 | 53 | 1.96 | 10.48 | 5.1 |
| BY | 2 | 70 | 5 | 53 | 2.57 | −12.16 | 6.7 |
| BY | 3 | 30 | 5 | 70 | 1.14 | 8.44 | 3.0 |
| Marker i
|
Marker j
|
aaij
|
|||||
| Trait | Chromosome | Positiona | Chromosome | Positiona | LOD score | Effect | p (%)b |
| Variable H3 | |||||||
| RD29 | 1 | 8 | 5 | 92 | 2.15 | 6.62 | 5.63 |
| GR | 1 | 8 | 5 | 92 | 2.56 | 0.57 | 9.1 |
| DMC | 2 | 29 | 5 | 92 | 2.30 | 0.23 | 10.7 |
For description of Z3 and H3 and traits see materials and methods.
Position on chromosome according to the map published by Törjék et al. (2006).
Proportion of genotypic variance explained by the marker pair interaction.
DISCUSSION
Composition of heterosis under epistasis:
Melchinger et al. (2007) provided a general formula for MPH under the F2-metric model. According to this formula, with digenic epistasis, MPH depends on both dominance and additive × additive effects. Moreover, the contribution of individual QTL to MPH corresponds exactly to their augmented dominance effects di*.
Usefulness of the TTC design for heterosis studies:
Hua et al. (2003) pointed out that most of the previous molecular-marker-based genetic analyses of heterosis were based on performance measurements of traits rather than on heterosis itself and that the genetic basis of heterosis was inferred from the genetic components of trait performance. To obtain a better picture of the genetic components underlying heterosis, these authors advocated the use of direct measurements of heterosis in data analysis, as provided, for example, by the immortalized F2 design. Even though design III and the TTC design do not fulfill this criterion, we believe they are ideal designs for unraveling the basis of heterosis because QTL mapping with Z2 provides estimates of augmented dominance effects di*, the contribution of a QTL to MPH. Since QTL mapping with Z1 also provides estimates of the augmented additive effect ai*, which enters the expression for the parental difference in the presence of epistasis, design III and the TTC design allow us also to determine the augmented dominance ratio di*/|ai*| at each QTL. The TTC design for QTL mapping with Z3 has a further advantage in that it permits a one-dimensional genome scan for epistatic effects [dai] contributing to ai*.
Interpretation of first- and second-degree statistics:
As pointed out by Kearsey and Jinks (1968), the transformation Z3 provides a test for [aa], the sum of aaij epistatic effects averaged over all pairs of QTL (Table 1). In our study, this test was significant only for RD29. By comparison, a generation means analysis that included the checks (P1, P2, F1, F2) and RILs in addition to the TTC progenies yielded significantly (P < 0.05) positive estimates of [aa] for BY (Kusterer et al. 2007). Compared with Z3, the latter approach has a higher statistical power to detect epistasis owing to a smaller coefficient in the error variance for the estimate of [aa].
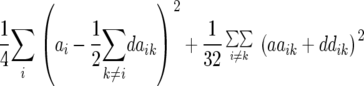
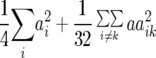
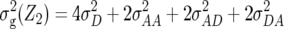
Table 1 also provides a quantitative genetic interpretation of  (Zs). Using the F2-metric, the genetic variance can be partitioned into independent components of the genetic effects with no genetic covariance among them (Kao and Zeng 2002). Thus, we obtain
 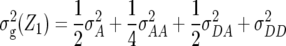 ,
,  , and
, and 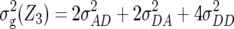 , where
  ,
,  ,
,  ,
,  ,
,  , and
, and  denote the variances of ai, di, aaij, adij, daij, and ddij effects summed over all loci or loci pairs, respectively, as defined for the F2-metric by Yang (2004). This demonstrates that in a TTC design with RILs,
  (Zs) for s = 1, 2, and 3 can be strongly influenced by epistatic effects. In particular, the significant estimates of
  (Z3) for all traits observed in our study reveal the presence of epistasis of type a × d and d × a and/or d × d or even higher-order epistasis. Estimates of
  and
and  reported in our previous study (Kusterer et al. 2007) on the analysis of variance of the original observations Hs (s = 1, 2, 3) support this conclusion.
Interpretation of QTL-mapping results:
Until recently, QTL analyses of heterosis with design III (e.g., Stuber et al. 1992) were performed with (i) marker data of the candidates (e.g., F3 lines or RILs) from a segregating population of cross P1 × P2 and (ii) phenotypic data (H1 and H2) of their testcross progenies. QTL effects determined with this approach have expectations di* + ai* and di* − ai* (Melchinger et al. 2007) and gene action at each QTL must be deduced from these estimates. By comparison, the novel QTL-mapping approach devised by Melchinger et al. (2007) also uses marker data of the candidates, but employs linear transformations Z1, Z2, and Z3 of the performance of TTC progenies. The advantages of this approach are that (i) estimates of the detected QTL reflect directly ai* and di* and (ii) the joint analysis of Z1 and Z2 enables testing of hypotheses on the type of gene action.
Across all five biomass-related traits, we detected a total of 20 QTL with main effects. This number compares favorably with the 38 QTL reported for 22 traits in a design III study of Arabidopsis hybrid Col × Ler (Kearsey et al. 2003) but is lower than that in crops like maize (Stuber et al. 1992; Cockerham and Zeng 1996) and rice (Li et al. 2001; Luo et al. 2001; Hua et al. 2002, 2003). However, the studies with maize and rice investigated grain yield and yield components. These traits display much larger MPH than forage yield in maize (Melchinger et al. 1992) or biomass-related traits in Arabidopsis, where MPH was largest for BY but still <66% except under extremely high light intensities and at an earlier time of evaluation (Meyer et al. 2004). Altogether, the number of detected QTL was at the lower end of our expectations because the conditions for QTL mapping were benign in our study. First, we used replicated experiments with a total of 30 plants per entry and heritabilities for all Zs were moderately high for all traits except GR and DMC for Z3 (Table 2). Thus, experimental errors in the phenotypic measurements most likely did not hamper QTL detection. Second, we chose a sufficiently large population size (N = 234). On the basis of theoretical results (Charcosset and Gallais 1996), the power of QTL detection with this population size is >90% for a QTL explaining 10% of  for a trait with h2 = 50%. Third, QTL mapping was performed with marker data from RILs, where the heterozygous marker class is empty. As a consequence, under a purely additive genetic model, as applies to testcross progenies, RILs have the highest power for detection of QTL in comparison with F2, F3, or backcross populations (Moreno-Gonzalez 1993; Charcosset and Gallais 1996). Fourth, we used a high-density linkage map with an average marker distance of 3.9 cM and a maximum interval length of 13 cM, which favors QTL detection and improves the resolution of separating closely linked QTL (Luo et al. 2001).
Segregation distortion observed for four genomic regions may have reduced the power of QTL detection in our study, because of unequal size of marker classes (Crane and Crane 2005). Nevertheless, according to the theoretical results of Cockerham and Zeng (1996), this effect on power of QTL detection is presumably of secondary importance with the degree of distortion observed in our RIL population. Likewise, errors in the assignment of marker genotypes of RILs to the phenotypic observations of their TTC progenies would reduce the power of QTL detection. To avoid such mistakes, we used the same seed lot of each RIL for producing the TTC progenies, as well as propagating the RILs and sampling of plant materials for the SNP assays.
Given the large number of entries evaluated in our study (N = 936), we had to subdivide the entire set of 234 RILs and their TTC progenies into three separate experiments. Even though utmost care was exercised to warrant uniform temperature, light, and moisture conditions, a perfect control of the environmental conditions across the experiments was not possible. However, an analysis of variance of the checks that were included as multiple entries in each experiment revealed only minor genotype × experiment interactions. Nevertheless, if genotype × experiment interactions affected biomass-related traits in the TTC progenies, our mapping procedure would favor the detection of those QTL that displayed no or little QTL × environment interactions. Moreover, h2 calculated from pooled values of individual experiments would tend to overestimate the heritabilities across experiments. Consequently, estimates of p given in Table 3 represent a lower limit for the proportion of  across experiments explained by the detected QTL.
Twelve of the 20 QTL were detected for Z1 with significant augmented additive effects ai* (Table 3). Eight of these 12 QTL colocalized with QTL detected for H3 (data not shown), which reflect additive effects ai without any confounding by digenic epistatic effects (Table 1). This is in agreement with the findings from our previous study (Kusterer et al. 2007) showing that  was the predominant variance component compared with
  and the epistatic variances. Three QTL were detected for DMC, which explained altogether about one-third of
  (Z1). Since DMC is related to the developmental stage, we compared the QTL detected for this trait with the 12 QTL for flowering time in Arabidopsis revealed by El-Lithy et al. (2006). Two QTL for DMC, on chromosomes 3 (position 3/14) and 4 (position 4/8), mapped to genomic regions reported for flowering time, thus suggesting that the underlying genes have a pleiotropic effect on these two traits.
Five of six QTL detected for transformation Z2 displayed a positive augmented dominance effect di*, which is in agreement with the positive MPH for the underlying traits. A QTL with negative di* effect was revealed only for DMC, as expected from the negative MPH for this trait. The two largest QTL for di*, explaining simultaneously 28% of  (Z2), were found for GR, the trait with the highest average squared degree of dominance in our previous study (Kusterer et al. 2007).
Altogether, it is difficult to conclude whether the small number of QTL detected in our study was due to the low level of heterosis for all traits except BY or a lack of statistical power in detecting QTL or a combination of both.
Comparison of individual and joint QTL mapping:
We found no common QTL positions between Z1, Z2, and Z3. This implies that the QTL detected displayed either only significant augmented additive effects ai* detected by Z1, or significant augmented dominance effects di* detected by Z2, or significant epistatic effects [dai] detected by Z3. Consequently, the dominance ratio di*/|ai*| shown in Table 3 was either close to zero or extremely high. The only exception was the QTL for BY on chromosome 3, where ai* and di* were of equal size. This result is in harmony with the findings of Cockerham and Zeng (1996) and Frascaroli et al. (2007), who reported only a small overlap between QTL for Z1 and Z2 in single-marker analyses of design III progenies of maize hybrid B73 × Mo17 and in CIM of TTC progenies of maize hybrid B73 × H99, respectively. Likewise, most QTL detected for heterosis of grain yield in rice displayed either a dominance ratio well above 1.0 or close to zero (Yu et al. 1997; Hua et al. 2002, 2003). Altogether, these findings imply that estimates of the average degree of dominance  are not very informative for drawing conclusions on the primary mode of gene action involved in heterosis at individual QTL because a mixture of QTL with additive and overdominance would result in an estimate of D that would suggest partial dominance at most QTL.
The joint QTL analysis across all three transformations Zs did not improve the power of QTL detection in our study (Table 3). In most instances, the LOD score of the joint analysis was approximately equal to the sum of the LOD scores for the individual transformations. This result is in accordance with theory (Jiang and Zeng 1995) and was expected on the basis of the low phenotypic and genotypic correlations between Z1, Z2, and Z3 (Table 2). However, since the LOD threshold was much higher for the joint mapping (corresponding to a χ2-distribution with 4 d.f. according to Jiang and Zeng 1995) than that of individual Zs (corresponding to a χ2-distribution with 2 d.f.), only 7 of the 20 QTL found with the latter approach could be confirmed by the joint analysis. Nevertheless, joint mapping was instrumental in dissecting the two closely linked QTL on chromosome 2 using the procedure described by Jiang and Zeng (1995).
Detection of epistatic QTL:
We used two approaches to detect epistasis among QTL. First, a one-dimensional genome scan was performed by QTL mapping with Z3 to detect QTL × genetic background interactions (Table 1). This test revealed two genomic regions with significantly negative [dai] effects, one for GR and one for DMC. Since ai* = ai −  [dai], it follows that the additive effect ai is smaller than the augmented additive effect ai* estimated at these positions by QTL mapping with Z1. This conclusion was confirmed by comparison with additive effects ai determined by QTL mapping with H3 (data not shown).
Second, we performed two-way ANOVAs with all marker pairs (using cofactors determined by CIM and subsequent backward elimination) for Z3 and H3. This yields statistical tests for epistatic effects of types ddij and aaij (Table 1), respectively, but because Z3 and H3 are correlated, the statistical tests for Z3 and H3 are not stochastically independent. Very few significant digenic epistatic effects were found with this approach (Table 4), presumably because of its low statistical power as a consequence of the aggravated multiple-test problem associated with two-dimensional genome scans. Interestingly, none of the markers contributing to significant aaij effects, identified with H3, colocalized with main-effect QTL detected with Z2, despite the fact that augmented dominance effects di* reflect not only di but also minus half the sum of aaik effects. Two explanations can be given for this observation: (1) positive di effects counterbalanced the effects of the detected positive aaij effects and/or (2) [aai], the sum of aaik interactions of QTL i with all other QTL k, contributing to di*, was smaller than the aaij effect estimated from H3 due to other interactions aaik (k ≠ j) with a negative sign that were too small to be detected by marker × marker contrasts with H3 in our approach. Hence, if the goal is to determine the relative contribution of epistatic vs. dominant gene action to MPH, investigating only pairwise interactions aaij is not sufficient to obtain a realistic picture of the role of epistasis in heterosis. What is needed are new designs that for each QTL allow separate estimation of di and [aai], as pointed out by Melchinger et al. (2007).
Comparison of QTL for different traits:
In agreement with the significant correlations among biomass-related traits in the TTC progenies reported in our previous study (Kusterer et al. 2007), we also found common QTL positions for different traits (Figure 1). All QTL detected for GR were found either for RD22 (one QTL) or for RD29 (three QTL) with the same type of gene action. Likewise, two QTL regions for RD22 were also identified as QTL for BY with the same type of gene action. However, with the limited sample size (N = 234) and moderate size of the detected genetic effects, confidence intervals for QTL positions were still in the order of 10–15 cM (see Manichaikul et al. 2006) in spite of our high-density map. Thus, we were not able to distinguish pleiotropic or closely linked QTL regions. Hence, fine-mapping approaches with introgression libraries or near-isogenic lines and, subsequently, comparison of DNA sequences between the parents in regions of candidate genes are required to solve this problem.
Genetic basis of heterosis:
In our previous article (Kusterer et al. 2007), MPH was highest (49%) for BY, medium (23–28%) for RD22, RD29, and GR, and negative (−2%) for DMC. By QTL mapping for augmented dominance effects di* with Z2, we detected one QTL explaining 11% of MPH for BY and two QTL explaining 18% of MPH for GR. This suggests that heterosis for BY and GR has a truly polygenic mode-of-inheritance with a large number of underlying QTL, each with only a small contribution. The small number of QTL detected in our study in comparison with similar investigations in maize (Stuber et al. 1992; Lu et al. 2003) and rice (Hua et al. 2002, 2003) is most likely attributable to the moderate level of MPH for biomass-related traits in Arabidopsis hybrid C24 × Col-0. However, our analyses allow only inferences on augmented dominance effects di* and not on dominance effects di themselves. If positive effects di were counterbalanced by positive effects aaij, as suggested by positive estimates of [aa] in our previous article (Kusterer et al. 2007) as well as positive estimates of aaij detected by marker × marker interactions for H3 (Table 4), this has resulted in smaller values for di* in comparison with di and has prevented their detection by QTL mapping with Z2. This hypothesis is supported by results from rice (Yu et al. 1997; Hua et al. 2002, 2003) showing that additive × additive epistasis is a major component of heterosis for yield and yield components in autogamous species. In the past, inferences on the primary mode of gene action at QTL involved in heterosis have been drawn from the average degree of dominance D, estimated from the ratio 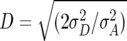 . For the materials and traits investigated in this study, Kusterer et al. (2007) reported D values between 0.54 and 0.74, close to the ratio
  . Following the arguments of previous studies (Comstock and Robinson 1952; Moll and Robinson 1967), one would conclude that most QTL contributing to heterosis display partial to complete dominance. However, our results on the augmented dominance ratio di*/|ai*| suggest that the majority of QTL display either additive gene action or overdominance, but owing to the limited power of QTL detection in our study and lack of a statistical test for testing |ai*| = di*, further research is warranted to substantiate this conclusion. Nevertheless, our results demonstrate that considering only D can be rather misleading concerning the type of gene action at the majority of loci contributing to heterosis.
Our observation of overdominant gene action at one-quarter of the detected QTL is in harmony with recent findings in tomato (Semel et al. 2006). In a population of introgression lines, which carried defined chromosome segments of a wild relative, these authors reported prevalence of overdominant QTL for fitness-related traits. Likewise, most QTL detected for heterosis of grain yield in the maize hybrid B73 × H99 were in the overdominance range (Frascaroli et al. 2007). Nevertheless, pseudo-overdominance of closely linked loci with dominant genes in repulsion phase could be an alternative explanation. This hypothesis would also be consistent with DNA sequence comparisons of maize inbred lines, which differed in their gene content in a given genomic region as a result of transposon-induced gene shuffling (Fu and Dooner 2002). If the different sets of genes in each parent complement each other in their action, this would result in pseudo-overdominance. The Arabidopsis hybrid C24 × Col-0 represents an ideal model system to study this hypothesis, because the DNA sequence of Col-0 is completely known (Lin et al. 1999; Mayer et al. 1999; Salanoubat et al. 2000; Tabata et al. 2000; Theologis et al. 2000) and very detailed knowledge of C24 vs. Col-0 polymorphisms will soon become available from resequencing by hybridization (Clark et al. 2007). Furthermore, introgression libraries of Col-0 genome segments in C24 genetic background and vice versa have been constructed (O. Törjek, R. C. Meyer, M. Zehnsdorf, M. Teltow, G. Strompen, H. Witucka-Wall, A. Blacha and T. Altmann, unpublished results), which allow mapping of heterosis to defined genomic regions, eliminating a major part of genomewide epistasis.
Acknowledgments
We thank O. Törjék for the SNP marker assays. We gratefully acknowledge the expert technical assistance of B. Devezi-Savula, N. Friedl, E. Kokai-Kota, C. Marona, M. Teltow, and M. Zeh. This project was supported by the Deutsche Forschungsgemeinschaft (German Research Foundation) under the priority research program “Heterosis in Plants” (research grants AL387/6-1, AL387/6-2, ME931/4-1, ME931/4-2, PI377/7-1, and PI377/7-2).
References
- Barth, S., A. K. Busimi, H. F. Utz and A. E. Melchinger, 2003. Heterosis for biomass yield and related traits in five hybrids of Arabidopsis thaliana L. Heynh. Heredity 91: 36–42. [DOI] [PubMed] [Google Scholar]
- Becker, H. C., 1993. Pflanzenzüchtung. Eugen Ulmer Verlag, Stuttgart, Germany.
- Bruce, A. B., 1910. The Mendelian theory of heredity and the augmentation of vigor. Science 32: 627–628. [DOI] [PubMed] [Google Scholar]
- Burnham, K. P., and D. R. Anderson, 2004. Multimodel interference: understanding AIC and BIC in model selection. Sociol. Methods Res. 33: 261–304. [Google Scholar]
- Charcosset, A., and A. Gallais, 1996. Estimation of contribution of quantitative trait loci (QTL) to the variance of a quantitative trait by means of genetic markers. Theor. Appl. Genet. 93: 1193–1201. [DOI] [PubMed] [Google Scholar]
- Churchill, G. A., and R. W. Doerge, 1994. Empirical threshold values for quantitative trait mapping. Genetics 138: 963–971. [DOI] [PMC free article] [PubMed] [Google Scholar]
- Clark, R., G. Schweikert, C. Toomajian, S. Ossowski, G. Zeller et al., 2007. Common sequence polymorphisms shaping genetic diversity in Arabidopsis thaliana. Science 317: 338–342. [DOI] [PubMed] [Google Scholar]
- Cockerham, C. C., and Z. B. Zeng, 1996. Design III with marker loci. Genetics 143: 1437–1456. [DOI] [PMC free article] [PubMed] [Google Scholar]
- Comstock, R. E., and H. F. Robinson, 1952. Estimation of average dominance of genes, pp. 494–516 in Heterosis, edited by J. W. Gowen. Iowa State College Press, Ames, IA.
- Crane, C. F., and Y. M. Crane, 2005. A nearest-neighboring-end algorithm for genetic mapping. Bioinformatics 21: 1579–1591. [DOI] [PubMed] [Google Scholar]
- Crow, J. F., 1948. Alternative hypotheses of hybrid vigor. Genetics 33: 477–487. [DOI] [PMC free article] [PubMed] [Google Scholar]
- Davenport, C. B., 1908. Degeneration, albinism and inbreeding. Science 28: 454–455. [DOI] [PubMed] [Google Scholar]
- Duvick, D. N., 1999. Heterosis: feeding people and protecting natural resources, pp. 19–29 in Genetics and Exploitation of Heterosis, edited by J. G. Coors and S. Pandey. American Society of Agronomy, Madison, WI.
- East, E. M., 1908. Inbreeding in corn. Report of the Connecticut Agricultural Experiment Station, pp. 419–428.
- El-Lithy, M., L. Bentsink, C. J. Hanhart, G. J. Ruys, D. Rovito et al., 2006. New Arabidopsis recombinant inbred populations genotyped using SNPWave and their use for mapping flowering-time quantitative trait loci. Genetics 172: 1867–1876. [DOI] [PMC free article] [PubMed] [Google Scholar]
- Frascaroli, E., M. A. Cané, P. Landi, G. Pea, L. Gianfranceschi et al., 2007. Classical genetic and quantitative trait loci analyses of heterosis in a maize hybrid between two elite inbred lines. Genetics 176: 625–644. [DOI] [PMC free article] [PubMed] [Google Scholar]
- Fu, H., and H. K. Dooner, 2002. Intraspecific violation of genetic colinearity and its implications in maize. Proc. Natl. Acad. Sci. USA 99: 9573–9578. [DOI] [PMC free article] [PubMed] [Google Scholar]
- Holland, J. B., 1998. EPISTACY: a SAS program for detecting two-locus epistatic interactions using genetic marker information. J. Hered. 89: 374–375. [Google Scholar]
- Holm, S., 1979. A simple sequentially rejective multiple test procedure. Scand. J. Stat. 6: 65–70. [Google Scholar]
- Hua, J., Y. Xing, W. Wu, C. Xu, X. Sun et al., 2002. Genetic dissection of an elite rice hybrid revealed that heterozygotes are not always advantageous for performance. Genetics 162: 1885–1895. [DOI] [PMC free article] [PubMed] [Google Scholar]
- Hua, J., Y. Xing, W. Wu, C. Xu, X. Sun et al., 2003. Single-locus heterotic effects and dominance by dominance interactions can adequately explain the genetic basis of heterosis in an elite rice hybrid. Proc. Natl. Acad. Sci. USA 100: 2574–2579. [DOI] [PMC free article] [PubMed] [Google Scholar]
- Hull, F. H., 1945. Recurrent selection for specific combining ability in corn. J. Am. Soc. Agron. 37: 134–145. [Google Scholar]
- Jansen, R. C., and P. Stam, 1994. High resolution of quantitative traits into multiple loci via interval mapping. Genetics 136: 1447–1455. [DOI] [PMC free article] [PubMed] [Google Scholar]
- Jiang, C., and Z. B. Zeng, 1995. Multiple trait analysis of genetic mapping for quantitative trait loci. Genetics 140: 1111–1127. [DOI] [PMC free article] [PubMed] [Google Scholar]
- Jones, D. F., 1917. Dominance of linked factors as a means of accounting for heterosis. Genetics 2: 466–479. [DOI] [PMC free article] [PubMed] [Google Scholar]
- Kao, C. H., and Z. B. Zeng, 2002. Modeling epistasis of quantitative trait loci using Cockerham's model. Genetics 160: 1243–1261. [DOI] [PMC free article] [PubMed] [Google Scholar]
- Kearsey, M. J., and J. L. Jinks, 1968. A general method of detecting additive, dominance and epistatic variation for metrical traits. I. Theory. Heredity 23: 403–409. [DOI] [PubMed] [Google Scholar]
- Kearsey, M. J., H. S. Pooni and N. H. Syed, 2003. Genetics of quantitative traits in Arabidopsis thaliana. Heredity 91: 456–464. [DOI] [PubMed] [Google Scholar]
- Kroymann, J., and T. Mitchell-Olds, 2005. Epistasis and balanced polymorphism influencing complex trait variation. Nature 435: 95–98. [DOI] [PubMed] [Google Scholar]
- Kusterer, B., J. Muminovic, H. F. Utz, H.-P. Piepho, S. Barth et al., 2007. Analysis of a triple testcross design with recombinant inbred lines reveals a significant role of epistasis in heterosis for biomass-related traits in Arabidopsis. Genetics 175: 2009–2017. [DOI] [PMC free article] [PubMed] [Google Scholar]
- Li, Z. K, L. J. Luo, H. W. Mei, D. L. Wang, Q. Y. Shu et al., 2001. Overdominant epistatic loci are the primary genetic basis of inbreeding depression and heterosis in rice. I. Biomass and grain yield. Genetics 158: 1737–1753. [DOI] [PMC free article] [PubMed] [Google Scholar]
- Lin, X., S. Kaul, S. Rounsley, T. P. Shea, M. I. Benito et al., 1999. Sequence and analysis of chromosome 2 of the plant Arabidopsis thaliana. Nature 402: 761–768. [DOI] [PubMed] [Google Scholar]
- Loudet, O., S. Chaillou, C. Camilleri, D. Bouchez and F. Daniel-Vedele, 2002. Bay-0 × Shahdara recombinant inbred line population: a powerful tool for the genetic dissection of complex traits in Arabidopsis. Theor. Appl. Genet. 104: 1173–1184. [DOI] [PubMed] [Google Scholar]
- Lu, H., J. Romero-Severson and R. Bernardo, 2003. Genetic basis of heterosis explored by simple sequence repeat markers in a random-mated maize population. Theor. Appl. Genet. 107: 494–502. [DOI] [PubMed] [Google Scholar]
- Luo, L. J., Z. K. Li, H. W. Mei, Q. Y. Shu, R. Tabien et al., 2001. Overdominant epistatic loci are the primary genetic basis of inbreeding depression and heterosis in rice. II. Grain yield components. Genetics 158: 1755–1771. [DOI] [PMC free article] [PubMed] [Google Scholar]
- Malmberg, R. L., S. Held, A. Waits and R. Mauricio, 2005. Epistasis for fitness-related quantitative traits in Arabidopsis thaliana grown in the field and in the greenhouse. Genetics 171: 2013–2027. [DOI] [PMC free article] [PubMed] [Google Scholar]
- Manichaikul, A., J. Dupuis, S. Sen and K. W. Broman, 2006. Poor performance of bootstrap confidence intervals for the location of quantitative trait locus. Genetics 174: 481–489. [DOI] [PMC free article] [PubMed] [Google Scholar]
- Mayer, K., C. Schüller, R. Wambutt, G. Murphy, G. Volckaert et al., 1999. Sequence and analysis of chromosome 4 of the plant Arabidopsis thaliana. Nature 402: 769–777. [DOI] [PubMed] [Google Scholar]
- Melchinger, A. E., J. Boppenmaier, B. S. Dhillon, W. G. Pollmer and R. G. Herrmann, 1992. Genetic diversity for RFLPs in European maize inbreds: II. Relation to performance of hybrids within versus between heterotic groups for forage traits. Theor. Appl. Genet. 84: 672–681. [DOI] [PubMed] [Google Scholar]
- Melchinger, A. E., H. F. Utz, H. P. Piepho, Z. B. Zeng and C. C. Schön, 2007. The role of epistasis in the manifestation of heterosis: a systems-oriented approach. Genetics 177: 1815–1825. [DOI] [PMC free article] [PubMed] [Google Scholar]
- Meyer, R. C., O. Törjék, M. Becher and T. Altmann, 2004. Heterosis of biomass production in Arabidopsis. Establishment during early development. Plant Physiol. 134: 1813–1823. [DOI] [PMC free article] [PubMed] [Google Scholar]
- Mode, C. J., and H. F. Robinson, 1959. Pleiotropism and the genetic variance and covariance. Biometrics 15: 518–537. [Google Scholar]
- Moll, R. H., and H. F. Robinson, 1967. Quantitative genetic investigations of yield of maize. Genet. Breed. Res. 37: 192–199. [Google Scholar]
- Moreno-Gonzalez, J., 1993. Efficiency of generations for estimating marker-associated QTL effects by multiple regression. Genetics 135: 223–231. [DOI] [PMC free article] [PubMed] [Google Scholar]
- Piepho, H. P., and H. G. Gauch, 2001. Marker pair selection of mapping quantitative trait loci. Genetics 157: 433–444. [DOI] [PMC free article] [PubMed] [Google Scholar]
- Powers, L., 1944. An expansion of Jones' theory for the explanation of heterosis. Am. Nat. 78: 275–280. [Google Scholar]
- Raftery, A. E., 1995. Bayesian model selection in social research, pp. 111–196 in Sociological Methodology, edited by P. V. Marsden. Blackwell, Cambridge, UK.
- Rao, C. R., 1973. Linear Statistical Interference and Its Applications. John Wiley & Sons, New York.
- Salanoubat, M., L. Lemcke, M. Rieger, W. Ansorge, M. Unseld et al., 2000. Sequence and analysis of chromosome 3 of the plant Arabidopsis thaliana. Nature 408: 820–822. [DOI] [PubMed] [Google Scholar]
- SAS Institute, 2004. SAS Version 9.1. SAS Institute, Cary, NC.
- Schnell, F. W., 1982. A synoptic study of the methods and categories of plant breeding. Z. Pflanzenzücht. 89: 1–18. [Google Scholar]
- Searle, S. R., 1971. Linear Models. Wiley & Sons, New York.
- Semel, Y., J. Nissenbaum, N. Menda, M. Zinder, U. Krieger et al., 2006. Overdominant quantitative trait loci for yield and fitness in tomato. Proc. Natl. Acad. Sci. USA 130: 12981–12986. [DOI] [PMC free article] [PubMed] [Google Scholar]
- Shull, G. H., 1908. The composition of a field of maize. Am. Breed. Assoc. Rep. 4: 296–301. [Google Scholar]
- Shull, G. H., 1922. Über die heterozygotie mit rücksicht auf den praktischen züchtungserfolg. Beitr. Pflanzenzucht. 5: 134–158. [Google Scholar]
- Stram, D. O., and J. W. Lee, 1994. Variance components testing in the longitudinal mixed effects model. Biometrics 50: 1171–1177. [PubMed] [Google Scholar]
- Stuber, C. W., S. E. Lincoln, D. W. Wolff, T. Helentjaris and E. S. Lander, 1992. Identification of genetic factors contributing to heterosis in a hybrid from two elite maize inbred lines using molecular markers. Genetics 132: 823–839. [DOI] [PMC free article] [PubMed] [Google Scholar]
- Tabata, S., T. Kaneko, Y. Nakamura, H. Kotani, T. Kato et al., 2000. Sequence and analysis of chromosome 5 of the plant Arabidopsis thaliana. Nature 408: 823–826. [DOI] [PubMed] [Google Scholar]
- Theologis, T., J. R. Ecker, C. J. Palm, N. A. Federspiel, S. Kaul et al., 2000. Sequence and analysis of chromosome 1 of the plant Arabidopsis thaliana. Nature 408: 816–820. [DOI] [PubMed] [Google Scholar]
- Törjék, O., D. Berger, R. C. Meyer, C. Müssig, K. J. Schmid et al., 2003. Establishment of a high-efficiency SNP-based framework marker set for Arabidopsis. Plant J. 36: 122–140. [DOI] [PubMed] [Google Scholar]
- Törjék, O., H. Witucka Wall, R. C. Meyer, M. von Korff, B. Kusterer et al., 2006. Segregation distortion in Arabidopsis C24/Col-0 and Col-0/C24 recombinant inbred line populations is due to reduced fertility caused by epistatic interaction of two loci. Theor. Appl. Genet. 113: 1551–1561. [DOI] [PubMed] [Google Scholar]
- Utz, H. F., and A. E. Melchinger, 1996. PLABQTL: a program for composite interval mapping of QTL. J. Agric. Genomics 2: 1–5. [Google Scholar]
- Utz, H. F., A. E. Melchinger and C. C. Schön, 2000. Bias and sampling error of the estimated proportion of genotypic variance explained by quantitative trait loci determined from experimental data in maize using cross validation and validation with independent samples. Genetics 154: 1839–1849. [PMC free article] [PubMed] [Google Scholar]
- Williams, W., 1959. Heterosis and the genetics of complex characters. Nature 184: 527–530. [DOI] [PubMed] [Google Scholar]
- Xiao, J., J. Li, L. Yuan and S. D. Tanksley, 1995. Dominance is the major genetic basis of heterosis in rice as revealed by QTL analysis using molecular markers. Genetics 140: 745–754. [DOI] [PMC free article] [PubMed] [Google Scholar]
- Yang, R. C., 2004. Epistasis of quantitative trait loci under different gene action models. Genetics 167: 1493–1505. [DOI] [PMC free article] [PubMed] [Google Scholar]
- Yu, S. B., J. X. Li, C. G. Xu, Y. F. Tan, Y. J. Gao et al., 1997. Importance of epistasis as the genetic basis of heterosis in an elite rice hybrid. Proc. Natl. Acad. Sci. USA 94: 9226–9231. [DOI] [PMC free article] [PubMed] [Google Scholar]
- Zeng, Z. B., 1994. Precision mapping of quantitative trait loci. Genetics 136: 1457–1468. [DOI] [PMC free article] [PubMed] [Google Scholar]