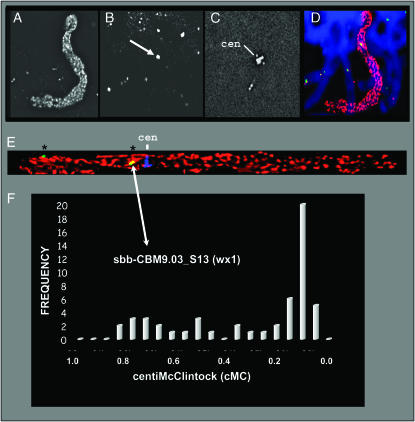
Figure 3.—
Image collection and FISH data analysis for the Waxy1 (wx1) locus. (A) The FITC image shows GISH-painted maize pachytene chromosome 9. (B) The rhodamine image shows the signals for wx1 (arrow). (C) The Cy-5 image shows centromere FISH signals (cen). (D) RGB pseudocolor overlay of the DAPI (blue), FITC (red), and rhodamine (green) images. (E) RGB pseudocolor overlay of projections of a straightened chromosome of the FITC (red), rhodamine (green), and Cy-5 (blue) images. FISH-like signals (*) are indicated. (F) Frequency histogram graph for all FISH signals along the short arm of chromosome 9 as described in materials and methods.

