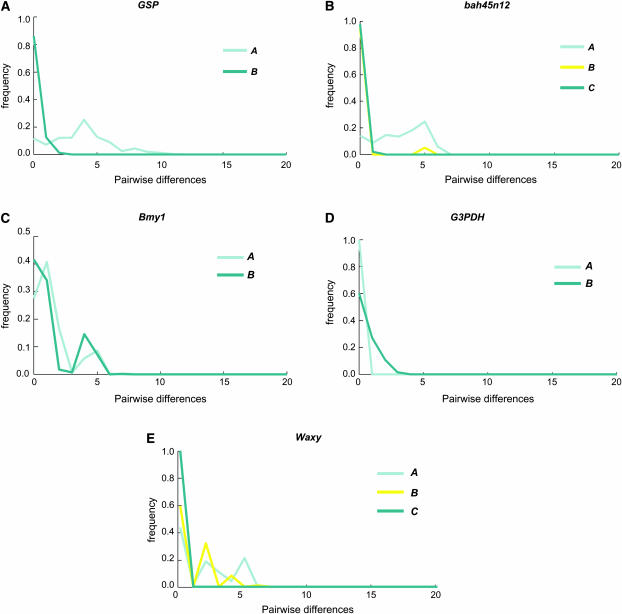
Figure 6.—
Mismatch distributions for each haplotype cluster in domesticated and wild barley. The distributions for all five study genes are indicated (A–E). The color of each of the lines corresponds to specific haplotype clusters shown in Figure 1.

