Abstract
Genomic instability characterizes the aneuploid cancer cell. Losses of genetic material are critical in cancer by exposing recessive mutations in tumor suppressor genes. Gains of genetic material also may lead to overexpression of genes contributing to tumor progression either in the presence or absence of mutation. However, the detection of moderate gains (such as tri-tetraploidy) has been a challenge in cancer research. Unbiased DNA fingerprinting by the arbitrarily primed PCR allows the detection of moderate gains (in addition to losses) of DNA sequences of known chromosomal localization. We have generated in this manner a molecular karyotype of metastatic colon cancer. This amplotype shows that sequences from several chromosomes undergo both losses (1, 4, 9, 14, and 18) and gains (6, 7, 12, and 20) in over half of the tumors. Moreover, gains of sequences from chromosomes 8 and 13 occurred in most tumors, indicating the existence in these chromosomes of positive regulators of cell growth or survival that are under strong positive selection during tumor progression. We conclude that overrepresentation of these chromosomal regions is a critical step for metastatic colorectal cancer. Comparative amplotype analysis from primary and metastatic tumors suggest the existence in chromosome 4 of gene(s) whose loss is specifically selected in cells that reach the metastatic stage.
Genomic instability characterizes neoplastic transformation and generates tumor cell aneuploidy. Mutations activate positive regulators of cell growth or survival and inactivate factors with a negative role in these processes (1). Losses of heterozygosity (LOH) unmask recessive mutations in tumor suppressor genes (2). LOH can be detected by restriction fragment length polymorphisms of polymorphic minisatellite loci (3, 4) and more recently (5) by PCR amplification of highly informative microsatellite loci (6). The “allelotype” approach was critical for the identification and subsequent characterization of RB and p53 (2, 4, 7) and the emergence of the tumor suppressor gene era.
But losses of genetic material provide only half of the picture of the distorted genome found in the majority of cancer cells. Chromosomal gains can be diagnostic indicators of the presence of dominant oncogenes such as c-K-ras (8, 9). Gains of genetic material also may lead to overexpression of genes contributing to tumor progression in the absence of mutation. Thus, moderate gains (e.g., equivalent to trisomy/tetrasomy) of chromosomal fragments have long been known to be germane to neoplasia (10–12). The detection of such moderate chromosomal changes has been a challenge in cancer research, and perhaps as a consequence, “the pathogenetic significance of such abnormalities is totally unknown,” as Mitelman et al. (13) wrote in their recent review.
Recent progress in the molecular genetics of cancer has facilitated the detection of allelic abnormalities at the subchromosomal level. Representation differential analysis is a powerful technique for the identification and isolation of sequences under- and overrepresented in tumor genomes (14). LOH analysis by restriction fragment length polymorphisms or microallelotyping procedures (3–5) can be used for the detection of tumor suppressor genes. However, these techniques cannot identify moderate gains of genetic material. Improvements to make PCR quantitative have been implemented for microallelotyping but at the expense of losing simplicity (15). Comparative genomic hybridization (CGH) has allowed the assessment of numerical and structural chromosome aberrations (16). However, CGH requires special instrumentation and only can detect alterations of relatively large chromosomal regions.
DNA fingerprinting of polymorphic minisatellites has been used to study anonymous somatic mutations during tumorigenesis, either by one- (17) or two- (18) dimensional gel electrophoresis. However, these techniques use Southern blot hybridization of genomic DNA, and the subsequent isolation and characterization of the altered sequences is difficult. The arbitrarily primed PCR or AP-PCR (19) is a PCR-based DNA fingerprinting technique that uses single primers of arbitrarily chosen sequence and several initial cycles of low stringency. Primer annealing at multiple sites generates many PCR products that represent a DNA fingerprint specific for each primer–DNA template combination. Comparison of the AP-PCR fingerprints from matched tumor and normal tissues identifies somatic mutations. AP-PCR DNA fingerprinting was instrumental for the identification of the microsatellite mutator phenotype pathway for cancer (20). The detection of recurrent fingerprint band shifts revealed the tumor-specific accumulation of hundreds of thousands of somatic clonal mutations. This genome-wide instability in repetitive sequences underlies a mutator phenotype pathway for some sporadic and hereditary gastrointestinal cancers (21).
The quantitative nature of AP-PCR fingerprinting also allows the detection of allelic losses and gains in tumor cells by the reduction or increase in intensity of tumor fingerprint bands, respectively (22). The chromosomal origins of most fingerprint bands can be assigned simultaneously by AP-PCR of somatic monochromosome cell hybrid panels (23). These features offer an excellent opportunity to use AP-PCR DNA fingerprinting as an unbiased molecular karyotyping of tumors. We have tested this hypothesis by applying AP-PCR to study the prevalence of allelic losses and gains at the late stages of colorectal tumor progression.
METHODS
Tumor Samples.
Primary colorectal tumors and their normal tissue counterparts included 12 primary Dukes’ D colon carcinomas and 25 colon cancer liver metastases (12 of these samples were derived from the same 12 primary carcinoma patients). Most of these tumors were obtained from the National Cancer Center at Tokyo. In agreement with the low incidence of metastasis in colon cancer of the microsatellite mutator phenotype (20), none of the tumorrs studied exhibited enhanced microsatellite instability. Some metastatic colorectal carcinomas and a panel of 80 tumors at earlier stages of tumor progression with follow-up data (24) were obtained from the Human Tissue Cooperative Network (University of Alabama, Birmingham).
AP-PCR DNA Fingerprinting.
Genomic DNA was prepared from tumor and normal tissues as described (22, 24). DNA (50–100 ng) was subjected to AP-PCR amplification in 25 μl of reaction mix: 1 unit of Taq DNA polymerase (Perkin—Elmer–Cetus), 10 mM Tris⋅HCl (pH 8.3), 50 mM KCl, 4.5 mM Mg Cl2, 0.1% gelatin, and 1 μM primer. The AP-PCR conditions were as described (22) with 25 high stringency cycles. The number of cycles is an important parameter to maintain linearity of amplification and is determined empirically for each primer. The PCR products were electrophoresed in a 5.5% polyacrylamide gel (22) at 55 W for 5–6 h. The MCG1 and BLUE arbitrary primers’ sequences have been described (23). The sequence of the F primer is 5′-ATT CAA GAC TGC CTT TCC TA-3′.
Chromosomal Assignment of AP-PCR Fingerprint Bands.
Chromosome assignment was determined by PCR of monochromosome human–rodent cell hybrids NIGMS panels 1 and 2 (Coriell Cell Repositories, Camden, NJ) by using specific primer sets previously designed based on the sequence of the cloned fragments. Bands were extracted with 100 μl of distilled water and reamplified with the same arbitrary primer and cloned by using the PCR script system (Stratagene) and the TA cloning system (Invitrogen) following the manufacturers’ instructions. To confirm the authenticity of the cloned bands, they were used as probes in Southern blots of AP-PCR gels (25). Correct clones were selected by comparison of the fingerprint and blotting patterns. The chromosomal origin of other fingerprint bands was determined by the SHARP method (23). Genomic Southern blot analysis of cloned AP-PCR bands was done as described (22).
Densitometrical Analysis.
The dried gels were exposed to x-ray film at room temperature without image intensifier or at −70°C with image intensifier at different time exposures. Autoradiograms were scanned with ImageMaster Desk Top Scanner (Pharmacia LKB). The scanned image was analyzed with imagemaster software (Pharmacia) by using an IBM-PC PS/V personal computer. The backgrounds of the x-ray film and of the individual lanes were subtracted by using the Rolling-Disk background subtraction method following the instructions by the manufacturer. Film calibration was made by serial dilution of 32P-labeled oligonucleotides, and the radioactivity was standardized by Cerenkov counting by using the LS3801 liquid scintillation system (Beckman), with the same exposure conditions as the AP-PCR fingerprinting gels.
Determination of the Status of Gains and Losses.
Scoring quantitative changes between normal and tumor tissue fingerprint bands was made by densitometrical analysis and by visual inspection. To establish the criteria for gain and loss in the densitometrical analysis, the data of the fingerprints of normal samples were calibrated. The mean SDs of nonpolymorphic bands were estimated to be ≈10%. In other words, the range of fluctuations in band intensity due to experimental variation usually was between 0.9 and 1.1. Considering the contamination of tumor tissue by normal cells, we established the normal range of apparent allelic variation from 0.75 to 1.25 of the tumor/normal ratio. Therefore, only fluctuations in band intensity superior to this range were considered diagnostic of chromosomal imbalances. Even with 50% of normal tissue DNA contamination in tumor DNA, the ratio of trisomy (in a hypothetical cell retaining diploidy in the rest of the chromosomes) would appear as 1.25 and the ratio of the loss of one allele would appear as 0.75. Our tumors did not have more than a 20–30% contamination of normal tissue, as analyzed by histological examination (data not shown). Therefore, our approaches have been conservative in the scoring of gains and losses.
RESULTS
Unbiased DNA Fingerprinting of Colorectal Cancer.
We applied AP-PCR DNA fingerprinting to the analysis of chromosomal numerical changes in human colorectal cancer. Two arbitrary primers, MCG1 and BLUE, were selected based on their fingerprints quality (low background) and quantity (>25 bands). The chromosomal origin for most of the fingerprint bands has been determined (23). Each autosome was represented by at least one fingerprint band, except chromosomes 18, 19, and 21. Therefore, estimation of band losses and gains of the fingerprints generated by these two primers allowed us to establish a molecular karyotype of colorectal cancer. We named this molecular karyotype an “amplotype” to distinguish it from the conventional “allelotype” whereby only LOH, and by inference allelic losses, can be determined. We chose to analyze metastatic tumors to determine the amplotype with the presumed highest number of chromosomal changes.
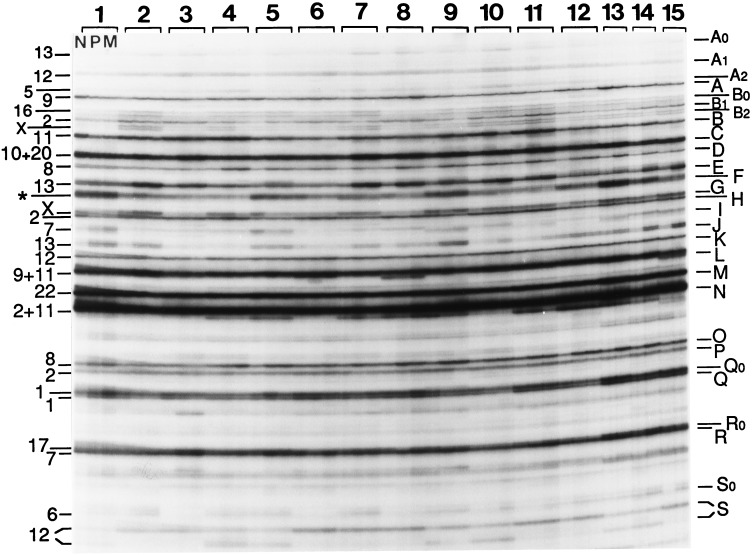
Fig. 1 shows the AP-PCR fingerprints generated by the arbitrary primer MCG1. Differences in band intensity were frequent in the DNA fingerprints from normal vs. tumor tissues. Some of these differences were due to variation in the overall levels of amplification between DNAs (compare the backgrounds of cases 10, 12, and 14) and were not considered significant (for instance the increased intensity of band A in the metastasis of case 14). The intensity changes of other bands were, on the other hand, reproducible (see Methods for the criteria followed for scoring gains and losses). Because of the complexity of the figure, we describe only some of the representative bands: D and O, derived from chromosome 8, and E and J, derived from chromosome 13. These bands showed consistent increases in tumor tissue DNAs, in contrast with other bands exhibiting sporadic intensity changes, such as the increased intensity of band A in cases 2 and 7 in both primary (P) and metastatic (M) tumors and case 8 (only M). Examples of increases in bands E and J: cases 1 (only band J, in both P and M); 2, 7 ,and 8 (both bands E and J, in both P and M); 3 (only band E, in both P and M). Examples of increases in bands D and O: cases 4, 5, and 12 (both bands D and O, in both P and M); 8–11 (band O, in both P and M; band D, in P); and cases 13 and 14 (both bands D and O).
Figure 1.
AP-PCR DNA fingerprints of colorectal tumors. Autoradiogram of a denaturing polyacrylamide sequencing gel of the AP-PCR fingerprints generated by arbitrary primer MCG1 with 100 ng of genomic DNA isolated from normal and tumor tissues from colorectal cancer patients indicated at the top. The first, second, and third fingerprint lanes of each case correspond to normal tissue (N), primary tumor (P), and liver metastasis (M). N, P, and M were available from patients 1–12, and only N and M were available for patients 13–15. Numbers at the left indicate the chromosomal origin of the bands named by letters at the right. Cases 1, 3, 6, 8, 10, and 12 were males. Band F (designated with an asterisk) was a composite of at least three sequences from chromosomes 2, 11, and 22. Some other bands were composite of sequences mainly derived from at least two chromosomes, such as bands C, L, and N (23). In these cases, no estimation of intensity variations was attempted, except for band C (see text). Some double bands represent the two strands of the same DNA molecule (such as bands B0, B2, G, and J). Band S represents a length polymorphism that resolves the two alleles by their different size in heterozygous cases (cases 4, 5, 9, 10, 13, and 14). The approximate size of some of the cloned fingerprint bands (in bp): D, 800; E, 750; F, 710; J, 575; M, 525; Q, 405.
Allelic Losses and Gains in Colorectal Cancer.
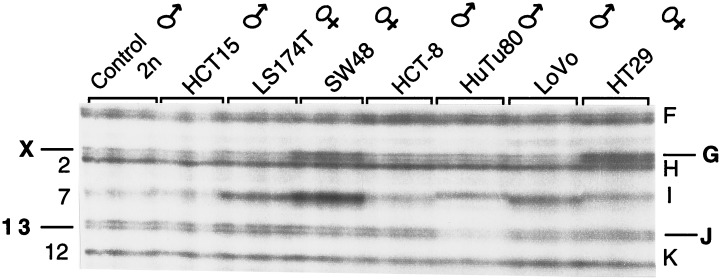
Southern blot hybridization experiments with cloned bands E, J, and D showed that tumor-specific increased intensity of these fingerprint bands was caused by the higher copy number of target sequences and not an artifact of the in vitro amplification (ref. 22 and data not shown). The quantitative nature of the amplification levels also is illustrated by the concordance of the relative intensities of band G from chromosome X with the gender of the cancer patients (Fig. 1). The ability of AP-PCR DNA fingerprinting to detect moderate changes of chromosome copy number also is shown in the fingerprints of tumor cell lines of known karyotype (Fig. 2). In addition to the correspondence of chromosome X band intensity with the gender of the donors, loss of an autosome is reflected by the decreased intensity of band J from chromosome 13 in the HuTu80 cell line, monosomic for this chromosome. The intensity variation of band gains (see Methods) ranged from 2.276 ± 1.27 in tumor DNA in the case with higher level of gains (chromosome 13 band E), which we estimate represents 3–7 copies.
Figure 2.
AP-PCR DNA fingerprints of tumor cell lines of characterized karyotypes. The cell lines (and their gender) are indicated at the top. Fingerprints were generated by using 40 and 60 ng of DNA of each cell line by using primer MCG1. The band names are at right, and the chromosomes of each band are at left. Bands G and J, from chromosomes X and 13, are double bands because the two DNA strands are resolved in these denaturing gels. Band I (chromosome 7) is polymorphic in the human population, including length polymorphisms, and there are nonlinear fluctuations in the intensity of the amplified PCR product due to sequence changes in the primer annealing regions. However, comparative analysis of tumor and normal tissues from the same individual is informative for gains or losses of these sequences because the problem of interindividual variation is eliminated. These cell lines were chosen because of their (pseudo)diploid nature (all but HT29). SW48 exhibits trisomy of 7, there is only one N13 in HuTu80 cells, and LS174-T is monosomic for X (American Tissue Cell Type Collection).
Ambiguity of Microallelotyping for Determining the Nature of Allelic Imbalances.
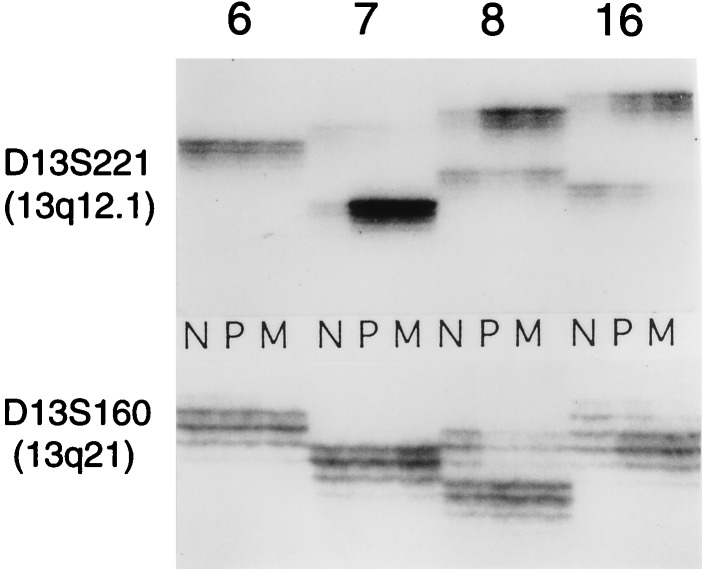
We carried out PCR amplification of two chromosome 13 microsatellite loci (Fig. 3) to determine the relationship between the chromosomal imbalances detected by fingerprinting and by microsatellite analysis, commonly used for the estimation of LOH in tumors (microallelotyping). The results show that microallelotyping may be misleading to interpret the allelic composition of the loci analyzed. Thus, in tumors 7, 8, and 16, the results can be interpreted as indicative of LOH at the D13S221 locus and in tumors 8 and 16 of the D13S160 locus. However, as shown by the fingerprints (Fig. 1), in concert with Southern blot hybridization (data not shown), the consistent change in these tumors was the gain but not the loss of chromosome 13 sequences. These results show that microallelotyping only detects allelic imbalances because an apparent loss of one allele in tumor compared with normal tissue can be caused by the gains of the other allele.
Figure 3.
Microallelotyping of colorectal tumors. Microsatellite repeats D13S160 and D13S221 (from chromosome 13q) were amplified by PCR from some of the same genomic DNAs that were used in the experiments of Fig. 1 (cases indicated at the top). The radioactive PCR products were analyzed in denaturing sequencing gels.
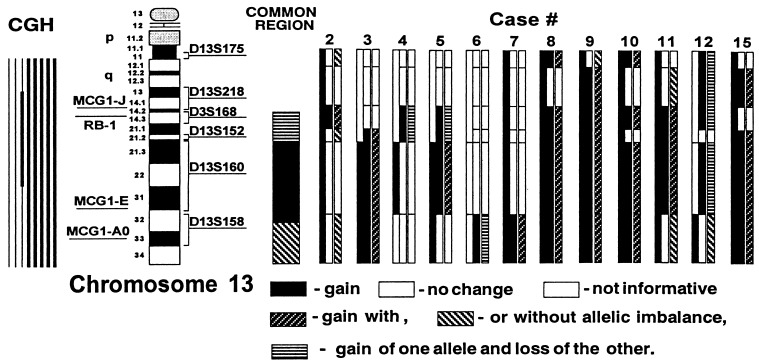
Although the use of microalleltyping alone is insuficient to determine gains, in combination with amplotyping it provides additional information on the chromosomal alterations undergone in the aneuploid cancer cell. For instance, whereas in the telomeric chromosome 13 region both alleles appear to be gained, in the more centromeric 13q14-q21 region, gains of one allele are accompanied by the losses of the other (Fig. 4).
Figure 4.
Chromosome 13 regions of gains and losses in metastatic colon cancer. The graph depicts chromosome 13 with the position of the Rb locus and the three amplotype bands from the MCG1 primer (A0, E, and J) determined by PCR of radiation hybrid panels (Navarro, M., Soto, J. L., Yasuda, J., Sekiya, T., and Perucho, M., unpublished work) and the dinucleotide repeats analyzed with their approximate localization. Triple bars summarize at right our analysis by amplotyping (left bars), microalleotyping (middle bars), and the combined analysis (right bars), for the metastatic tumors shown at the top. The summary of our studies, including other tumors not shown, is represented with a single bar under “Common region” in the center of the figure. At the left of the figure is the summary of chromosomal changes observed by CGH (32), where the thick lines represent chromosomal gains.
Amplotype of Colorectal Cancer.
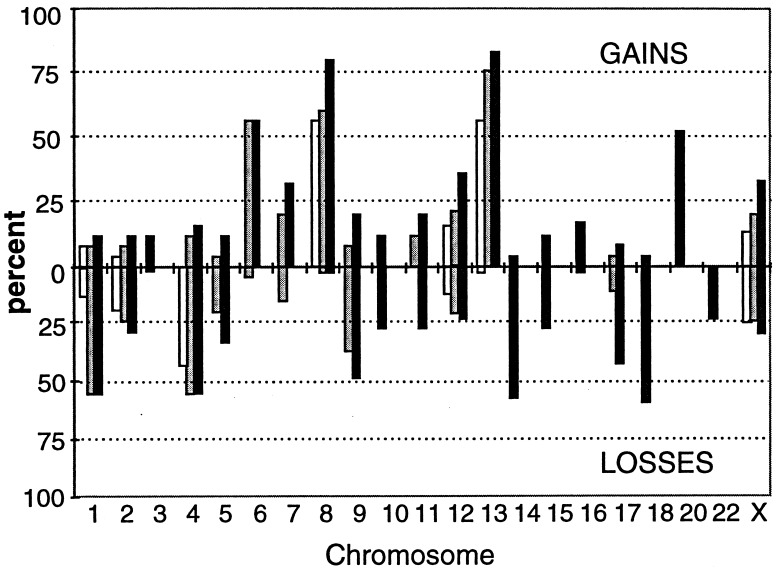
The global results of these analyses are represented in Fig. 5. The frequency of losses and gains was similar. An average of near 25% of all chromosomal regions analyzed exhibited losses or gains per tumor, and their combined values reached near 50%. The average frequency of chromosomal losses is slightly higher than the fractional allelic loss determined by allelotyping (4). This may be explained because of the more advanced stage of progression of our tumors. On the other hand, the amplotype approach is not as sensitive to detect allelic losses as the allelotype procedure because loss of one allele and reduplication of the other would score positive by allelotyping but negative by amplotyping. This situation is revealed by the combination of fingerprinting, Southern blot, and microallelotyping. For instance, case 7 shows that the intensity of the D band in the fingerprint is not decreased (Fig. 1). However, allelotyping of these bands showed the loss of one allele of the chromosome 8 D band in both primary and metastatic tumor (data not shown), indicating that the loss of one allele was accompanied by the reduplication of the other. A similar conclusion can be reached for the length polymorphic band S from chromosome 12 in both tumor tissues of case 9 (Fig. 1). The gain of the long allele compensates the loss of the short.
Figure 5.
Molecular karyotype (amplotype) of metastatic colon cancer. Each bar represents the percentage (among the 25 analyzed cancer cases) of loss (Lower) or gain (Upper) of a chromosomal region detected as a change of the intensity of a corresponding AP-PCR band. For instance, the three bands from chromosome 8 (bands D and O of MCG1 primer and band K from BLUE primer) are represented by three bars on chromosome 8. The data are derived from complete analysis of the fingerprints obtained with two primers, MCG1 and BLUE. A partial analysis of two bands from primer F generated information on the imbalance status of chromosomes 17 and 18.
The amplotype of metastatic colon cancer (Fig. 5) shows that losses of sequences from chromosomes 1, 4, 9, 14, and 18 occurred in ≈50% of the tumors. Over 50% of tumors also exhibited gains of bands from chromosomes 6 and 20 and over 75% of tumors exhibited gains in multiple bands from chromosomes 8 and 13.
Chromosomal Imbalances in Primary and Metastatic Colon Cancer.
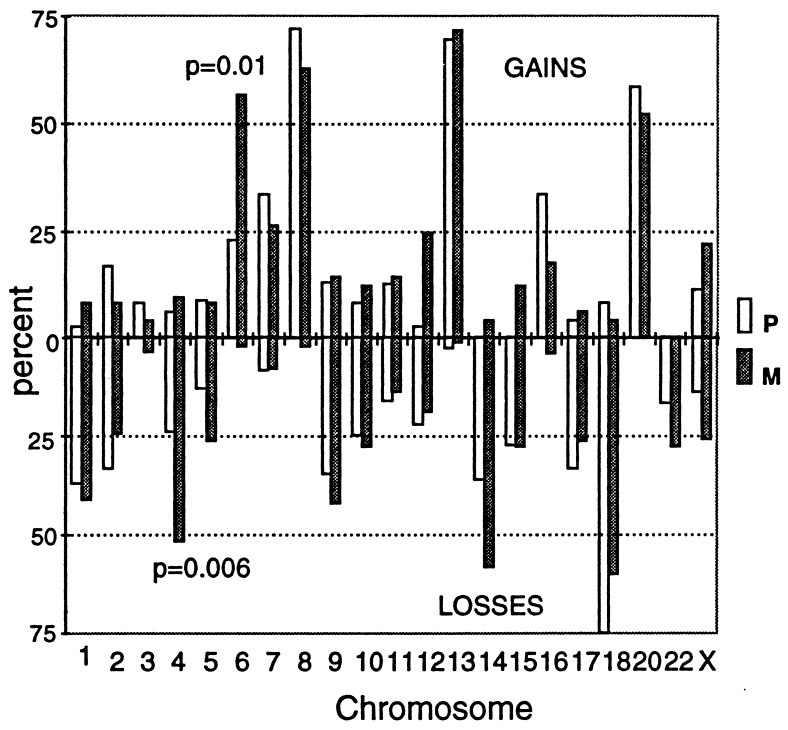
The availability of 12 cases with both primary and metastatic tumors allowed us to investigate whether any of the chromosomal changes were metastasis-specific. Most consistent gains or losses were not significantly associated with metastatic cancer. For instance, neither the gains of chromosome 8 nor 13 were events specific for the metastatic process but to precede it. However, chromosome 4 losses and chromosome 6 gains were significantly associated with the metastatic stage (Fig. 6).
Figure 6.
Comparative amplotypes of primary and metastatic colon cancer. The symbols are as in Fig. 4. Percentages indicate the average values of gains and losses from the multiple fingerprint bands for each chromosome (when appropriate, see Fig. 4) in the 12 primary (Dukes’ D) and 25 metastatic tumors. The P values of the comparison between primary (P) and metastatic (M) tumors were calculated by the Fisher exact test. Only statistically significant values are shown (losses of chromosome 4 and gains of 6) with the exception of chromosome 12 gains (P = 0.003). The P values considering only the 12 cases with primary and metastatic tumors from the same patients were P = 0.024 for chromosome 4 losses and P = 0.057 and P = 0.099 for chromosome 6 and 12 gains, respectively. Therefore, only the losses of chromosome 4 and gains of chromosome 6 are considered to be significantly increased in metastatic vs. primary tumors.
DISCUSSION
AP-PCR DNA fingerprinting can be used to detect genetic alterations during tumorigenesis. This approach presents several advantages compared with other techniques. One PCR allows quantitative comparison of normal and tumor tissues at multiple sites of the genome and also permits the single-step cloning of DNA fragments representing altered genomic sites (22). It also gives an overall picture of the extent of genetic damage in tumor cells that may have prognostic value for cancer (24). The technique also permits the simultaneous identification in many tumor samples of moderate allelic losses and gains. The genomic localization of these loci can be determined earlier at the chromosomal or subchromosomal levels by the use of somatic human–rodent monochromosome or radiation hybrids (refs. 22 and 23 and unpublished work). Consequently, this approach represents a molecular tool of high resolution for cancer cytogenetics.
Among the findings in this study is the existence of potential tumor suppressor genes for colorectal cancer at chromosomes 1 and 9 and for the metastatic stage at chromosome 4. There are no reports of recurrent chromosome 4 losses nor of metastasis-specific cancer genes in colorectal cancer. This underscores the power of unbiased DNA fingerprinting to identify new genomic regions containing potential tumor suppressor genes. In addition, losses of one of the bands from chromosome 4 have value as a poor prognostic indicator for colorectal cancer. Independent AP-PCR analysis of a collection of colorectal carcinomas for which follow-up information was available (24) revealed that, among the fingerprint band displaying recurrent alterations, somatic loss of the BLUE primer band N from chromosome 4 (23) was a prognostic indicator of poor survival (unpublished work). Therefore, the association of the losses of these sequences with the metastatic stage may be explained by assuming that the tumors that undergo the losses of these sequences have an enhanced ability to metastasize.
Another significant finding of our study is that moderate gains of chromosome sequences are equally prevalent as the losses. Although determination of losses is “digital” (yes or no), the extent of chromosomal sequence gains represented by the fingerprint bands is “analogical” because, in principle, there is no upper limit. However, we estimate that these gains represented no more than five to seven copies in any of the cases studied with the arbitrary primers used in this work. Detection of typical amplicons (undergoing more than 10-fold amplification) by AP-PCR DNA fingerprinting can be achieved by using more primers (26). The lower limit of detection of chromosomal gains appears to be 3, but because of sensitivity limitations of the method we cannot formally distinguish triploidy from tetraploidy. However, in contrast with the “digital” losses, the functional difference of an “analogical” gain of three vs. four copies seems not so critical.
We also found that gains of some chromosomes occur with a frequency significantly higher than previously reported by cytogenetic and molecular cytogenetic (CGH) approaches. This can be explained because our approach to detect gains is independent of the location of the gained sequences either in a chromosome recognizable cytogenetically or within a chromosomal region of a minimum size to be detectable by CGH. The high frequency of moderate gains of chromosomes 6, 8, and 13 illustrates the importance for tumor progression of chromosomal imbalances leading to moderate overrepresentation of gene products.
Evidence supporting the role in tumor development of moderate gains of genetic material is well established (10–12). However, these moderate gains in cancer development have remained essentially unexplored. This is due in part to fashionable changes in the prevalent scientific archetypes: first, there was the excitement of the studies on mutant dominant oncogenes and later on recessive tumor suppressor genes. These temporal fluctuations depend heavily on the technical advances preceding (2, 27) the trend-setting studies (4, 28). However, although several approaches have been applied to study genetic changes in cancer cells (see Introduction), no simple techniques have been available for the study of moderate gains of genetic material.
We have shown that DNA fingerprinting by AP-PCR fulfills the requirements for a technique, that because of its simplicity and sensitivity, it facilitates the estimation of the prevalence of moderate gains of genetic material in tumors. These gains imply the existence of a gene or a set of genes in the corresponding chromosomes whose moderate gains are selected during tumor progression, probably because their products confer a selective advantage for growth or survival to the tumor cells. This hypothesis is based on the principle that, if the same somatic mutation occurs independently and in a consistent manner, it is probably relevant for tumor development (7, 29).
Gains of chromosome 8q have been described in colorectal cancer by cytogenetics and molecular cytogenetics. The frequency of such gains, often due to trisomy, range from 20 to 50% by cytogenetics: 9 of 18 (30); 36 of 116 (31); or by CGH: 8 of 16 (32). Having used AP-PCR fingerprinting, we report here a frequency of gains of 76% by scoring individual fingerprint bands (Fig. 5). These three fingerprint bands have been localized to 8q subchromosomal regions (at a resolution of a few megabases) by the use of radiation hybrid panels (unpublished work). The data do not excludes c-Myc as the most obvious candidate for the 8q gene selected for during tumor progression. There are numerous reports on c-Myc amplification in colon cancer (ref. 33 and references therein). However, none of these reports reached a frequency as high as that we obtained by amplotyping, probably because of the difficulties in determining moderate levels (equivalent to trisomy/tetrasomy) of gains by molecular hybridization approaches. Therefore, the role of c-Myc activation in colorectal cancer might have been underestimated. Nevertheless, c-Myc may not be the only functional locus in the 8q gains, and the chromosomal region undergoing overrepresentation may contain additional relevant genes for tumor progression (34).
Similar analysis of the chromosome 13 gains yields a more complex pattern because the three fingerprint bands A0, E, and J are overrepresented concomitantly in many cases (Fig. 4). Work in progress is aimed to localize more precisely the common region(s) of gain of this chromosome, which also have been implicated previously in colon cancer by cytogenetic: 10 of 18 (30); 37 of 116 (31); restriction fragment length polymorphisms/LOH: 10 of 31 (35); and CGH: 8 of 16 (32) and 5 of 12 (36) analyses, but with lower frequency. Because of this high incidence, we conclude that overrepresentation of 13q loci is a nearly obligatory step for the late stages of colorectal cancer.
We also have shown that microallelotyping by PCR amplification of dinucleotide repeats exhibits an intrinsic ambiguity on the determination of losses or gains of the polymorphic alleles, which may be misleading to identify the relevant alteration (Fig. 3). Thus, microallelotyping may be only informative to determine allelic imbalances (37) but not LOH (38), which, as shown by our study, are not equivalent. However, in concert with DNA fingerprinting, microallelotyping may add critical information on the mechanisms underlying these chromosomal alterations. Our results indicate that, at least in some cases, the relevant alteration is the quantitative increase in genetic material because there appears to be a selection for gains of either of the two alleles. For instance, in some cases, one of the chromosome 13q alleles is overrepresented in the primary tumor, but the other is overrepresented in the metastasis (Fig. 4). In these situations, the gained chromosome probably harbors wild-type allele(s). On the other hand, gains of some sequences also may be accompanied by LOH (for instance, see Fig. 1 case 9, band S; Fig. 4 and refs. 39 and 40), suggesting the coexistence of positive and negative regulators of cell growth or survival closely located in the same chromosomal region. These findings may be disclosing a protective mechanism for cancer development because it would hinder the mutational unmasking of the oncogenic potential latent in these chromosomal regions.
Acknowledgments
We are grateful to Drs. Gosei Ishimaru and Manuel Navarro for their contributions to the Southern blots and radiation hybrid mapping. This work was supported by National Institutes of Health Grants CA38579 and CA63585 to M.P. and by Grants-in-Aid from the Ministry of Health and Welfare of Japan for the 2nd Term Comprehensive 10-Year Strategy for Cancer Control and a Grant for Research on Aging and Health from the Ministry of Health and Welfare of Japan. Part of the work was performed during stays of S.M. and M.P. at the National Cancer Center of Tokyo, as visiting scholars of the Foundation for Promotion of Cancer Research.
ABBREVIATIONS
- LOH
loss of heterozygosity
- CGH
comparative genomic hybridization
- AP-PCR
arbitrarily primed PCR
Footnotes
This paper was submitted directly (Track II) to the Proceedings Office.
References
- 1.Bishop J M. Genes Dev. 1995;9:1309–1315. doi: 10.1101/gad.9.11.1309. [DOI] [PubMed] [Google Scholar]
- 2.Cavenee W K, Dryja T P, Phillips R A, Benedict W F, Godbout R, Gallie B L, Murphree A L, Strong L C, White R L. Nature (London) 1983;305:779–784. doi: 10.1038/305779a0. [DOI] [PubMed] [Google Scholar]
- 3.Nakamura Y, Leppert M, O’Connell P, Wolff R, Holm T, Culver M, Martin C, Fujimoto E, Hoff M, Kumlin E, et al. Science. 1987;235:1616–1622. doi: 10.1126/science.3029872. [DOI] [PubMed] [Google Scholar]
- 4.Vogelstein B, Fearon E R, Kern S E, Hamilton S R, Preisinger A C, Nakamura Y, White R. Science. 1989;244:207–211. doi: 10.1126/science.2565047. [DOI] [PubMed] [Google Scholar]
- 5.Cawkwell L, Lewis F A, Quirke P. Br J Cancer. 1994;70:813–818. doi: 10.1038/bjc.1994.404. [DOI] [PMC free article] [PubMed] [Google Scholar]
- 6.Miesfeld R, Krystal M, Arnheim N. Nucleic Acids Res. 1981;9:5931–5947. doi: 10.1093/nar/9.22.5931. [DOI] [PMC free article] [PubMed] [Google Scholar]
- 7.Baker S J, Fearon E R, Nigro J M, Hamilton S R, Preisinger A C, Jessup J M, van Tuinen P, Ledbetter D H, Barker D F, Nakamura Y, et al. Science. 1989;244:217–221. doi: 10.1126/science.2649981. [DOI] [PubMed] [Google Scholar]
- 8.Winter E, Yamamoto F, Almoguera C, Perucho M. Proc Natl Acad Sci USA. 1985;82:7575–7579. doi: 10.1073/pnas.82.22.7575. [DOI] [PMC free article] [PubMed] [Google Scholar]
- 9.Winter E, Perucho M. Mol Cell Biol. 1986;6:2562–2570. doi: 10.1128/mcb.6.7.2562. [DOI] [PMC free article] [PubMed] [Google Scholar]
- 10.Rabinowitz Z, Sachs L. Nature (London) 1970;225:136–139. doi: 10.1038/225136a0. [DOI] [PubMed] [Google Scholar]
- 11.Spira J, Wiener F, Ohno S, Klein G. Proc Natl Acad SciUSA. 1979;76:6619–6621. doi: 10.1073/pnas.76.12.6619. [DOI] [PMC free article] [PubMed] [Google Scholar]
- 12.Klein G. Nature (London) 1981;294:313–318. doi: 10.1038/294313a0. [DOI] [PubMed] [Google Scholar]
- 13.Mitelman F, Mertens F, Johansson B. Nat Genet. 1997;15:417–474. doi: 10.1038/ng0497supp-417. [DOI] [PubMed] [Google Scholar]
- 14.Lisitsyn N A, Lisitsina N M, Dalbagni G, Barker P, Sanchez C A, Gnarra J, Linehan W M, Reid B J, Wigler M H. Proc Natl Acad Sci USA. 1995;92:151–155. doi: 10.1073/pnas.92.1.151. [DOI] [PMC free article] [PubMed] [Google Scholar]
- 15.Celi F S, Cohen M M, Antonarakis S E, Wertheimer E, Roth J, Shuldiner A R. Genomics. 1994;21:304–310. doi: 10.1006/geno.1994.1270. [DOI] [PubMed] [Google Scholar]
- 16.Kallioniemi A, Kallioniemi O P, Sudar D, Rutovitz D, Gray J W, Waldman F, Pinkel D. Science. 1992;258:818–821. doi: 10.1126/science.1359641. [DOI] [PubMed] [Google Scholar]
- 17.Thein S L, Jeffreys A J, Gooi H C, Cotter F, Flint J, O’Connor N T, Weatherall D J, Wainscoat J S. Br J Cancer. 1987;55:353–356. doi: 10.1038/bjc.1987.71. [DOI] [PMC free article] [PubMed] [Google Scholar]
- 18.Verwest A M, de Leeuw W J, Molijn A C, Andersen T I, Borresen A L, Mullaart E, Uitterlinden A G, Vijg J. Br J Cancer. 1994;69:84–92. doi: 10.1038/bjc.1994.13. [DOI] [PMC free article] [PubMed] [Google Scholar]
- 19.Welsh J, McClelland M. Nucleic Acids Res. 1990;18:7213–7218. doi: 10.1093/nar/18.24.7213. [DOI] [PMC free article] [PubMed] [Google Scholar]
- 20.Ionov Y, Peinado M A, Malkhosyan S, Shibata D, Perucho M. Nature (London) 1993;363:558–561. doi: 10.1038/363558a0. [DOI] [PubMed] [Google Scholar]
- 21.Perucho M. Biol Chem. 1996;377:675–684. [PubMed] [Google Scholar]
- 22.Peinado M A, Malkhosyan S, Velazquez A, Perucho M. Proc Natl Acad Sci USA. 1992;89:10065–10069. doi: 10.1073/pnas.89.21.10065. [DOI] [PMC free article] [PubMed] [Google Scholar]
- 23.Yasuda J, Navarro M, Malkhosyan S, Velazquez A, Seikya T, Perucho M. Genomics. 1996;34:1–7. doi: 10.1006/geno.1996.0235. [DOI] [PubMed] [Google Scholar]
- 24.Arribas R, Capella G, Tortola S, Masramon L, Grizzle W E, Perucho M, Peinado M A. J Clin Oncol. 1997;15:3230–3240. doi: 10.1200/JCO.1997.15.10.3230. [DOI] [PubMed] [Google Scholar]
- 25.Perucho M, Welsh J, Peinado M A, Ionov Y, McClelland M. Methods Enzymol. 1995;254:275–290. doi: 10.1016/0076-6879(95)54020-2. [DOI] [PubMed] [Google Scholar]
- 26.Okazaki T, Takita J, Kohno T, Handa H, Yokota J. Hum Genet. 1996;98:253–258. doi: 10.1007/s004390050203. [DOI] [PubMed] [Google Scholar]
- 27.Wigler M, Pellicer A, Silverstein S, Axel R. Cell. 1978;14:725–731. doi: 10.1016/0092-8674(78)90254-4. [DOI] [PubMed] [Google Scholar]
- 28.Shih C, Shilo B Z, Goldfarb M P, Dannenberg A, Weinberg R A. Proc Natl Acad Sci USA. 1979;76:5714–5718. doi: 10.1073/pnas.76.11.5714. [DOI] [PMC free article] [PubMed] [Google Scholar]
- 29.Perucho M, Goldfarb M, Shimizu K, Lama C, Fogh J, Wigler M. Cell. 1981;27:467–476. doi: 10.1016/0092-8674(81)90388-3. [DOI] [PubMed] [Google Scholar]
- 30.Muleris M, Salmon R J, Dutrillaux B. Cancer Genet Cytogenet. 1990;46:143–156. doi: 10.1016/0165-4608(90)90100-o. [DOI] [PubMed] [Google Scholar]
- 31.Bardi G, Sukhikh T, Pandis N, Fenger C, Kronborg O, Heim S. Genes Chromosomes Cancer. 1995;12:97–109. doi: 10.1002/gcc.2870120204. [DOI] [PubMed] [Google Scholar]
- 32.Ried T, Knutzen R, Steinbeck R, Blegen H, Schrock E, Heselmeyer K, du Manoir S, Auer G. Genes Chromosomes Cancer. 1996;15:234–245. doi: 10.1002/(SICI)1098-2264(199604)15:4<234::AID-GCC5>3.0.CO;2-2. [DOI] [PubMed] [Google Scholar]
- 33.Marcu K B, Bossone S A, Patel A J. Annu Rev Biochem. 1992;61:809–860. doi: 10.1146/annurev.bi.61.070192.004113. [DOI] [PubMed] [Google Scholar]
- 34.Okazaki T, Takita J, Kohno T, Handa H, Yokota J. Hum Genet. 1996;98:253–258. doi: 10.1007/s004390050203. [DOI] [PubMed] [Google Scholar]
- 35.Lothe R A, Fossli T, Danielsen H E, Stenwig A E, Nesland J M, Gallie B, Borresen A L. J Natl Cancer Inst. 1992;84:1100–1108. doi: 10.1093/jnci/84.14.1100. [DOI] [PubMed] [Google Scholar]
- 36.Schlegel J, Stumm G, Scherthan H, Bocker T, Zirngibl H, Ruschoff J, Hofstadter F. Cancer Res. 1995;55:6002–6005. [PubMed] [Google Scholar]
- 37.Ah-See K W, Cooke T G, Pickford I R, Soutar D, Balmain A. Cancer Res. 1994;54:1617–1621. [PubMed] [Google Scholar]
- 38.Nawroz H, van der Riet P, Hruban R H, Koch W, Ruppert J M, Sidransky D. Cancer Res. 1994;54:1152–1155. [PubMed] [Google Scholar]
- 39.Wirschubsky Z, Wiener F, Spira J, Sumegi J, Klein G. Int J Cancer. 1984;33:477–481. doi: 10.1002/ijc.2910330410. [DOI] [PubMed] [Google Scholar]
- 40.Achille A, Biasi M O, Zamboni G, Bogina G, Magalini A R, Pederzoli P, Perucho M, Scarpa A. Cancer Res. 1996;56:3808–3813. [PubMed] [Google Scholar]


