

Abstract
We have used time-lapse digital imaging microscopy to examine cytoplasmic astral microtubules (Mts) and spindle dynamics during the mating pathway in budding yeast Saccharomyces cerevisiae. Mating begins when two cells of opposite mating type come into proximity. The cells arrest in the G1 phase of the cell cycle and grow a projection towards one another forming a shmoo projection. Imaging of microtubule dynamics with green fluorescent protein (GFP) fusions to dynein or tubulin revealed that the nucleus and spindle pole body (SPB) became oriented and tethered to the shmoo tip by a Mt-dependent search and capture mechanism. Dynamically unstable astral Mts were captured at the shmoo tip forming a bundle of three or four astral Mts. This bundle changed length as the tethered nucleus and SPB oscillated toward and away from the shmoo tip at growth and shortening velocities typical of free plus end astral Mts (∼0.5 μm/min). Fluorescent fiduciary marks in Mt bundles showed that Mt growth and shortening occurred primarily at the shmoo tip, not the SPB. This indicates that Mt plus end assembly/disassembly was coupled to pushing and pulling of the nucleus. Upon cell fusion, a fluorescent bar of Mts was formed between the two shmoo tip bundles, which slowly shortened (0.23 ± 0.07 μm/min) as the two nuclei and their SPBs came together and fused (karyogamy). Bud emergence occurred adjacent to the fused SPB ∼30 min after SPB fusion. During the first mitosis, the SPBs separated as the spindle elongated at a constant velocity (0.75 μm/min) into the zygotic bud. There was no indication of a temporal delay at the 2-μm stage of spindle morphogenesis or a lag in Mt nucleation by replicated SPBs as occurs in vegetative mitosis implying a lack of normal checkpoints. Thus, the shmoo tip appears to be a new model system for studying Mt plus end dynamic attachments and much like higher eukaryotes, the first mitosis after haploid cell fusion in budding yeast may forgo cell cycle checkpoints present in vegetative mitosis.
Keywords: yeast, microtubules, mitosis, mating, karyogamy
The stages of the budding yeast mating pathway from shmoo formation through first mitosis are diagrammed in Fig. 1 (for review see Marsh and Rose, 1997). Haploid yeast cells are either mating type a or alpha. Mating begins when pheromones from one mating type are recognized by cells of opposite mating type, inducing the latter to arrest in the G1 phase of the cell cycle and initiate polarized cell growth toward the source of pheromone. This polarized growth results in formation of a mating or shmoo projection followed by three microtubule (Mt)1-dependent processes.
Figure 1.

A diagram of the stages of the mating pathway and first mitosis in budding yeast. The stages are derived from previous fixed time point assays (Marsh and Rose, 1997) and here in living cells using dynein–GFP (astral Mts) Nuf2–GFP (SPBs), GFP– tubulin (spindles), and DIC multimode time-lapse microscopy.
Nuclear orientation to the preshmoo or shmoo tip is the first Mt-dependent process. Immunofluorescence of fixed cells has shown that nuclear orientation and movement into the shmoo occur when the spindle pole body (SPB) in the nuclear envelope becomes oriented towards the shmoo via astral Mts. Electron microscopic studies as well as use of antibodies to tubulin show a bar or bundle of Mts from the SPB to the shmoo tip (Byers and Goetsch, 1975; Rose and Fink, 1987). It is thought that minus ends of Mts are localized to the SPB with plus ends free in the cytoplasm, as has been shown in higher eukaryotic centrosomes and associated Mts (Brinkley, 1985). We will refer to the polarity of astral Mts here as minus ends at the SPB and plus ends distal at the SPB. Disruption of Mts by mutation or by pharmacological agents prevents nuclear localization towards the shmoo tip without visibly impairing shmoo formation (Delgado and Conde, 1984; Hasek et al., 1987; Read et al., 1992). How astral Mts become oriented and attached to the shmoo tip is not clear. One attractive hypothesis is a search and capture mechanism where shmoo tip complexes capture plus ends of astral Mts. This hypothesis is derived from the dynamic instability behavior of astral Mts observed in vegetative cells in which astral Mts repeatedly grow and shorten, probing the cortex of the G1 cell searching for the bud (Shaw et al., 1997b).
The second Mt-dependent pathway is karyogamy, movement together, and fusion of haploid nuclei and their SPBs. After contact of the mating projections, cell walls and membranes fuse, mixing the cytoplasms of the partner cells (Byers and Goetsch, 1975; Byers, 1981). Mts from the partner cells then interact to facilitate karyogamy. The Kar3p kinesin related protein has been shown, along with a nonmotor protein, Kar1p, to be essential for nuclear fusion (Rose and Fink, 1987; Meluh and Rose, 1990; Vallen et al., 1992). Kar3p, a minus-directed Mt-based motor protein in vitro (Endow et al., 1994; Middleton and Carbon, 1994), has been hypothesized to act by cross-linking Mts from opposite poles and then pulling the poles together by means of its motor activity. Kar3p may also function to regulate dynamic instability by shortening astral Mts and the internuclear bundle of Mts during karyogamy. Evidence for this hypothesis includes concentration of Kar3p at SPBs (Meluh and Rose, 1990), vegetative cells lacking or mutant in the Kar3 gene have hyperlong astral Mts (Saunders et al., 1997), and the ability of recombinant Kar3p to promote minus end disassembly of taxol stabilized Mts in vitro (Endow et al., 1994).
First zygotic division is the third Mt-dependent process in the mating pathway. Electron microscopy has shown that after nuclear fusion, the SPBs fuse to create the diploid SPB (Byers and Goetsch, 1975). DNA replication, SPB duplication, and bud emergence ensue. The bud emerges from a cortical site that coincides with the position of the SPB (Byers, 1981). Shortly after bud emergence, the SPBs separate as the first zygotic spindle forms. The spindle and nucleus elongate into the bud and toward a distal site in the mother cell. After cytokinesis, both the mother and bud enter the vegetative cell cycle.
The advent of time-lapse multimode digital imaging methods (Kahana et al., 1995; Carminati and Stearns, 1997; Shaw et al., 1997a; Straight et al., 1997) together with the introduction of green fluorescent protein (GFP) into yeast now allows visualization of the dynamics of astral Mts, spindle poles, and the spindle itself in living cells. We have used GFP fusions to cytoplasmic dynein, tubulin, and the spindle pole protein, Nuf2p to examine astral Mt, spindle, and SPB dynamics during nuclear orientation to the shmoo tip, karyogamy, and first zygotic division. These studies reveal novel kinetic and morphological aspects of yeast diploid formation highlighting the shmoo tip as a dynamic attachment site for Mt plus ends and a possible lack of mitotic checkpoints in the first zygotic division.
Materials and Methods
Strains and Reagents
The haploid strains 9d (MATα, lys2–801, his3–200, ura3–52, leu2–3, 112) and 8d (MATa , lys2–801, trp1Δ, ura3–52, leu2–3, 112) were parent strains for all experiments. 9d and 8d were transformed with the plasmids containing the fusion proteins listed below to produce cells with dynein–GFP, tubulin–GFP, or Nuf2–GFP. Mating studies were performed using transformed 9d cells mated to an a type mating tester (MATa, ade6 ) that did not contain any GFP fusion proteins. In some experiments, alpha factor (Sigma) was used at 10 μg/ml and applied for 1–2 h to liquid 8d cultures in order to produce cells with visible shmoo growth.
Construction and Expression of a Dynein–GFP, GFP–Tubulin, and Nuf2–GFP Fusion Proteins
A galactose inducible dynein–GFP fusion protein was constructed by introducing GFP (S65T) into the COOH terminus of the cytoplasmic dynein heavy chain gene (Shaw et al., 1997b). Cells were grown to midlogarithmic growth phase in glucose, followed by a short induction on galactose (∼2 h). Aliquots of cells were removed and placed onto a 5-μm-thick, 25% gelatin slab containing 2% glucose (Yeh et al., 1995). Expression was repressed for the duration of recording to restrict analysis to existent dynein.
Also used in this study were a GFP–tubulin (gift of A. Straight, Harvard Medical School, Boston, MA) and Nuf2p–GFP (Kahana et al., 1995). These two fusions were separately integrated into the genome of strain 9d or 8d and constitutively expressed by the native promoter for the given protein.
Microscopy, Image Processing, and Analysis for Dynein–GFP-labeled Mts
Cells were selected for imaging as described by Shaw et al. (1997b) by identification of faint green fluorescence at 75× magnification to the camera using 100% of the fluorescence excitation light at 490 nm. Variable levels of dynein–GFP were observed in all transformed strains. After increasing magnification to 150× and attenuating the fluorescence excitation to <10%, a single 3-s exposure was taken and compared with a fluorescent reference standard imaged under the same conditions. Cells containing an average fluorescence of less than 20% relative to the reference fluorescence (arbitrary units) were selected for time-lapse observation.
Imaging was performed using the microscope system described by Salmon et al. (1994) and modified by Shaw et al. (1997a). Fluorescence emission from 3-s exposures was collected through a 530 ± 15 nm band-pass filter. A total of five fluorescence images were acquired at a z-distance of 1 μm between each image. A single differential interference contrast (DIC) image was made at the middle z-step by rotating the analyzer into the light path and taking a 0.6-s exposure. The entire acquisition regime was repeated once every 60 s for time-lapsed imaging. For measurements of Mt dynamics, three exposures of 1-s duration were taken at 100% fluorescence excitation at 1 μm axial steps. This acquisition regime was repeated every 15 s for a maximum of 15 min.
A single background image constructed by averaging 24 3-s exposures with no illumination was subtracted from each GFP image to remove noise introduced by the camera. The five (or three) images corresponding to a single time-lapse point were projected to a single image by using only the brightest pixel at any one location in all five image planes. Registration of DIC and fluorescence images was verified by imaging of 1-μm fluorescent beads in DIC and fluorescence modes and determining displacement using the Metamorph software package. For presentation, dynein–GFP and corresponding DIC images were overlaid or placed side by side and contrast enhanced using Metamorph (Universal Imaging) or Photoshop (Adobe Systems). Images for publication were scaled and interpolated to 300 dots per inch.
Average fluorescence and maximum fluorescence data were collected by creating a region of interest around a cell in the reconstructed image using quantitation tools in the Metamorph software package. Average and maximum fluorescence values were compared with data from a fluorescence reference slide (Applied Precision) imaged under identical conditions. Rates of Mt elongation and shortening were determined by measurement of Mt length in time-lapsed image sequences. Mt length was determined by measuring individual Mts from the center of the SPB fluorescence to the Mt end and converting from pixels to microns using an image of a stage micrometer. Where necessary, the original five (or three) planes were used to identify dynein–GFP-labeled Mts that moved through more than one focal plane.
Fluorescence Speckle Microscopy in Shmoo Tip Mt Bundles
This technique is described in detail elsewhere (Waterman-Storer and Salmon, 1998), as are applications of fluorescence speckle microscopy (FSM) (Waterman-Storer et al., 1998). In brief, FSM is a new method for visualizing the movement and sites of assembly of Mts in living cells. Fluorescent speckles in the Mt lattice originate by coassembly of a small fraction of fluorescently labeled subunits in a pool of unlabeled subunits. Random variation in subunit association creates a nonuniform fluorescent speckle pattern along the Mt. For our yeast application, we used a fusion to the amino terminus of the major alpha tubulin of yeast (Tub1p) with GFP. This labeled tubulin does not complement a tub1 deletion (Straight et al., 1997). However, when the native Tub1p and GFP–Tub1p (GFP– tubulin) are coexpressed, cells grew and divided with wild-type kinetics. The GFP–tubulin in these studies was expressed from a copy of the endogenous Tub1 promotor. The level of GFP–tubulin produced in the cells was sufficiently low in a percentage of cells to create fluorescent speckles in the Mt lattice.
To induce the mating response, a GFP–tubulin-expressing strain of 9d was mixed with an a type mating tester strain. Cells were observed by bright-field and epifluorescence microscopy on a Nikon E-600 FN fixed stage microscope equipped with a 100×/1.4 NA Planapochromatic lens and a Chroma HiQ FITC filter set. Cells observed to be shmooing were imaged using both bright-field and fluorescence modes. Imaging and image processing was similar to that used for dynein–GFP cells with the following exceptions. Time-lapse intervals ranged from 1 to 15 s and single focal planes were acquired in lieu of z-sections. Exposure times ranged from 200 to 800 ms. The images were acquired by a Hamamatsu c4742-95 Orca camera controlled by Metamorph imaging software (Universal Imaging). Images were not binned in order to retain diffraction limited spatial resolution at 100× total magnification to the camera.
Laser Photobleaching of Tubulin–GFP Mts
For photobleaching experiments, cells containing constitutively expressed tubulin–GFP were combined with a mating tester strain (see above) of opposite mating type and prepared for imaging as described above for dynein–GFP. Techniques for marking fluorescent Mts by Argon laser photobleaching (488 nm wavelength) are well established (e.g., Wadsworth and Salmon, 1986). In this study, time-lapse epifluorescence images were obtained on a Zeiss AT model 100 inverted microscope (Carl Zeiss) using a 100×/1.3 NA Plan Fluor objective lens, a fluorescein filter set, and a 100-W Hg epifluorescence illuminator with no attenuation. Images were acquired through a Princeton Instruments MicroMax cooled charge-coupled device camera (Princeton Instruments) mounted on the bottom port of the microscope at the primary image plane. Custom time-lapse software called Phatlapse controlled the excitation shutter (Vincent Associates [VA]), filter wheel (Ludl Electronic Products [LEP]), z-motor stepping (LEP), image acquisition (Princeton Instrument's WinView software), laser shutter (VA) for photobleaching, and a motorized mirror (New Focus) for introducing the photobleaching laser light into the epiillumination light path. A stack of fluorescence optical sections was acquired at 15-s intervals in time-lapse mode. Each stack consisted of five 250-ms exposures taken 0.75 μm apart in the z dimension. Targeting of the laser on the specimen was done using an intensified silicon intensifier tube (ISIT) camera to view the fluorescent specimen at very low excitation light levels on a video monitor. A cylindrical lens was used with the objective to focus the laser into a bar ∼0.3 μm wide on the fluorescent bundle of Mts oriented toward the shmoo tip. Laser exposure times varied from 200 to 800 ms for photobleaching.
Results
Nuclear Localization to the Shmoo Projection Depends on an Astral Mt Search and Capture Mechanism and Mt Attachment to the Shmoo Tip
We used GFP protein fusions and time-lapse digital imaging microscopy to investigate the mechanism of formation and maintenance of the Mt bundle to the shmoo tip. Haploid cells containing dynein–GFP, Nuf2p–GFP, or GFP– tubulin were mated to nonexpressing cells of opposite mating type. Fig. 2 shows two cells expressing dynein–GFP mating to nonexpressing partner cells. In late-telophase and G1 cells, astral Mts exhibited dynamic instability, transiently growing to the cell cortex in directions opposite to nuclear movement in the cell (Fig. 3). In G1 mating cells, there was a conical array of 4 ± 0.8 astral Mts per SPB which grew and shortened with an average rate of ∼0.5 μm/min (Fig. 3, 6-min time point and Table I). The number, dynamic properties, and behavior of Mts were similar to those reported for astral Mts and nuclear movement in vegetative G1 haploid and diploid cells (Carminati and Stearns, 1997; Shaw et al., 1997b).
Figure 2.
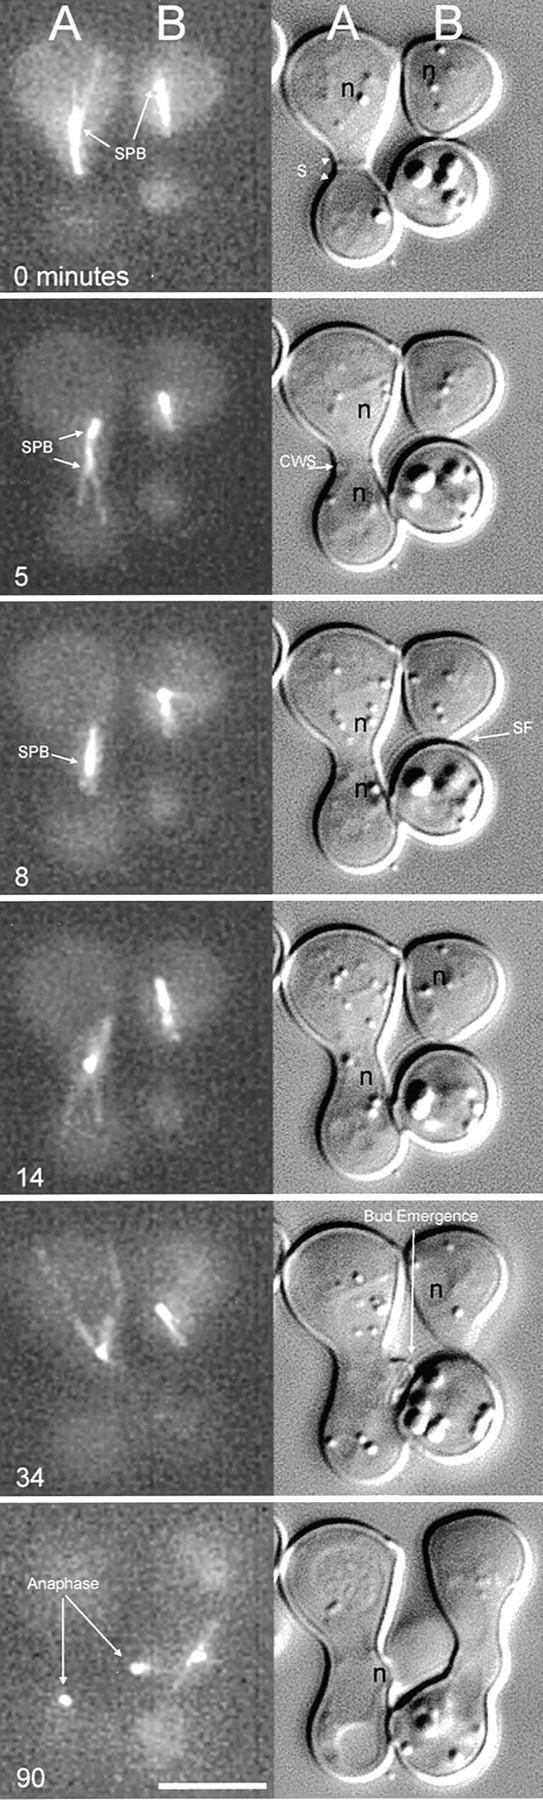
Composite view of the mating process and first division as seen by time-lapse multimode microscopy. Each panel contains a maximum intensity projection image of dynein–GFP (left, see Materials and Methods) and the corresponding DIC image (right). Two pairs of mating cells (A and B) are shown. In each case, the top cell contains dynein–GFP, whereas the bottom cell does not before mating. At t = 0 min, each cell in the A pair has well-developed shmoos. The mating pair is beginning the polarization process as evident by the astral Mts in the top cell (B). t = 5 min shows the A pair undergoing cell fusion. Dynein–GFP becomes distributed to all zygotic Mts and both SPBs. The CWS can be seen in the DIC image at the 5-min time point; however, the membranes must have fused based on the distribution of dynein–GFP in the lower partner cell. The top B cell is maintaining the shmoo tip Mt bundle attachment and therefore maintaining nuclear orientation toward the shmoo tip. At t = 8 min, the SPBs of the A pair have congressed and are no longer resolvable as two fluorescent spots; the nuclei appear to still be separate in the DIC image. The B pair is undergoing shmoo formation (SF) as is evident in DIC. At t = 14 min, the nuclei of the A mating pair have completed karyogamy, forming one nucleus and the astral Mts are extending throughout the zygote, exhibiting dynamic instability (see Table I for dynamic parameters). The B pair is still in the shmoo formation stage with the astral Mts of the dynein– GFP expressing cell clearly maintaining nuclear orientation to the shmoo tip. At t = 34 min, a bud can be seen emerging from the A mating pair zygote. The SPB remained at the site of cell fusion and was never seen to traverse around the zygote as observed in vegetative G1 cells. At t = 90 min, anaphase is underway in the A zygote. The B pair has now fused to form a zygote and the SPBs have congressed as seen previously for the 8-min time point in the A pair. Bar, 5 μm.
Figure 3.

Astral Mts orient to the shmoo tip by a search and capture mechanism. A mixture of MATa and dynein–GFP containing MATα cells were observed by time-lapse multimode microscopy. The cell pictured was observed from completion of mitosis (therefore before initiating the mating response) to the end of karyogamy. Arrowheads point to the site of shmoo growth. Bar, 2 μm.
Table I.
Measured Parameters of Mt Dynamics during the Mating Process
| Mts in mating projection* | Mts away from mating projection | Mts after zygote formation | ||||
|---|---|---|---|---|---|---|
| Growth rate (μm/min) | 0.50 ± 0.28 (n = 20) | 0.56 ± 0.25 (n = 8) | 0.62 ± 0.32 (n = 19) | |||
| Shortening rate (μm/min) | 0.46 ± 0.17 (n = 21) | 0.68 ± 0.26 (n = 11) | 0.51 ± 0.21 (n = 26) | |||
| Catastrophy frequency | 0.25/min | 0.31/min | 0.28/min | |||
| Rescue frequency | 0.25/min | — | — | |||
| Average total lifetime (min) | 14.07 ± 6.87 (n = 14) | 3.56 ± 1.62 (n = 18) | 6.75 ± 0.98 (n = 8) | |||
| Average length (μm) | 3.09 ± 0.9 (n = 53) | 0.92 ± 0.83 (n = 53) | 2.33 ± 0.74 (n = 54) |
Measurements from SPB oscillations toward and away from the shmoo tip; i.e., the shmoo tip Mt bundle, not individual Mts.
Astral Mts became distinctly oriented toward one region of a mating cell, often before visible growth of a mating (shmoo) projection (Fig. 3, 30-min time point). Identification of this site as the preshmoo tip was determined by subsequent time-lapse images. Mt interactions with the preshmoo tip cortex were often the first morphological manifestation of mating. The cell shown in Fig. 3 was observed to finish mitosis and then mate with a neighboring cell. After spindle disassembly, the nucleus moved around the G1 cell in a rotatory fashion as described above (Fig. 3, time points 0–21). Astral Mts showed no preference for any given cell quadrant. When the free ends of astral Mts came in contact with the preshmoo tip site, a persistent attachment was formed (Fig. 3, time point 30). A bundle of fluorescent astral Mts formed between the SPB and the shmoo tip as new Mt growth became orientated toward the shmoo tip (Figs. 2 and 4). In cells with shmoo projections (Figs. 2, 4, and 5), the fluorescence of the bundle of Mts from the SPB to the shmoo tip was 3.5 ± 1.2 (n = 7 cells)-fold greater than the average fluorescence of a single astral Mt. This ratio indicates an average of three to four astral Mts in the shmoo tip bundle. Shmoo tip Mt bundles were never observed to detach from the shmoo tip in over 300 min of recording before cell fusion and karyogamy. This persistence is much longer than the 3.5-min average lifetime of astral Mts with free ends (Table I). Persistent attachment did not affect Mt dynamic instability (see below and Figs. 4 and 5). Not all astral Mts became attached to the shmoo tip and those unattached Mts continued to exhibit dynamic instability, growing and shrinking at 0.56 ± 0.25 and 0.68 ± 0.26 μm/min, respectively (Fig. 3; Table I). Stable interactions (localization >3 min) of astral Mts in regions of the cortex outside the shmoo tip or preshmoo tip were exceedingly rare, as reported by Shaw et al. (1997b) for vegetative cells.
Figure 4.

(A) Graph of a representative example of SPB oscillations toward and away from the shmoo tip which are coupled to the shortening and growth of the shmoo tip bundle of astral Mts. The distance from SPB to shmoo tip is plotted on the y-axis and time in mins is plotted along the x-axis. Open circles indicate time points used for images in B. Measurements were repeated three times and differed by less than 0.15 μm (data not shown). (B) Projection images (see text) of dynein–GFP for time points corresponding to mins 34–39 (open circles) on graph in A. SPB, spindle pole body; ST, shmoo tip. Bar, 2 μm.
Figure 5.
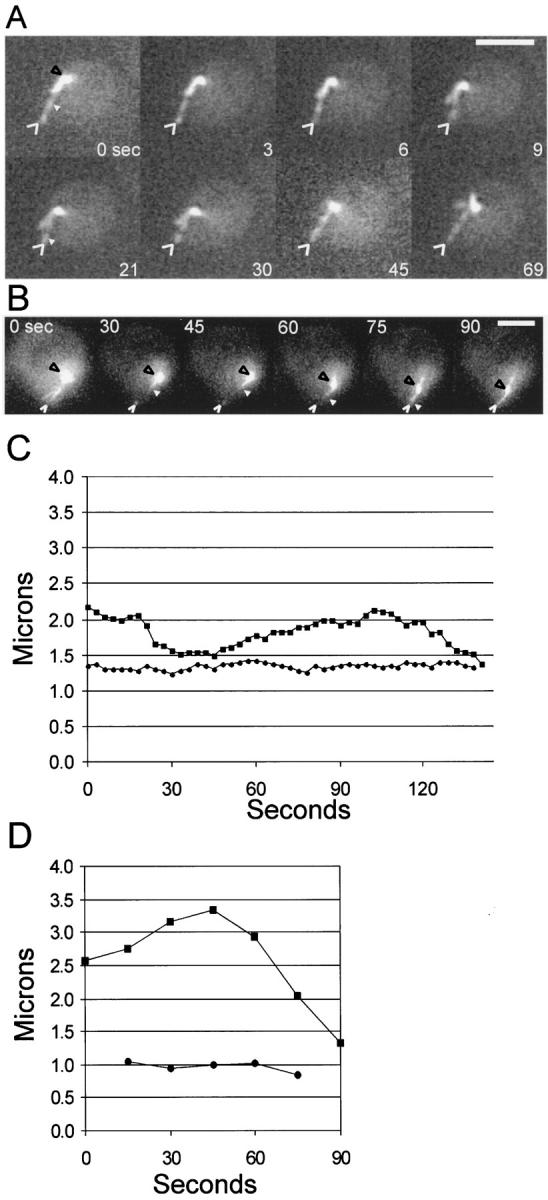
Shmoo tip Mt bundles dynamically grow and shorten at their plus ends. (A) A shmooing haploid cell containing GFP–tubulin. Fluorescent speckles (see text) are visible (white arrowhead) in the shmoo tip Mt bundle. Black arrowheads point to the SPB and the open white arrowheads point to the shmoo tip. Eight images are shown from a time-lapse sequence of 3-s intervals. (B) Photomarking of the shmoo tip Mt bundle. A photobleached mark was made using the 488-nm line from an argon laser as described in the text. Shown are six images (processed as described in the text). Black arrowhead points to the SPB, white arrowhead points to the edge of the mark closest to the SPB, and the open white arrowhead points to the shmoo tip. The laser was targeted midway between the white arrowhead and the open white arrowhead. (C) Graph of the distance of shmoo tip and the FSM (see text) fiduciary mark seen in (A, small arrowhead in 0- and 21-s frames) relative to the SPB over time. Squares represent the distance between the SPB and the shmoo tip, whereas circles represent distance from the SPB to the fluorescent speckle. (D) Graph of relative movements in B. Squares represent the distance between the SPB and the shmoo tip, circles show the distance between the SPB and the edge of the mark (small white arrowhead in B). Bars: (A) 2 μm; (B) 3 μm.
We have also examined the behavior of astral Mts when mating pheromone, α factor, was added to the medium to induce shmoo formation. In contrast to mating cells, high concentrations of α factor in the medium induce a default mating response (Dorer et al., 1997; Schrick et al., 1997). In α factor–treated cells, astral Mts mainly oriented toward the preshmoo and shmoo tip, and exhibited assembly behavior as in mating cells. The total number of astral Mts was not noticeably different from mating cells, but a larger fraction of astral Mts, often two or three, were not attached to and/or grew away from the shmoo tip (20% more free Mts as determined by fluorescence intensity, n = 15 cells for each condition). Miller and Rose (1998) and Read et al. (1992) reported similar results in fixed preparations for α factor–treated cells. Thus, α factor–treated cells appear to have less robust Mt attachment complexes at their shmoo tips relative to untreated mating cells.
Shortening and Growth of the Shmoo Tip Mt Bundle Is Coupled to Nuclear Movement Toward and Away from the Tip
Maintenance of the shmoo tip Mt bundle to the shmoo tip plays a critical role in mating efficiency (Miller and Rose, 1998; for review see Marsh and Rose, 1997). We discovered that the bundle of Mts is dynamic. The SPB and attached nucleus oscillated toward and away from the shmoo tip as the attached bundle of Mts shortened and grew (Fig. 4). The velocities of SPB moving toward and away from the shmoo tip (Fig. 4 A) were 0.5 ± 0.27 μm/ min (n = 24). These rates are similar to those measured for nonshmoo tip Mts in mating cells and astral Mts in vegetative cells (Table I) (Carminati and Sterns, 1997; Shaw et al., 1997b). Switching of the shmoo tip Mt bundle from growth to shortening (catastrophe) was accompanied by SPB and nuclear movement toward the shmoo tip (Fig. 4 B) and occurred at similar frequencies to that of free end astral Mts (0.25/min, Table I). Shmoo tip Mt bundle switching from shortening to growth (rescue) resulted in SPB and nuclear movement away from the shmoo tip (Fig. 4 B) and occurred at a similar frequency to catastrophe (Table I). Bundles never shortened completely and disappeared. The shmoo tip Mt bundle grew and shortened without detaching from either the shmoo tip or SPB. We could not determine whether all Mts in the bundle were attached to the shmoo tip because of limitations in resolution. Regardless, Mt bundle attachment to the shmoo tip and/or the SPB must be a dynamic attachment.
Astral Mts Attached to the Shmoo Tip Grow and Shorten Primarily at the Shmoo Tip
To determine the sites of assembly and/or disassembly of the shmoo tip Mt bundle, we used two methods to produce fluorescent fiduciary marks within shmoo tip Mts. These experiments required the use of GFP–tubulin, which incorporates into the Mt lattice, instead of dynein–GFP, which decorates the outside of Mts and presumably can exchange with cytosolic dynein–GFP (Figs. 2 and 6). FSM (Waterman-Storer et al., 1998) and fluorescence photobleaching of Mts containing GFP–tubulin were used to produce fiduciary marks in the Mt bundle (see Materials and Methods). For FSM, haploid cells expressing low levels of GFP–tubulin were observed in the early stages of mating and shmoo formation. Clear speckles (fiduciary marks) of bright and dark fluorescence intensity along the shmoo tip Mt bundles were observed by time-lapse imaging (Fig. 5 A). In nine out of nine examples, fluorescent speckles did not exhibit any apparent net movement relative to the pole over the course of time-lapse acquisitions (Fig. 5, A and C). Speckles were seen to disappear and reappear at the shmoo tip end of the Mt bundle as the bundle shortened (Fig. 5 A, time points 0–9) and elongated (Fig. 5 A, time points 21–69). Similar results were seen for Mts marked by laser photobleaching (Fig. 5, B and D).
Figure 6.
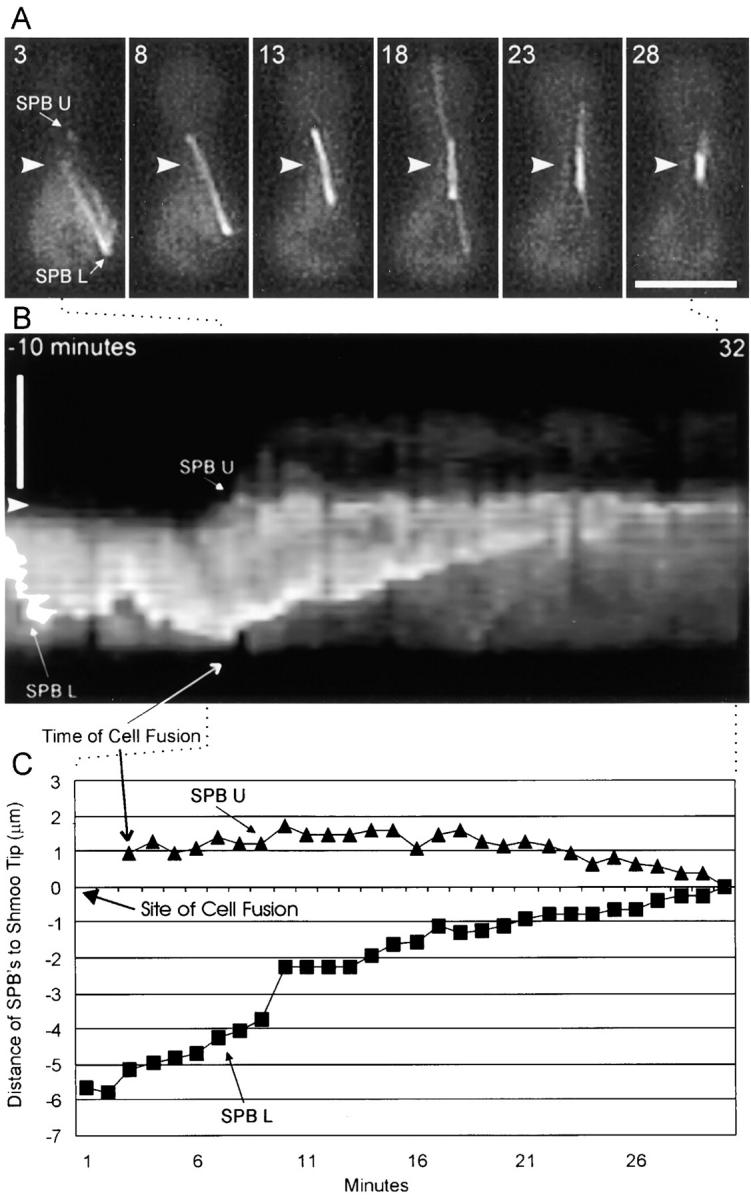
Cell fusion and Mt-mediated SPB congression during the mating process. (A) Six time points are shown at 5-min intervals of dynein–GFP. The 3-min time point shows a mating pair as cell fusion is occurring. The SPBs from both cells (SPB of the nonexpressing partner cell is SPB U and SPB of the dynein–GFP expressing cell is SPB L) are visible. Only the bottom cell contained dynein–GFP before membrane fusion. Arrowhead marks the CWS in A and B as seen in corresponding DIC images (data not shown). (B) Kymograph made by taking a 4-pixel wide linescan over time along the long axis of the mating cells. The linescan was placed along the overlapping Mt bundle in frame 8 and spanned the entire frame. The orientation and length of the linescan was constant for each frame. The cells are in the same orientation as in A. Time proceeds from −10 min to 32 min (left to right) with reference to the graph in C. Arrowhead indicates site of CWS (as in A). Intensity fluctuations seen in the kymograph are mainly due to lateral movement of the bundle away from the linescan over time. (C) Graph of the distance of SPB U (triangles) and SPB L (squares) to the cell wall septum (0 on the y-axis). Before cell fusion, only SPB L was visible. Dotted lines connecting A and C to B approximate what portions of the kymograph are represented in A and C. Bars, 5 μm.
Fiduciary mark movement observations were confirmed by measurements of the position of fluorescent marks (measured at the center of a speckle for FSM and the edge of laser photobleached marks closest to the SPB) relative to the center of the SPB image (Fig. 5, C and D). Straight lines were fit through mark-to-SPB measurements over time by the least squares method. A best-fit line with a slope of zero would indicate no net change in distance between the mark and SPB over time, i.e., a rate of 0 μm/ min. The average slope of the lines through the data was near zero: an average of 0.034 ± 0.069 μm/min (n = 9) for speckle data and −0.048 ± 0.036 μm/min (n = 5) for photomarking data (Table II). Fluctuations of individual measurements about the best-fit lines, calculated by root mean square, were 0.169 μm for FSM data and 0.073 μm for photobleaching data (Table II). Although we cannot exclude the possibility of small units of assembly/disassembly at the SPB, these fluctuations most likely represent the limit of accuracy in measurement of the position of the fiduciary marks relative to the SPB. During time-lapse image acquisition, the SPB and shmoo tip Mts moved laterally and in and out of the plane of focus. In addition, observed fluctuations are less than the 0.25 μm limit of lateral resolution (for 514 nm of light, Salmon et al., 1998). Thus, slight shifts in focus could change the apparent position of the marks and the center of the SPB, producing the fluctuations observed. Taken together, these measurements indicate that there was little or no Mt assembly or disassembly at the SPB. Therefore, the great majority or all changes in Mt length occurred by assembly/disassembly at the shmoo tip.
Table II.
Statistical Analysis of Fluorescent Fiduciary Mark Movement Relative to the SPB
| Slope | Fluctuation (RMS) | Total time | Number of samples | |||||
|---|---|---|---|---|---|---|---|---|
| FSM | 0.034 ± 0.069 | 0.169 | 10.8 | 9 | ||||
| Bleaching | −0.048 ± 0.036 | 0.073 | 6.25 | 5 |
Cell Fusion Induces Slow Shortening of the Internuclear Bundles of Mts Whereas Nonbundle Astral Mts Often Grow Much Longer
To analyze Mt dynamics during karyogamy, cells expressing dynein–GFP were mated to cells without dynein–GFP and observed by time-lapse imaging. Cell fusion was visualized in DIC by the loss of the cell wall septum (CWS) where the two shmoo tips had touched, and in fluorescence by movement of cytoplasmic fluorescence from a cell expressing dynein–GFP into a nonexpressing partner cell. As this movement occurred, dynein–GFP was seen to redistribute to the SPB and astral Mts of the nonexpressing partner cell. Thus, there is a freely diffusible pool of cytoplasmic dynein–GFP relative to dynein-binding sites at the SPB or along astral Mts (Fig. 6). Upon cell fusion, oscillations of the SPBs and nuclei became attenuated and the nuclei slowly moved together concurrent with shortening of the internuclear Mt bundle (Fig. 6). From 12 different experiments, the average rate of SPB congression was 0.2 ± 0.07 μm/min.
The nuclei did not move equal distances to the midpoint position between the two nuclei at the time of cell fusion. Such bilateral movement would be expected from force generation via overlapping Mts. Instead, each SPB and nucleus moved to the site of cell fusion as the Mt bundle shortened and sometimes oscillated back and forth. As seen in Fig. 6, when one SPB (SPB L in this case) was farther away from the site of cell fusion than the partner SPB (SPB U), the karyogamy event was not bilaterally symmetric. SPB U was close to the CWS and remained in place while SPB L moved ∼5 μm to the site of cell fusion.
Free-end astral Mts facing the site of cell fusion often were seen to grow past the opposing nucleus to the distal reaches of the partner cell (Figs. 2 and 6). Free ends of these extended Mts exhibited dynamic instability. Astral Mts in zygotes were on average longer than those seen in vegetative cultures (Table I) (Carminati and Sterns, 1997; Shaw et al., 1997). Carminati and Sterns (1997) proposed that catastrophe is induced when Mts contact the cell cortex, therefore the increase in length could be a result of greater distance between the SPB and the cortex in zygotes. Long Mts were also often seen to bend or buckle as they grew or traversed the cellular periphery. However, astral Mt growth did not result in a detectable change in position of the nuclei and/or the SPBs, and the spindle poles remained oriented toward each other. In contrast, astral Mts were rarely seen to extend from a SPB back into the periphery of its original cell, indicating each SPB orients new Mt growth in the direction faced by the majority of its Mts.
Bud Emergence Coincides with the Position of the SPB
At the end of karyogamy the zygotic diploid nucleus forms by nuclear and SPB fusion (for review see Marsh and Rose, 1997). In our DIC time-lapse images, the bud emerged at the position of the SPB. This is in contrast to the situation in vegetative mitosis, where astral Mt search and capture mechanism is used to position the SPB and nucleus toward the neck of the bud (Shaw et al., 1997b). In 10 out of 14 cells, the SPB remained localized to the site of cell fusion. In four out of 14 cells the SPB moved away from the site of cell fusion (data not shown). In all cases bud emergence coincided with the position of the SPB (Fig. 2, time point 34). This result is consistent with the findings of Byers (1981), who centrifuged zygotes before bud emergence to dislodge cytoplasmic and nuclear structures. The bud emerged from the site proximal to the position of the displaced SPB and nucleus.
SPB and Spindle Kinetics during First Mitosis Are Linear from Initial SPB Separation to Telophase
The use of GFP probes (dynein–GFP, GFP–tubulin, or Nuf2–GFP) allowed a kinetic analysis of events in the first diploid mitosis. Two major differences were observed in the first division versus vegetative mitosis. First was the ability of each SPB to acquire cytoplasmic dynein immediately after SPB separation. In vegetative cells, there is a temporal delay in the acquisition of dynein–GFP (and presumably astral Mts) to one of the SPBs after separation. This delay may be coupled to the Mt-based search and capture process that ensures one and only one SPB orienting toward the bud (Shaw et al., 1997b). In the first zygotic division, there was no temporal lag of dynein–GFP decorating each SPB after their separation. When two spots were distinctly visible (0.5 μm of separation), the fluorescence intensity of dynein–GFP was equal at both poles (Fig. 7). The fluorescence intensity of Nuf2p–GFP (Fig. 8) and GFP–tubulin at each SPB was also equal after their separation (data not shown). Since our cell fusion data between cells expressing dynein–GFP and nonexpressing cells showed that free pools of cytoplasmic dynein–GFP are available (Fig. 6), there must be a mechanism that prevents one SPB from immediately acquiring cytoplasmic dynein in vegetative mitosis. The strategies for Mt nucleation from SPBs in zygotic division are therefore distinct from vegetative cycles.
Figure 7.

Anaphase of the first zygotic division occurs without a pause at the 1–2 μm stage of spindle elongation. (A) Overlay of Nuf2–GFP (arrows point to separated poles as seen by Z series analysis) and DIC in a zygote undergoing mitosis for the first time after diploid formation. Time in min is shown in the upper left corner of each panel. (B) Graph of spindle elongation in the zygote shown in A as compared with spindle elongation in vegetative mitosis (images not shown). See Fig. 9 for statistical information. Bar, 3 μm.
Figure 8.

Dynein–GFP decorates both SPBs immediately after SPB separation. (A) Sequential projection images at 1-min intervals of dynein–GFP fluorescence during SPB separation of the first division after zygote formation. (B) Graph showing linescans through the axis of the spindle in each of the frames shown in A. The scale on the z axis is arbitrary fluorescence units. Frame three appears as one SPB because of rotation of the spindle axis placing the two SPBs in the same x, y position, but separated in z by ∼1 μm. Bar, 2 μm.
Secondly, once the SPBs began to separate, they became aligned along the bud tip–neck axis and, after a few minutes of delay (6 ± 2 min, n = 10) at a distance of 0.5–1 μm, there was a linear progression in spindle elongation (0.75 ± 0.3 μm/min, n = 10) to a 10–12-μm spindle characteristic of telophase. The velocity of spindle elongation was similar to that of the initial phase of anaphase spindle elongation in wild-type vegetative cells (Yeh et al., 1995). In Fig. 8, data for Nuf2p–GFP is shown; velocities from dynein–GFP and GFP–tubulin were similar. In contrast to this first zygotic mitosis, the preanaphase spindle (1–1.5 μm) persists for at least 20 min (Fig. 8 B) (Yeh et al., 1995) in the vegetative growth cycle. The graphs in Fig. 8 B begin when two spindle poles in each case were clearly resolvable and continue until the first rapid stage of anaphase was completed. In the first zygotic division after mating, the entire time from spindle pole separation to the initiation of anaphase spindle elongation was less than 6 min. This is much shorter than the 20-min period during mitosis in vegetative cells (Fig. 8 B and Fig. 9).
Figure 9.

The timing of events during the mating process through karyogamy and first division in wild-type cells. The stages are: (a) cell fusion, (b) SPB fusion, (c) bud emergence, (d) SPB separation, (e) anaphase onset, and (f) cell separation. The elapsed times are averages with standard deviations of n observations of each stage.
Fig. 9 shows the kinetics of the major stages of the mating pathway (Fig. 1). These results extend from the time of cell fusion to cytokinesis during the first cell division. Time of shmoo formation could not be accurately assessed due to the subtle nature of the early shmoo when viewed by DIC. The entire process took 179 ± 34 min (n = 3).
Discussion
Mt Orientation to the Shmoo Tip Occurs by a Search and Capture Mechanism and Results in Mt Dynamic Attachment
Our results show that localization of the nucleus to the preshmoo or shmoo tip occurs via Mt growth and shortening in a random search and capture process much as described for vegetative G1 cells (Fig. 3) (Shaw et al., 1997b). Once astral Mts encounter the shmoo tip, subsequent Mt growth results in formation of a shmoo tip Mt bundle that tethers the SPB and nucleus to the shmoo tip. The shmoo tip Mt bundle remains dynamic and represents a new model system to study mechanistic aspects of dynamic Mt attachments. The velocities of oscillatory movements of the SPB and nucleus toward and away from the shmoo tip equal the intrinsic growth and shortening velocities of free Mts. Thus, the shmoo tip is able to maintain an association with Mt ends without compromising Mt dynamics. The fluorescent intensity of the shmoo tip bundle allowed us to use photomarking experiments and fluorescence speckle microscopy to determine which end of the Mt was active in subunit addition and subtraction. The plus end (the end at the shmoo tip) was the main site of Mt bundle growth and shortening (Fig. 5). Therefore, at least one Mt plus end was dynamically attached to the shmoo tip at any given time, otherwise there would have been detachment and loss of the bundle during oscillations.
Dynamic attachments are a specialized means for harnessing Mt plus end growth and shortening to produce force needed for cellular processes. One well-studied correlative to the shmoo tip–Mt interaction is kinetochore dynamic attachment and movement along polar spindle Mts in vertebrate tissue cells. After attachment to plus ends of polar Mts, kinetochores oscillate toward and away from the pole, coupled to shortening and growth of their kinetochore fiber Mts mainly at the kinetochore (Skibbens et al., 1993, 1995; for review see Rieder and Salmon, 1998). Kinetochores in budding yeast can also oscillate relative to their poles (Guacci et al., 1997; Straight et al., 1997), but little is yet known about kinetochore Mt dynamic attachments. The dynamic Mt tip attachment complexes (Fig. 10) at the shmoo tip described herein may be functionally similar to the dynamic attachment of kinetochores to spindle Mts in tissue cells (Rieder and Salmon, 1998). Both kinetochores and shmoo tips exhibit multiple dynamic Mt attachments. In the case of the kinetochore, kinetochore Mts apparently polymerize/depolymerize in concert, resulting in oscillatory movement of the kinetochore and associated chromosome away or toward the spindle pole. How this is regulated is not yet known (for review see Rieder and Salmon, 1998). A similar mechanism could be acting at the shmoo tip, where multiple Mts polymerize/ depolymerize coordinately, moving the SPB and attached nucleus away and towards the shmoo tip. Identification of shmoo tip molecules required for anchoring Mt plus ends may therefore provide fundamental insights on the mechanistic bases of dynamic attachments.
Figure 10.

Enlarged view of a prezygotic mating cell after the nucleus has become tethered to the shmoo tip by a bundle of astral Mts. PM, plasma membrane; SPB, spindle pole body; Mt, microtubule. Small arrows indicate assembly/disassembly at the plus ends of the bundle of astral Mts.
What are the molecules in the shmoo tip Mt dynamic attachment complex? Candidates must (a) localize to the shmoo tip, (b) bind dynamically growing and shortening Mt plus ends, and (c) link structural factors (such as actin) at the shmoo tip to Mt plus ends. Examples of the many proteins that localize to the shmoo tip include Bni1p, a member of the formin protein family (Evangelista et al., 1997) and a putative cortical protein, Kar9p (Miller and Rose, 1998). In particular, mutations in Kar9p and the Mt-binding protein Bim1p (Schwartz et al., 1997; also known as Yeb1p [Muhua et al., 1998] and Mal3p [Beinhauer et al., 1997]) have been shown to disrupt Mt localization to the shmoo tip without visibly affecting shmoo formation (Miller and Rose, 1998; Schwartz et al., 1997). It is not known whether these proteins are involved directly in Mt attachment (Kar9p), Mt dynamics (Bim1p), or indirectly (Bni1p) by linking Mt attachment complexes to actin. In vertebrate kinetochores, Mt motor proteins are thought to couple kinetochores to dynamic Mt plus ends (for review see Inoue and Salmon, 1995; Rieder and Salmon, 1998). Kar3p is a candidate for this job since it is a minus motor localized to astral Mts in the shmoo and the only known motor protein required for karyogamy (Meluh and Rose, 1990; for review see Marsh and Rose, 1997).
New Features of Karyogamy
Time-lapse imaging of cell fusion and karyogamy revealed that nuclei do not simply move toward one another, but meet at the site of cell fusion. One explanation for this observation is that the septum aperture is too small (∼1.1 μm at time of cell fusion [Gammie et al., 1998]) to allow nuclei to pass through, therefore the two nuclei fuse at the site of cell fusion. However, the diameter of the mother–bud neck during anaphase is also ∼1 μm (Bi et al., 1998) and does not seem to inhibit nuclear movement. Alternatively, the site of cell fusion may provide a landmark for subsequent events. Mt plus ends that were contained within the bundle of Mts between nuclei shortened as the nuclei moved to the site of cell fusion, whereas those not in the bundle grew past the nucleus to the end of the opposite cell where their plus ends exhibited dynamic instability. Perhaps the shmoo tip Mt attachment molecules persist in their attachment to Mt plus ends after cell fusion and these complexes are involved in maintaining bundle formation and producing or regulating Mt disassembly and nuclear movement. Our kinetic analysis shows that the nuclei move together as the bundle of Mts shortens at rates much slower (0.2 μm/min) than the in vitro translocation velocity of Kar3p (1–2 μm/min; Endow et al., 1994; Middleton and Carbon, 1994). This slow rate does not exclude a role for Kar3p in pulling together interdigitating Mts from each haploid nucleus. However, karyogamy is clearly not limited by the rate of motor activity, but appears more tightly coupled to mechanisms that regulate Mt bundle disassembly.
Meluh and Rose (1990) proposed that at cell fusion, plus end Mt dynamics are stabilized whereas Kar3p, acting at the SPBs, induces minus end disassembly therefore drawing the SPBs to the site of cell fusion. Our kinetic data is consistent with but does not prove this idea. After fusion, oscillations in the length of the Mt bundles (Fig. 4) ceased as if Mt plus end dynamics were stabilized (Fig. 6 C). Bundle shortening occurred at ∼0.2 μm/min. This rate is consistent with the predicted rate of Kar3p depolymerization of minus ends located at the SPBs based on the observed rate of Kar3p depolymerization of taxol stabilized Mt minus ends in vitro (0.1 μm/min, Endow et al., 1994). Kar3p depolymerizing Mt minus ends at a rate of 0.1 μm/min at both poles would indeed yield a karyogamy rate of 0.2 μm/ min. However, we did not detect any astral Mt minus end assembly/disassembly at the SPB before cell fusion.
First Mitosis Has Important Differences Relative to Vegetative Mitosis
We have compared the kinetics of mitotic SPB separation and spindle elongation in zygotes versus vegetative cells (Kahana et al., 1995; Yeh et al., 1995; Shaw et al., 1997b; Straight et al., 1997). The kinetics of Mt nucleation from separated SPBs, as well as the rate of spindle elongation in the first zygotic division reported herein are remarkably distinct from vegetative mitosis. As observed by Shaw et al. (1997b), dynein–GFP is delayed in decorating the SPB destined to the mother cell in vegetative mitotic cells. Since we now know that there is a freely diffusible pool of dynein–GFP (Fig. 6), it is now more certain that the absence of dynein–GFP at the spindle pole reflects a temporal delay in acquisition. This delay was hypothesized to promote spindle orientation along the mother–bud axis, and unity in pole deposition into the bud (Shaw et al., 1997b). In the first zygotic division (Figs. 7 and 8), two poles are detectable by dynein–GFP with the same kinetics as Nuf2p–GFP (no delayed acquisition in vegetative growth; Kahana et al., 1995; Shaw et al., 1997b). Since bud emergence coincides with the position of the SPB, the need for search and capture is obviated. These differences in Mt nucleation and nuclear movement are the first indications that regulatory aspects of the zygotic division are not equivalent to those found in vegetative growth.
Analysis of spindle elongation kinetics (Fig. 7) illustrates the third substantial difference in the regulation of zygotic mitosis relative to vegetative cells. As soon as the SPBs can be resolved, they become oriented along the bud tip–neck axis. As the poles align along this axis, spindle elongation ensues, unlike the vegetative cycle where the 2-μm spindle persists for ∼20 min (Yeh et al., 1995); the 2-μm stage of spindle morphogenesis in the zygote is very short lived. Once spindle elongation begins, it occurs with linear kinetics (0.75 μm/min) until the SPBs reach the distal ends of the mother and first bud.
The kinetics of spindle elongation and seeming lack of time spent at the 2-μm spindle stage may reflect, in part, the fate of proteins at the shmoo tip. One intriguing possibility is that proteins at the two shmoo tips form a midshmoo body, analogous to the midbody in tissue cells. In this scenario, proteins from the shmoo tip, which are also markers of bud site selection, accumulate at the interdigitating Mts (midbody). This hypothesis provides a mechanism by which the position of the SPB directs the position of the first bud. Such a mechanism may obviate the requirement for a search and capture mechanism using Mt growth dynamics to find the bud. In evolutionary terms, bypassing the search and capture process expedites the cell's ability to form a diploid population, and therefore alleviate the need for certain cell cycle checkpoints.
The above results illustrate that the first zygotic division in yeast is distinct from vegetative mitosis. Kinetic analysis of mating and the ability to monitor Mt dynamics throughout the entire mating process reveals a new model system for studying Mt plus end interactions with cellular structures, and cell division in budding yeast that is analogous to early embryonic divisions of larger eukaryotes, such as the frog Xenopus laevis. The question that remains is why early embryonic divisions, now from the first zygotic division in yeast to the thousands of divisions in a mammalian blastula, dispense with mitotic controls that are prominent in vegetative cells and the cells of our body.
Acknowledgments
The authors would like to thank T.J. Mitchison (Harvard Medical School, Boston, MA) for assistance and support in photobleaching experiments. P.S. Maddox would like to thank A. Desai (Harvard Medical School), S. Shaw (Stanford University), P. Tran (Columbia University, New York), J. Waters (Wake Forest University, Winston-Salem, NC), C. Waterman-Storer, B. Howell, J. Canman, A. Shaub, and D. Beach (University of North Carolina at Chapel Hill, NC) for help along the way, and A. Straight (Harvard Medical School) for the generous gift of GFP– tubulin.
This work was supported by National Institutes of Health grants to E.D. Salmon (GM 24364) and K.S. Bloom (GM 32238).
Abbreviations used in this paper
- CWS
cell wall septum
- DIC
differential interference contrast
- FSM
fluorescence speckle microscopy
- GFP
green fluorescent protein
- Mt
microtubule
- SPB
spindle pole body
Footnotes
Address correspondence to P. Maddox, Department of Biology, CB3280, University of North Carolina, Chapel Hill, NC 27599-3280. Tel.: (919) 962-2354. Fax: (919) 962-1625. E-mail: pmaddox@email.unc.edu
References
- Beinhauer JD, Hagan IM, Hegemann J, Fleig U. Mal3, the fission yeast homologue of the human APC-interacting protein EB-1 is required for microtubule integrity and the maintenance of the cell form. J Cell Biol. 1997;139:717–728. doi: 10.1083/jcb.139.3.717. [DOI] [PMC free article] [PubMed] [Google Scholar]
- Bi E, Maddox P, Lew DJ, Salmon ED, McMillan JN, Yeh E, Pringle JR. Involvement of an actomyosin contractile ring in Saccharomyces cerevisiaecytokinesis. J Cell Biol. 1998;142:1301–1312. doi: 10.1083/jcb.142.5.1301. [DOI] [PMC free article] [PubMed] [Google Scholar]
- Brinkley RR. Microtubule organizing centers. Ann Rev Cell Biol. 1985;1:145–172. doi: 10.1146/annurev.cb.01.110185.001045. [DOI] [PubMed] [Google Scholar]
- Byers, B. 1981. Cytology of the yeast life cycle. In The Molecular Biology of the Yeast Saccharomyces: Life Cycle and Inheritance. J. Strachern, E.W. Jones, and J.R. Broach, eds. Cold Spring Harbor Laboratory Press, Cold Spring Harbor, NY. 59–96.
- Byers B, Goetsch L. Behavior of spindles and spindle plaques in the cell cycle and conjugation of Saccharomyces cerevisiae. . J Bacteriol. 1975;124:511–523. doi: 10.1128/jb.124.1.511-523.1975. [DOI] [PMC free article] [PubMed] [Google Scholar]
- Carminati JL, Stearns T. Microtubules orient the mitotic spindle in yeast through dynein-dependent interactions with the cell cortex. J Cell Biol. 1997;138:629–641. doi: 10.1083/jcb.138.3.629. [DOI] [PMC free article] [PubMed] [Google Scholar]
- Delgado MA, Conde J. Benomyl prevents nuclear fusion in Saccharomyces cerevisiae. . Mol Gen Genetics. 1984;193:188–189. doi: 10.1007/BF00327435. [DOI] [PubMed] [Google Scholar]
- Dorer R, Boone C, Kimbrough T, Kim J, Hartwell LH. Genetic analysis of default mating behavior in Saccharomyces cerevisiae. . Genetics. 1997;146:39–55. doi: 10.1093/genetics/146.1.39. [DOI] [PMC free article] [PubMed] [Google Scholar]
- Endow SA, Kang SJ, Satterwhite LL, Rose MD, Skeen VP, Salmon ED. Yeast Kar3 is a minus-end microtubule motor protein that destabilizes microtubules preferentially at the minus ends. EMBO (Eur Mol Biol Organ) J. 1994;13:2708–2713. doi: 10.1002/j.1460-2075.1994.tb06561.x. [DOI] [PMC free article] [PubMed] [Google Scholar]
- Evangelista M, Blundell K, Longtine MS, Chow CJ, Adames N, Pringle JR, Peter M, Boone C. Bni1p, a yeast formin linking Cdc42p and the actin cytoskeleton during polarized morphogenesis. Science. 1997;276:118–122. doi: 10.1126/science.276.5309.118. [DOI] [PubMed] [Google Scholar]
- Gammie AE, Brizzio V, Rose MD. Distinct morphological phenotypes of cell fusion mutants. Mol Biol Cell. 1998;9:1395–1410. doi: 10.1091/mbc.9.6.1395. [DOI] [PMC free article] [PubMed] [Google Scholar]
- Guacci V, Koshland D, Strunnikov A. A direct link between sister chromatid cohesion and chromosome condensation revealed through the analysis of MCD1 in S. cerevisiae. . Cell. 1997;91:47–57. doi: 10.1016/s0092-8674(01)80008-8. [DOI] [PMC free article] [PubMed] [Google Scholar]
- Hasek J, Rupes I, Svobodova J, Streiblova E. Tubulin and actin topology during zygote formation of Saccharomyces cerevisiae. . J Gen Microbiol. 1987;133:3355–3363. doi: 10.1099/00221287-133-12-3355. [DOI] [PubMed] [Google Scholar]
- Inoue S, Salmon ED. Force generation by microtubule assembly disassembly in mitosis and related movements. Mol Biol Cell. 1995;6:1619–1640. doi: 10.1091/mbc.6.12.1619. [DOI] [PMC free article] [PubMed] [Google Scholar]
- Kahana JA, Schnapp BJ, Silver PA. Kinetics of spindle pole body separation in budding yeast. Proc Natl Acad Sci USA. 1995;92:9707–9711. doi: 10.1073/pnas.92.21.9707. [DOI] [PMC free article] [PubMed] [Google Scholar]
- Marsh, L., and M. Rose. 1997. The pathway of cell and nuclear fusion during mating in S. cerevisiae. In The Molecular and Cellular Biology of the Yeast Saccharomyces. J.R. Pringle, J.R. Broach, and E.W. Jones, eds. Cold Spring Harbor Laboratory Press, Cold Spring Harbor, NY. 827–888.
- Meluh PB, Rose MD. KAR3, a kinesin-related gene required for yeast nuclear fusion. Cell. 1990;60:1029–1041. doi: 10.1016/0092-8674(90)90351-e. [DOI] [PubMed] [Google Scholar]
- Middleton K, Carbon J. KAR3-encoded kinesin is a minus-end-directed motor that functions with centromere binding proteins (CBF3) on an in vitro yeast kinetochore. Proc Natl Acad Sci USA. 1994;91:7212–7216. doi: 10.1073/pnas.91.15.7212. [DOI] [PMC free article] [PubMed] [Google Scholar]
- Miller RK, Rose MD. Kar9p is a novel cortical protein required for cytoplasmic microtubule orientation in yeast. J Cell Biol. 1998;140:377–390. doi: 10.1083/jcb.140.2.377. [DOI] [PMC free article] [PubMed] [Google Scholar]
- Muhua L, Adames NR, Murphy MD, Shields CR, Cooper JA. A cytokinesis checkpoint requiring the yeast homologue of an APC-binding protein. Nature. 1998;393:487–491. doi: 10.1038/31014. [DOI] [PMC free article] [PubMed] [Google Scholar]
- Read EB, Okamura HH, Drubin DG. Actin-and tubulin-dependent functions during Saccharomyces cerevisiaemating projection formation. Mol Biol Cell. 1992;3:429–444. doi: 10.1091/mbc.3.4.429. [DOI] [PMC free article] [PubMed] [Google Scholar]
- Rieder CL, Salmon ED. The vertebrate cell kinetochore and its roles during mitosis. Trends Cell Biol. 1998;8:310–318. doi: 10.1016/s0962-8924(98)01299-9. [DOI] [PMC free article] [PubMed] [Google Scholar]
- Rose MD, Fink GR. KAR1, a gene required for function of both intranuclear and extranuclear microtubules in yeast. Cell. 1987;48:1047–1060. doi: 10.1016/0092-8674(87)90712-4. [DOI] [PubMed] [Google Scholar]
- Salmon ED, Inoue T, Desai A, Murray AW. High resolution multimode digital imaging system for mitosis studies in vivo and in vitro. Biol Bull. 1994;187:231–232. doi: 10.1086/BBLv187n2p231. [DOI] [PubMed] [Google Scholar]
- Salmon ED, Shaw SL, Waters J, Waterman-Storer CM, Maddox PS, Yeh E, Bloom K. A high-resolution multimode digital microscope system. Methods Cell Biol. 1998;56:185–215. [PMC free article] [PubMed] [Google Scholar]
- Saunders W, Hornack D, Lengyel V, Deng C. The Saccharomyces cerevisiaekinesin-related motor Kar3p acts at preanaphase spindle poles to limit the number and length of cytoplasmic microtubules. J Cell Biol. 1997;137:417–431. doi: 10.1083/jcb.137.2.417. [DOI] [PMC free article] [PubMed] [Google Scholar]
- Schrick K, Garvik B, Hartwell LH. Mating in Saccharomyces cerevisiae: the role of the pheromone signal transduction pathway in the chemotropic response to pheromone. Genetics. 1997;147:19–32. doi: 10.1093/genetics/147.1.19. [DOI] [PMC free article] [PubMed] [Google Scholar]
- Schwartz K, Richards K, Botstein D. BIM1 encodes a microtubule-binding protein in yeast. Mol Biol Cell. 1997;8:2677–2691. doi: 10.1091/mbc.8.12.2677. [DOI] [PMC free article] [PubMed] [Google Scholar]
- Shaw SL, Yeh E, Bloom K, Salmon ED. Imaging green fluorescent protein fusion proteins in Saccharomyces cerevisiae. . Curr Biol. 1997a;7:701–704. doi: 10.1016/s0960-9822(06)00299-5. [DOI] [PubMed] [Google Scholar]
- Shaw SL, Yeh E, Maddox P, Salmon ED, Bloom K. Astral microtubule dynamics in yeast: a microtubule-based searching mechanism for spindle orientation and nuclear migration into the bud. J Cell Biol. 1997b;139:985–994. doi: 10.1083/jcb.139.4.985. [DOI] [PMC free article] [PubMed] [Google Scholar]
- Skibbens RV, Skeen VP, Salmon ED. Directional instability of kinetochore motility during chromosome congression and segregation in mitotic newt lung cells: a push-pull mechanism. J Cell Biol. 1993;122:859–875. doi: 10.1083/jcb.122.4.859. [DOI] [PMC free article] [PubMed] [Google Scholar]
- Skibbens RV, Rieder CL, Salmon ED. Kinetochore motility after severing between sister centromeres using laser microsurgery: evidence that kinetochore directional instability and position is regulated by tension. J Cell Sci. 1995;108:2537–2548. doi: 10.1242/jcs.108.7.2537. [DOI] [PubMed] [Google Scholar]
- Straight AF, Marshall WF, Murray AW. Mitosis in living budding yeast: anaphase A but no metaphase plate. Science. 1997;277:574–578. doi: 10.1126/science.277.5325.574. [DOI] [PubMed] [Google Scholar]
- Vallen EA, Hiller MA, Scherson TY, Rose MD. Separate domains of KAR1 mediate distinct functions in mitosis and nuclear fusion. J Cell Biol. 1992;117:1277–1287. doi: 10.1083/jcb.117.6.1277. [DOI] [PMC free article] [PubMed] [Google Scholar]
- Wadsworth P, Salmon ED. Analysis of the treadmilling model during metaphase of mitosis using fluorescence redistribution after photobleaching. J Cell Biol. 1986;102:1032–1038. doi: 10.1083/jcb.102.3.1032. [DOI] [PMC free article] [PubMed] [Google Scholar]
- Waterman-Storer CM, Salmon ED. How microtubules get fluorescent speckles. Biophys J. 1998;75:2059–2069. doi: 10.1016/S0006-3495(98)77648-9. [DOI] [PMC free article] [PubMed] [Google Scholar]
- Waterman CM, Desai A, Bulinski JC, Salmon ED. Fluorescent speckle microscopy, a method to visualize the dynamics of protein assemblies in living cells. Curr Biol. 1998;8:1227–1230. doi: 10.1016/s0960-9822(07)00515-5. [DOI] [PubMed] [Google Scholar]
- Yeh E, Skibbens RV, Cheng JW, Salmon ED, Bloom K. Spindle dynamics and cell cycle regulation of dynein in the budding yeast, Saccharomyces cerevisiae. . J Cell Biol. 1995;130:687–700. doi: 10.1083/jcb.130.3.687. [DOI] [PMC free article] [PubMed] [Google Scholar]