

Abstract
Individual chromosomes are not directly visible within the interphase nuclei of most somatic cells; they can only be seen during mitosis. We have developed a method that allows DNA strands to be observed directly in living cells, and we use it to analyze how mitotic chromosomes form. A fluorescent analogue (e.g., Cy5-dUTP) of the natural precursor, thymidine triphosphate, is introduced into cells, which are then grown on the heated stage of a confocal microscope. The analogue is incorporated by the endogenous enzymes into DNA. As the mechanisms for recognizing and removing the unusual residues do not prevent subsequent progress around the cell cycle, the now fluorescent DNA strands can be followed as they assemble into chromosomes, and segregate to daughters and granddaughters. Movies of such strands in living cells suggest that chromosome axes follow simple recognizable paths through their territories during G2 phase, and that late replicating regions maintain their relative positions as prophase chromosomes form. Quantitative analysis confirms that individual regions move little during this stage of chromosome condensation. As a result, the gross structure of an interphase chromosome territory is directly related to that of the prophase chromosome.
Keywords: cell cycle, chromosome, DNA replication, fluorescein, microscopy
In most somatic cells, individual chromosomes are only visible for a short period of the cell cycle, from early prophase to late telophase. During the greater part of the cycle they are so decondensed that they cannot be resolved from each other. As a result, cytologists have only been able to observe directly the movements of preformed chromosomes. Little is known about the way the chromatin fiber is folded within the interphase nucleus, or how the folding changes as chromosomes form (for reviews, see Manuelidis, 1985; Cook, 1995; Nickerson et al., 1995). Nevertheless, the application of chromosome paints to fixed cells shows that chromosomes occupy discrete territories during interphase (Cremer et al., 1993; Trask et al., 1993).
Various approaches are being used to study chromosome and nuclear dynamics in living cells (Hiraoka et al., 1989; Paddy et al., 1996; Robinett et al., 1996; Shelby et al., 1996; Straight et al., 1996; Abney et al., 1997; Marshall et al., 1997; Misteli et al., 1997; Li et al., 1998). One involves microinjecting fluorescently tagged molecules into living cells, and then observing how distributions change using time-lapse fluorescence microscopy. For example, fluorescently tagged histones are incorporated into chromosomes, and this allows the structural changes in the chromatin fiber to be followed as chromosomes pass through mitosis (Minden et al., 1989). A variant involves injection of tagged antibodies to mark structures like the nuclear lamina (Paddy et al., 1996). Another, and widely used, approach utilizes the green fluorescent protein (GFP)1 of the jellyfish Aequorea victoria; a hybrid gene encoding a cellular protein fused to GFP is constructed and introduced into a living cell, so that the expressed hybrid protein can be localized by its fluorescence (Chalfie et al., 1994). Examples include fusions between GFP and DNA-binding proteins like repressors (Marshall et al., 1997), CENP-B (Shelby et al., 1996), and histones (Kanda et al., 1998). Hybrid proteins can be seen bound to their target sequences in DNA. GFP is a large tag that might disrupt the function of an associated protein, especially if it is incorporated into a larger complex. Recently, a smaller tag, CCXXCC (X is any amino acid) in an α helix, has been introduced (Griffin et al., 1998; Tsien and Miyawaki, 1998). This short sequence is either embedded in a preexisting α helix in the protein to be marked, or attached as an α-helical peptide to either end. After expression of the appropriate construct, a bi-arsenical fluorescein derivative known as FLASH (fluorescein arsenical helix binder) is bound to the four cysteines in the α helix so that the modified protein becomes fluorescent. An additional approach involves the direct visualization of DNA strands in living cells. Cells are allowed to make DNA in the presence of a fluorescent precursor, so that individual DNA strands become fluorescent (Zink et al., 1998).
In all these approaches, living cells are illuminated with high-intensity radiation. Unfortunately, high doses kill cells, the UV wavelengths being especially toxic (Brakenhoff et al., 1996). Therefore, care must be taken to ensure that cells remain viable during image collection. As a cell may be biochemically alive (able to make DNA, or crawl across the surface of a culture vessel), while being genetically dead (unable to divide indefinitely), we will define life operationally as follows: cells able to pass through mitosis are considered to be alive, even though their potential to divide indefinitely remains untested.
We have developed a method for visualizing individual DNA strands in living cells, and we use it to monitor chromosome formation. Fluorescent analogues (fluorescein-dUTP, Bodipy-TR-dUTP, Cy5-dUTP) of the natural precursor, thymidine triphosphate, are introduced into cells; these are incorporated by endogenous enzymes into DNA. Surprisingly, the mechanisms for recognizing and repairing unnatural DNA residues do not prevent progress around the cell cycle. Therefore, the fluorescent strands can be followed by confocal microscopy as they assemble into chromosomes, and segregate to daughters and granddaughters. Movies of DNA strands in living cells suggest that chromosome axes follow simple, recognizable paths through interphase territories, with late replicating (heterochromatic) regions being so prealigned that they can readily form into a prophase chromosome.
Materials and Methods
Cell Culture
Indian muntjac (DM) cells (Ryan and Johnson, 1996) were grown in DME + 10% FCS (GIBCO BRL) and plated on glass-bottom microwell dishes coated with poly-d-lysine (Mattek). Cells were bead loaded using 100-μm glass beads (Sigma Chemical Co.) as described by McNeil (1989) with 10 μl 0.1 mM Cy5-10-dUTP (made as described below), fluorescein-12-dUTP, or Bodipy-TR-14-dUTP (both from Molecular Probes, Inc.) in L15 medium (GIBCO BRL). After loading, cells were grown in medium + 0.1 mM Trolox (a free-radical scavenger; Fluka AG) during imaging. Cy5-10-dUTP was made (Yu et al., 1994) by coupling 5-(3-aminoallyl)-2′-deoxyuridine-5′-phosphate (Sigma Chemical Co.) with Cy5 monofunctional dye (Nycomed Amersham). Cy5-10-dUTP is now supplied by Amersham. Unsynchronized cells were used for Figs. 1, E and F, 2, 3, and 5. For Fig. 1, E and F, cells were loaded with fluorescein-dUTP, grown for 45 min in bromodeoxyuridine, fixed (10 min) in 4% paraformaldehyde, refixed (20 min) in 8% paraformaldehyde, and Br-DNA indirectly immunolabeled with Cy3 (Hozák et al., 1993). For Fig. 2 A, cells were loaded with a mixture of fluorescein-dUTP and Bodipy-TR-dUTP, and grown for 4 h before the live cells were imaged. For Fig. 2 B, cells were loaded with fluorescein-dUTP, grown for 3 h, loaded with Bodipy-TR-dUTP, and grown for 4 h before imaging.
Figure 1.
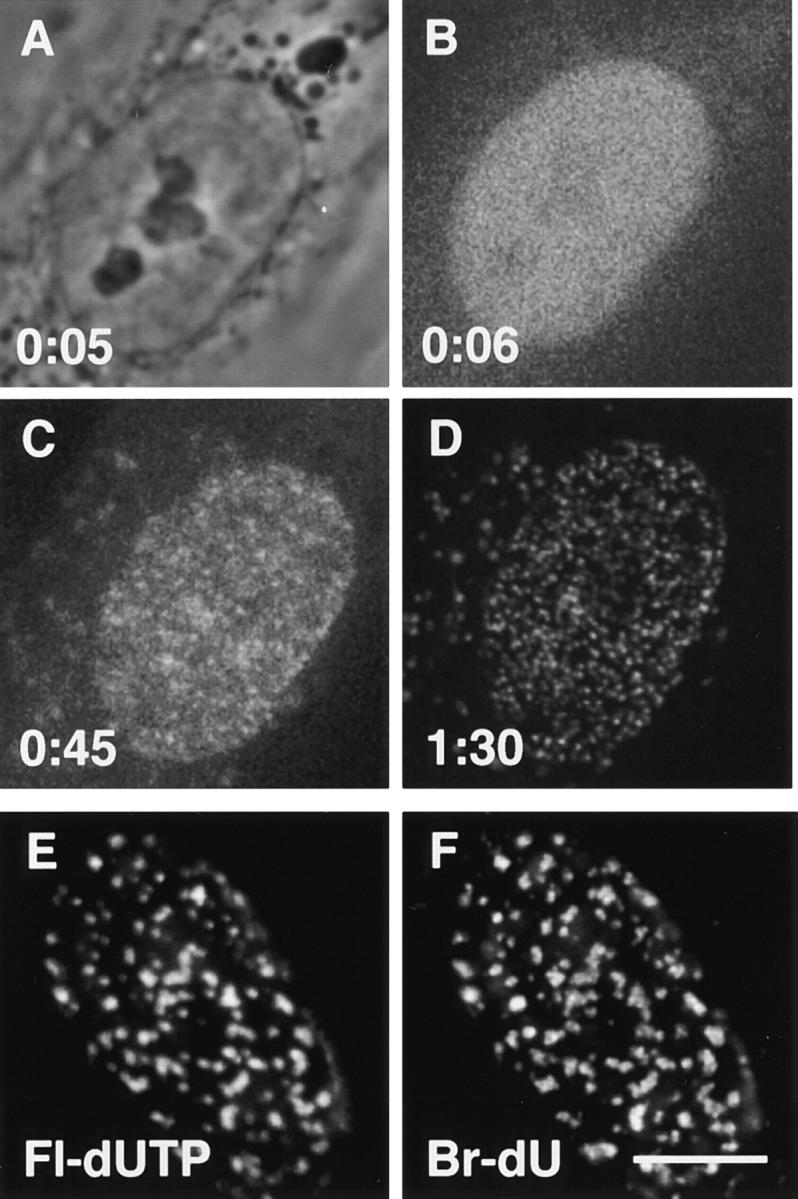
Incorporation of fluorescent DNA precursors. Time after initiating bead-loading is indicated in hours and minutes. (A–D) A phase-contrast view (A), and three single confocal sections of one muntjac cell taken at different times after loading Cy5-dUTP (laser power 50 nW for B and C, 5 μW for D; lower laser power gives a noisier signal). Label soon becomes concentrated in the nucleoplasm (B), before incorporation into DNA (C). After 1:30 h, the incorporation pattern is similar (some label is found in cytoplasmic vesicles or mitochondria, on the left in D). (E and F) Fluorescein-dUTP (Fl-dUTP) and bromodeoxyuridine (Br-dU) are incorporated into the same nuclear regions. Cells were loaded with fluorescein-dUTP, grown in bromodeoxyuridine for 45 min, and fixed. Sites containing Br-DNA were indirectly immunolabeled with Cy3, and green (E) and red (F) images of a single confocal section recorded. Unlike Cy5-dUTP, fluorescein-dUTP is not incorporated into cytoplasmic vesicles. Bar, 10 μm.
Figure 2.

Double labeling of nascent DNA in living muntjac cells. (A) The cell was loaded with a mixture of fluorescein-dUTP (green) and Bodipy-TR-dUTP (red), and imaged 4 h later. As the two labels are incorporated into the same sites, they appear yellow. (B) The cell was loaded first with fluorescein-dUTP (green), then with Bodipy-TR-dUTP (red) after 3 h, and imaged after a further 4 h. The two labels are incorporated into different sites (either green or red). Bar, 10 μm.
S-phase cells were enriched to >90% for experiments in Figs. 1, A–D, and 4, B–D. Mitotic cells were collected by shake-off, grown for 13–15 h in 2.5 mM thymidine, washed, regrown for 2–4 h in 5 μM deoxycytidine to reverse the block, and loaded. G2 cells were enriched to >50% for the experiment in Fig. 4 A. Mitotic cells were grown for 8 h, loaded, grown for 5 h, regrown for 12 h in thymidine, washed, and regrown for 11 h in deoxycytidine.
Figure 4.
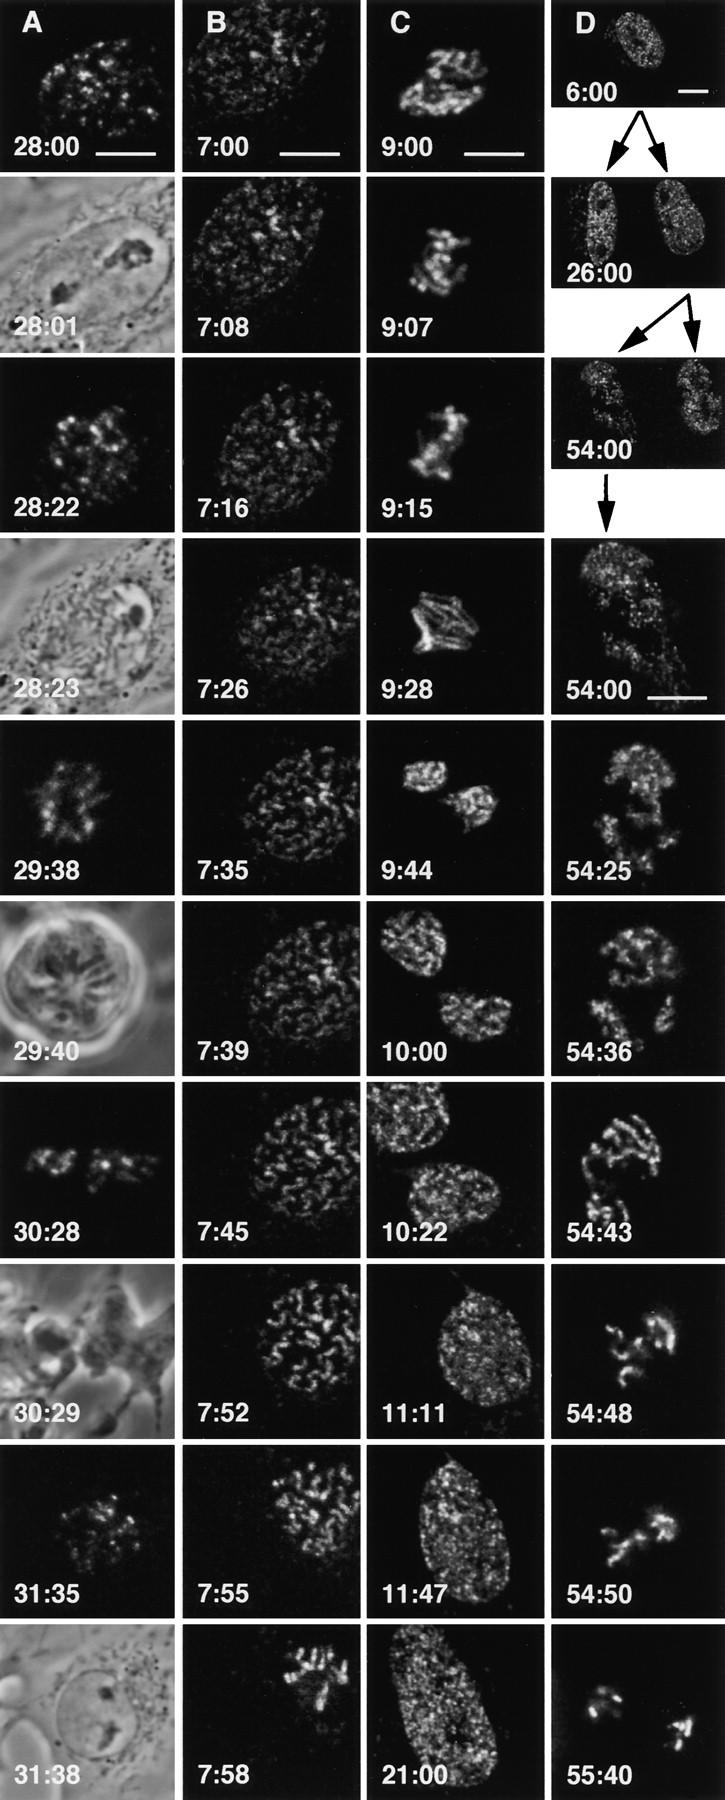
Frames taken from four time-lapse movies. Muntjac cells were loaded with Cy5-dUTP, and stacks of 12 optical sections were collected as cells grew on the stage of a confocal microscope. Each frame shows a view of the bottom four to six sections projected onto a plane. Movies contain 16, 43, 15, and 22 fluorescent frames in A–D, respectively. Bars, 10 μm. (A) Passage through mitosis (every second frame shows a phase-contrast view). Loading occurred late in S phase, so only late replicating DNA fluoresces. The cell divided, and the movie begins when one daughter reaches G2 phase (28:00) with an intact nuclear membrane (28:01). Chromosomes condense (28:22), the nuclear membrane breaks down (28:23), chromosomes align on the metaphase plate (29:38) in the rounded cell (29:40), segregate (30:28) as the cell splits (30:29), and decondense in the right-hand granddaughter (31:35) within a reformed membrane (31:38). (B) Entry into the first mitosis. Loading occurred early in S phase, so the pattern of fluorescent foci is more complex than in A. Phase-contrast showed the nuclear membrane broke down between 7:35 and 7:45. Individual foci (three bright foci in the middle) can be traced throughout. Their position changes little relative to neighboring foci, although the cell crawls to the right. (C) Exit from the first mitosis. Loading occurred early during S phase, to reveal many foci. By 9:00 h, the cell has reached mitosis, and chromosomes reorient on the metaphase plate (9:07–9:28) before segregating (9:44). By 10:00 h, nuclear membranes reform, chromosomes decondense, nuclei flatten (10:22), and the bottom daughter continues to grow (10:11–21:00). (D) Segregation of fluorescent DNA strands to great-granddaughters. The parent cell was loaded early during S phase, grew (6:00), and produced daughters (26:00), and granddaughters (54:00). As a result of semiconservative replication and random segregation, ∼50% of the chromosomes in a granddaughter contain a fluorescent strand. During interphase, these are seen as fluorescent domains against a dark background (54:00). Fluorescent domains condense into fluorescent chromosomes (54:25), dark domains into dark chromosomes (54:36). After aligning on the metaphase plate (54:43), fluorescent chromosomes (and other dark chromosomes) segregate to each of the two great-granddaughters (54: 48–55:40).
Microscopy and Image Collection
Phase-contrast images were captured with a Hamamatsu CCD attached to a Nikon Diaphot-200 microscope, fitted with a heated (Bioptech) 60× PlanApo objective and stage (Zeiss). The stage was surrounded by an insulated box. Stacks of green, red, or far-red confocal images were collected using a Bio-Rad MRC1024 (12 single scans of 170 pixels square, axial steps of 0.5 μm for interphase, and 1 μm for mitotic nuclei). Cy5 was generally used for live cell work using a 647-nm excitation beam, an intensity of 50 nW (<1/100 intensity commonly used with fixed cells), and an open pinhole. Note that doubling the excitation intensity often slowed progression around the cycle. The bottom four to six sections from each stack were projected onto a plane, converted to 510 pixels square, and contrast-stretched to fill the 256-level gray scale, the same settings were used for all images of one movie. Finally, noise was reduced by Gaussian filtering using Adobe Photoshop. For Fig. 5, positions of 48 foci were located manually using SIS EasiVision software, and exported into Excel. Images were aligned first by superimposing centers of gravity of 48 foci, and then by rotation (using a least-squares fit). Time series were displayed using Confocal Assistant (T.C. Brelje). The inaccuracy of position measurement, due to instrument movement, noise, and positioning focal centers, was determined as 0.1 μm by measuring and remeasuring the positions of foci in fixed cells under identical conditions. The length of mitotic chromosomes in two living cells (loaded with fluorescein-dUTP in early S phase) was determined using positions obtained from stacks of 37 and 66 sections.
Figure 5.
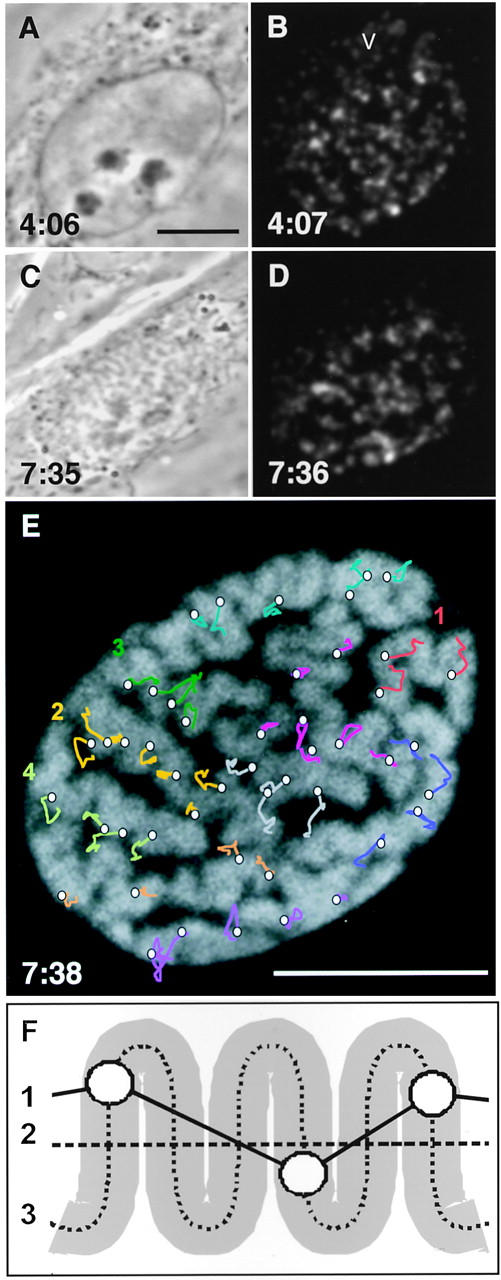
DNA dynamics during G2 phase and early prophase. A muntjac cell loaded with Cy5-dUTP was grown for 4:06 h, before 21 phase-contrast images (A and C) and 21 stacks of far-red images (B and D; projections of bottom four to six sections) were collected at the times shown. After fixation (7:38) by addition of 4% paraformaldehyde, DNA was stained with 0.5 μM SYTO16, and a final green image collected (E). Bars, 10 μm. (A and B) First frames in the movie. Foci mark late replicating DNA in the G2 nucleus and vesicles/mitochondria (v) in the cytoplasm. Phase-contrast microscopy revealed that nucleoli (6:56) and the membrane (7:19) began to break down, before recognizable chromosomes started to emerge at 7:31 (alignment of the yellow segment in E could be detected by fluorescence 35 min previously). The cytoplasmic foci move so rapidly throughout the sequence that they cannot be traced from frame to frame. (C and D) Last frames of the movie when the cell has reached prophase. (E) Extra frame taken after fixation. Fluorescence marks total DNA. Lines illustrate movements of individual foci, with similar colors indicating foci belonging to the same chromosomal segment. There are more segments than chromosomes, as some chromosomes could not be traced unambiguously from end to end. Vertices on each line mark positions at 4:27, 4:58, 5:24, 5:54, 6:31, 7:02, 7:21, and 7:36 (final position marked with a circle). Some circles do not overlie chromosomes, perhaps due to movement during fixation. (F) Chromosomal axes in early prophase chromosomes. Axis 1: the shortest line connecting all (heterochromatic) foci in a segment. Axis 2: this end-to-end length halves between prophase and metaphase (axial length of all chromosomes in the cell in E was ∼200 μm, compared to a metaphase length of ∼100 μm; see Materials and Methods). Axis 3: in E, this axis is typically ∼2.5 times the length of axis 2, and progressively shortens as chromosomes form.
Results
Visualizing Sites of DNA Synthesis in Living Cells
Fig. 1 illustrates the approach applied to Indian muntjac cells (Ryan and Johnson, 1996). These cells were chosen because they have only nine chromosomes, which facilitates analysis. They also grow rapidly with a doubling time of ∼18 h. At time zero, Cy5-dUTP was introduced into S-phase cells by bead-loading (McNeil, 1989). Addition of glass beads transiently permeabilizes the plasma membrane, allowing the analogue to enter. The petri dish containing living cells was placed on the heated stage of a microscope equipped with both phase-contrast and confocal fluorescence optics. Within 6 min, most of the precursor has been transported into the nucleus (Fig. 1 B), where it becomes concentrated in discrete nuclear foci (Fig. 1 C). These foci result because active DNA polymerases are concentrated at this stage of the cell cycle in discrete factories which duplicate the genome (Nakamura et al., 1986; Hozák et al., 1993). Essentially all analogue is incorporated into DNA in <30 min, so only DNA made in this short period fluoresces. Therefore, roughly the same pattern of foci is seen after 90 min (Fig. 1 D).
Various features indicate that these foci result from S-phase synthesis. First, they have diagnostic patterns, both in interphase and mitosis (Nakamura et al., 1986; Nakayasu and Berezney, 1989; Manders et al., 1992, 1996; O'Keefe et al., 1992). After loading in G1 phase, nuclear foci only appear when S phase is reached, then, they have the pattern typical of early-S phase (not shown). If Cy5-dUTP, or another analogue, fluorescein-dUTP, is loaded late during S phase, foci appear immediately, arranged in the pattern typical of this stage (Fig. 1 E). Second, fluorescein-dUTP is incorporated into the same foci as bromodeoxyuridine (Br-dU), a precursor routinely used to mark sites of S-phase replication (Fig. 1 F). Third, these patterns are different from those due to nucleotide-excision repair, which takes place in thousands of tiny foci in all cells in the population (Jackson et al., 1994). Fourth, unincorporated analogues can be extracted with 0.1% Triton X-100, and the nuclear foci by an additional treatment with DNase (0.5 U/ml, 10 min, 20°C, not shown).
Labeling Regions That Replicate at Different Times
Regions replicating at different times during S phase can be labeled after successive loadings with fluorescein-dUTP and Bodipy-TR-dUTP. For example, simultaneous loading with both precursors yields yellow foci (Fig. 2 A), as the two labels become intermingled in DNA. However, loading one followed by the other 3 h later yields discrete green or red foci (Fig. 2 B), as the two labels are incorporated into different parts of the genome. These results confirm others obtained earlier with fixed cells (Manders et al., 1996).
Cy5-DNA Strands in Diploid Cells Segregate Normally
All cells, including the line of muntjac cells used here (Pillidge et al., 1986), possess sophisticated mechanisms for repairing DNA damage (Friedberg, 1985). These might be expected to recognize fluorescent adducts, and to arrest the cell cycle at checkpoints in S and G2 phases. Laser illumination would also be expected to generate additional damage (Brakenhoff et al., 1996) that would compound the arrest. Only when most adducts and any light-induced damage had been removed did we expect the nonfluorescent cells to pass through mitosis. Surprisingly, muntjac cells containing Cy5-DNA divided normally (see below). As these cells have been grown continuously in culture for many generations and might have accumulated mutations in the repair pathway, we also investigated whether diploid cells behaved similarly. Therefore, a secondary culture of human fibroblasts which had been grown for only 15 passages was loaded with Cy5-dUTP, and the cells regrown for 30 h. Imaging then showed that the fluorescent DNA was divided among daughters, which were easily recognized because they shared similar fluorescent patterns (Fig. 3, A and B, arrows). All cells containing Cy5-DNA tested to date (muntjac cells, diploid human cells, HeLa cells) proved equally sensitive to illumination (not shown), although we have not yet examined this systematically. Cy5-DNA is detected after illumination with laser light of 647 nm, and, as expected, use of shorter wavelengths (568 nm for Bodipy-Texas red-DNA, and 488 nm for fluorescein-DNA) proved more toxic (not shown). We have not yet examined this systematically.
Figure 3.

Diploid human foreskin fibroblasts were loaded with Cy5-dUTP, grown for 30 h, and imaged by phase-contrast (A) or fluorescence (B) microscopy. Only cells in S phase during loading incorporate label. On division, the resulting daughter nuclei (arrows) have similar fluorescent patterns and are recognized easily, even though daughters can move apart and cytoplasmic foci persist. Bar, 50 μm.
Passage through Mitosis
Unfortunately, high doses of illumination did prevent passage through mitosis (not shown). Therefore, we could only make movies of dividing cells using low exposures, with consequent reduction in image quality and length. Fig. 4 illustrates movies of four different muntjac cells as they traverse different parts of the cell cycle. Each movie also contains a set of phase-contrast images, although none are shown in Fig. 4, B–D. Note that each fluorescent image shown is derived from a complete stack of 12 images, so that three-dimensional information is also available.
Fig. 4 A illustrates passage through mitosis. The cell was loaded with Cy5-dUTP during S phase so that late replicating DNA became fluorescent. Then, the cell was allowed to divide once (to confirm that it was well) before a stack of 12 optical sections was collected as one daughter was about to enter mitosis again (28:00 h after loading). Inspection of this stack gives a three-dimensional view of foci arranged in a pattern typical of late-S phase. Projecting the 12 images onto one plane gives a complex pattern that is difficult to analyze, so a simplified projection of only the bottom four sections is shown as the first frame in Fig. 4 A. As most late-S phase foci are peripheral, ∼50% foci are seen. Other projections were made similarly, as the daughter passed from G2 phase (28:01), through mitosis (28:22–28:40), to give two granddaughters (only one is shown after 31:35).
Fig. 4, B and C, illustrates entry into and out of mitosis in more detail. In Fig. 4 B, the cell was loaded early in S phase, so the pattern of fluorescent foci is more complex than in Fig. 4 A. The movie begins 7 h later when the cell has reached the end of G2 phase, and during filming the cell crawls to the right; by the last frame the cell is in mitosis. Between 7:35 and 7:45 h after loading, phase-contrast shows that the nuclear membrane breaks down; however, the fluorescent images reveal that chromosomes form earlier. Individual foci (three bright foci in the middle) can be traced throughout the movie. Surprisingly, their position changes little relative to neighboring foci, even when chromosomes are forming. In Fig. 4 C, the cell was loaded early during S phase, to give many foci. By 9:00 h, it has reached mitosis, and chromosomes reorient extensively on the metaphase plate (9:07–9:28), before segregating (9:44). By 10:00 h, nuclear membranes reform as chromosomes decondense, nuclei flatten (10:22), and the bottom daughter continues to grow (10:11–21:00).
Inspection of many movies, like those shown in Fig. 4, underlies our operational definition of when a cell should be considered alive. For example, cells are often able to crawl across the surface of the culture dish without being alive enough to pass through mitosis (not shown). Similarly, they may contain individual foci that move considerably relative to neighboring foci, even though they cannot form those foci into recognizable mitotic chromosomes (not shown). However, we find that if a cell is able to transform its interphase nucleus into visible chromosomes, it is usually able to segregate those chromosomes to two daughter cells. This is in accord with earlier results showing that chromosomes, once formed, become inert passengers during mitosis, as they can even be substituted or removed (Heald et al., 1996; Zhang and Nicklas, 1996).
The Segregation of Individual DNA Strands to Daughters and Granddaughters
Individual DNA strands can also be followed as they segregate to great-granddaughters. In Fig. 4 D, the parent cell was loaded early during S phase, grown for 6:00 h, and photographed. It was then allowed to divide to give daughters (26:00) and granddaughters (54:00). As a result of semiconservative replication and random segregation, ∼50% of the chromosomes in a granddaughter contain a fluorescent strand. During interphase, these are seen as fluorescent domains against a dark background (54:00). Fluorescent domains condense into fluorescent chromosomes (54:25), dark domains into dark chromosomes (54: 36). After aligning on the metaphase plate (54:43), fluorescent chromosomes (and other dark chromosomes) segregate to each of the two great-granddaughters (54:48–55: 40). If Cy5-DNA strands obey the rules of semiconservative replication and random chromosome segregation, we would expect two to three of the nine chromosomes great-granddaughters receive to be fluorescent, as is the case. Eventually descendants with only one fluorescent chromosome are born, and subsequently this chromosome is inherited unilinearly (not shown; see Jackson and Pombo, 1998; Zink et al., 1998).
The Dynamics of Chromosome Formation: Similarity of Interphase and Prometaphase Architectures
Because information on how chromosomes form is limited, we analyzed the transition from mid-G2 phase to early prophase in one cell in detail (Fig. 5). The cell was loaded late in S phase and filmed as it progressed from G2 phase into prophase. We collected 21 phase-contrast images (first and last are shown in Fig. 5, A and C) and 252 fluorescence images (21 complete stacks of 12 confocal sections through the cell) of the living cell. The phase-contrast images allowed us to monitor breakdown of the nuclear membrane and chromosome formation, while the fluorescence images provided three-dimensional information on the distribution and movement of (heterochromatic) DNA replicated late in S phase. To simplify the fluorescence images for presentational purposes, the bottom four to six sections in each of the 21 stacks were projected onto a plane (first and last are shown in Fig. 5, B and D). After collecting the last stack of images, the cell was fixed and total DNA stained, enabling individual prophase chromosomes to be identified (Fig. 5 E). A final stack of 12 images was also collected to reveal the distribution of the fluorescent foci in the fixed cell. During filming, the cell crawled 20 μm across the field, as the nucleus rotated ±20° around the z axis, such translation and rotation are common (Park and De Boni, 1991). A film incorporating corrections for these global cellular movements can be viewed on http://www.path.ox.ac.uk/prc/images/emm/emmov.htm. It contains 21 frames, each showing fluorescent foci in the bottom half of the cell.
After inspection of the complete set of three-dimensional fluorescence images, we identified 48 foci that could be tracked unambiguously from the first (interphase) image to their final positions in a chromosome. Others that could not be tracked unambiguously (mainly because they fused and/or split) were not analyzed further. Simplified tracks have been superimposed on the final image of the fixed and stained cell to illustrate the movement of the selected foci, with tracks of the same color marking foci from the same chromosomal segment (Fig. 5 E). Note that it is sometimes difficult to trace some of the selected foci unambiguously from frame to frame in the movie, which contains only two-dimensional information.
Quantitative analysis of the movie indicates that a typical focus tracks ∼2 μm from first to last frame (after correction for cellular movements). The rate of movement progressively increases from 0.2 μm/h in mid-G2 phase, reaching 0.8 μm/h when the nuclear envelope breaks down, and 2.5 μm/h during the final leg. Foci in one segment often move together (segment 1 foci in Fig. 5 E all track south-west), sometimes sliding past adjacent segments moving in a different direction (e.g., foci in segments 2 and 3). This movement could result indirectly from cellular movement, as individual chromosomal segments are elastically deformed by external forces. It also occurs in dead cells that have been exposed to so much illumination that they cannot enter prophase (not shown). The net result of such movement is an average translocation of the center of mass of foci in a typical segment by 0.7 μm (range 0.2–1.6 μm). As a segment moves, individual foci move within that segment. The net movement of foci is 0.8 μm (range 0.7–0.9 μm) relative to the center of mass of the segment.
Foci could have been distributed randomly in a domain to move to their appropriate places in the chromosome (as in Fig. 6 A). However, our results suggest foci are so prealigned that only subtle movements are required to generate recognizable chromosomes (as in Fig. 6 B). These subtle movements are reflected by the shortening of axis 1 (defined in Fig. 5 F) by 12% from first to last frame. Once formed, a prophase chromosome roughly halves its end-to-end length to give a metaphase chromosome (axis 2 in Fig. 5 F halves). We believe the results obtained with this cell are representative, because similar chromosome dynamics were seen in five others that were treated similarly. Moreover, another 10 cells, which were not fixed at the end of the experiment, were seen to pass through mitosis after exposure to similar levels of illumination.
Figure 6.

Models for chromosome formation. (A) Heterochromatic foci (circles) arranged randomly in an interphase domain (gray) could reassort into a prophase chromosome as the nuclear membrane disappears. This model is not supported by the data. (B) Heterochromatic foci are prealigned during G2 phase and relatively immobile, perhaps because they are attached to the lamina. On entry into prophase, a recognizable chromosome forms, as euchromatin condenses onto the (fixed) heterochromatic foci. Once the lamina has dispersed, foci are free to condense laterally and axially into the mitotic (M) chromosome. After sister chromatids separate and segregate to daughters, (heterochromatic) foci nucleate lamina reassembly. Once formed, the lamina fixes the foci in their new positions. When the chromosome decondenses to form a G1 domain, the foci are again prealigned for the next mitosis.
Discussion
Imaging Sites of DNA Synthesis and Individual DNA Strands in Living Cells
We describe a method that allows sites of DNA synthesis, and individual DNA strands, to be imaged directly in living cells. Fluorescent analogues (fluorescein-dUTP, Bodipy-TR-dUTP, Cy5-dUTP) of the natural precursor, thymidine triphosphate, are introduced into cells. Analogues are incorporated by endogenous enzymes into DNA so that it becomes fluorescent. Active DNA polymerases are concentrated in discrete factories (Nakamura et al., 1986; Hozák et al., 1993), and as the fluorescent precursor is exhausted, the newly made (fluorescent) DNA becomes locally concentrated in discrete foci (Fig. 1). These foci persist for many generations (Fig. 4 D; see also Jackson and Pombo, 1998; Zink et al., 1998). Surprisingly, attaching fluorescent tags to DNA has remarkably little effect on growth; the mechanisms for recognizing and repairing such unnatural DNA residues do not prevent subsequent progress around the cell cycle. Therefore, the fluorescent DNA can be imaged in the light microscope. This enabled us to use a confocal microscope to collect images of DNA strands as they condensed into chromosomes and segregated to daughters and granddaughters (Fig. 4). These cells remain both biochemically and genetically alive during imaging, as they can make DNA and pass through mitosis.
Unfortunately, the quality and length of such movies is limited by the effects of the laser light used to excite fluorescence. These effects include a lengthening of the cell cycle, delayed segregation, and the induction of strand exchanges which leads to the generation of subchromosomal domains in great-granddaughters and their descendants (not shown). Irradiation with high doses generally arrested cells in G2 phase, presumably at the major checkpoint (Elledge, 1996). If cells passed this checkpoint, they generally divided (not shown). As expected (de With and Greulich, 1995; Leavitt et al., 1997), illuminating Cy5-DNA with far-red light of 647 nm proved less toxic than the use of fluorescein or Bodipy-TR and shorter wavelengths (488 and 568 nm, respectively). Although Bodipy-TR-dUTP and fluorescein-dUTP were incorporated into DNA, and the resulting fluorescent DNA strands segregated to daughters, we generally used Cy5-dUTP when following chromosomes through mitosis. We also had to use a low intensity of the laser (5 nW measured at the position of the specimen). In practice, the length of each movie represents a compromise between minimizing exposure (to reduce toxicity) and maximizing the intensity (to increase resolution within individual frames and the total number of frames). Even so, we were able to collect >240 images of one cell (20 sets of 12 images in a confocal stack were collected for Fig. 5), sufficient to provide four-dimensional information.
Inspection of the movies directly confirms important conclusions inferred earlier using indirect approaches. First, they confirm that the replication foci or factories seen in fixed or permeabilized cells (Nakamura et al., 1986; Nakayasu and Berezney, 1989; Manders et al., 1992, 1996; O'Keefe et al., 1992; Hassan and Cook, 1993) have their counterparts in vivo, and are not preparative artifacts. Second, DNA foci move little during interphase compared with the rapid movements of mitosis (compare the first 15–16 min in Fig. 4, B and C). These interphase movements are within the range seen by others (Shelby et al., 1996; Abney et al., 1997; Marshall et al., 1997; Zink et al., 1998). Third, individual chromosomal territories seen in granddaughters and great-granddaughters are compact (Fig. 4 D, 54:25), again in agreement with earlier findings (Cremer et al., 1993; Robinett et al., 1996; Zink et al., 1998). Fourth, characteristic distributions of foci are inherited through interphase and mitosis. Thus, in Fig. 4 D, a distinctive pattern (many small foci spread throughout the nucleoplasm) is established early in S phase, and is passed to daughters (26:00) and the appropriate chromosomal domains in granddaughters (55:40). In Fig. 4 A, a different (late replication) pattern is passed down the generations. This suggests that whatever underlying structure maintains the distinctive pattern, the structure can either pass through mitosis intact, or, if disassembled, can reform accurately afterwards (see also Jackson and Pombo, 1998; Zink et al., 1998). Fifth, Cy5-DNA strands obey the rules of semiconservative replication and random chromosome segregation. For example, two to three of the nine chromosomes a great-granddaughter receives would be expected to be fluorescent, as in Fig. 4 D.
Chromosome Formation
We also used this method to visualize DNA strands during the critical phase of the cell cycle when interphase chromatin fiber forms into a recognizable chromosome (Fig. 5). This phase was inaccessible to classical cytologists, as individual fibers in the interphase nucleus cannot be resolved. Cells were loaded with Cy5-dUTP late in S phase so that heterochromatic foci became labeled. We expected all the foci on one chromosome to be distributed randomly throughout that chromosome's territory, and those foci to move to their appropriate places in the chromosome (as in Fig. 6 A). However, our results suggest the foci are so prealigned that only subtle movements are required to generate recognizable chromosomes (as in Fig. 6 B). They show that axis 2 (defined in Fig. 5 F) shortens little as the chromosome forms. Most shortening (and considerable movement) occurs after prometaphase, during the stages visible to classical cytologists. It remains to be seen to what extent early replicating foci, which are arranged in complex patterns difficult to analyze, are similarly prealigned during interphase. Just as identifiable chromosomes form without much movement, they disappear after mitosis without much movement (Fig. 4 C), although we have not yet analyzed this in detail.
These results, and those obtained earlier (Hiraoka et al., 1989), are consistent with the model illustrated in Fig. 6 B. Here, late replicating (heterochromatic) foci are prealigned during interphase. They are also relatively immobile, perhaps because they are attached to the lamina. Much of their movement seems to result indirectly from cellular movement, as individual chromosomal segments are elastically deformed as the cell crawls across the surface of the culture vessel. On entry into prophase, it is easy to imagine that these (fixed) heterochromatic foci nucleate the condensation of neighboring euchromatin. Once the lamina has dispersed, the foci become free to collapse both laterally and axially into the mitotic chromosome. Rapid chromosome movements of mitosis occur, and sister chromatids separate. After segregation to daughters, the (heterochromatic) foci could now nucleate lamina reassembly, so that they become fixed in new positions. They can now remain in those positions as the euchromatin decondenses to form a G1 domain. It remains to be established what path the chromatin fiber follows within such a domain, and how much individual foci move during the rest of interphase (see Manuelidis 1985; Cook 1995; Nickerson et al. 1995 for reviews of domain organization; and Li et al. 1998 for analysis of the movement of one gene locus). Nevertheless, our results suggest the architecture of the G2 nucleus is directly related to that of the prophase chromosome.
Future Prospects
This approach can be extended to follow early, mid, and late replicating regions in one cell (e.g., after loading successively fluorescein-dUTP, Bodipy-TR-dUTP, and Cy5-dUTP; not shown). We also anticipate that further technical advances in imaging (for example, the use of two-photon excitation; Denk et al., 1990; Brakenhoff et al., 1996) should facilitate the production of longer movies with higher resolution. This method also opens up the prospect of using fluorescence resonance energy transfer (Selvin, 1995) to monitor the docking onto DNA of DNA-binding proteins tagged with GFP or FLASH.
Acknowledgments
This work was supported by the Training and Mobility of Researchers program (European Union), the Human Frontier Science Program, and The Wellcome Trust.
Abbreviations used in this paper
- FLASH
fluorescein arsenical helix binder
- GFP
green fluorescent protein
Footnotes
Erik M.M. Manders' current address is E.C. Slater Instituut, University of Amsterdam, Plantage Muidergracht 12, 1018 TV Amsterdam, The Netherlands.
References
- Abney JR, Cutler B, Fillbach ML, Axelrod D, Scalettar BA. Chromatin dynamics in interphase nuclei and its implications for nuclear structure. J Cell Biol. 1997;137:1459–1468. doi: 10.1083/jcb.137.7.1459. [DOI] [PMC free article] [PubMed] [Google Scholar]
- Brakenhoff GJ, Muller M, Ghauharali RI. Analysis of efficiency of two-photon versus single-photon absorption for fluorescence generation in biological objects. J Microsc. 1996;183:140–144. doi: 10.1046/j.1365-2818.1996.870647.x. [DOI] [PubMed] [Google Scholar]
- Chalfie M, Tu Y, Euskirchen G, Ward WW, Prasher DC. Green fluorescent protein as a marker for gene expression. Science. 1994;263:802–805. doi: 10.1126/science.8303295. [DOI] [PubMed] [Google Scholar]
- Cook PR. A chromomeric model for nuclear and chromosome structure. J Cell Sci. 1995;108:2927–2935. doi: 10.1242/jcs.108.9.2927. [DOI] [PubMed] [Google Scholar]
- Cremer T, Kurz A, Zirbel R, Dietzel S, Rinke B, Schrock E, Speicher MR, Mathieu U, Jauch A, Emmerich P, et al. Role of chromosome territories in the functional compartmentalization of the cell nucleus. Cold Spring Harbor Symp Quant Biol. 1993;58:777–792. doi: 10.1101/sqb.1993.058.01.085. [DOI] [PubMed] [Google Scholar]
- de With A, Greulich KO. Wavelength dependence of laser-induced DNA damage in lymphocytes observed by single-cell gel electrophoresis. J Photochem Photobiol B Biol. 1995;30:71–76. doi: 10.1016/1011-1344(95)07151-q. [DOI] [PubMed] [Google Scholar]
- Denk W, Strickler JH, Webb WW. Two-photon laser scanning fluorescence microscopy. Science. 1990;248:73–76. doi: 10.1126/science.2321027. [DOI] [PubMed] [Google Scholar]
- Elledge SJ. Cell cycle checkpoints: preventing an identity crisis. Science. 1996;274:1664–1672. doi: 10.1126/science.274.5293.1664. [DOI] [PubMed] [Google Scholar]
- Friedberg, E.C. 1985. DNA Repair. W.H. Freeman, San Francisco, CA. 614 pp.
- Griffin BA, Adams SR, Tsien RY. Specific covalent labeling of recombinant protein molecules inside living cells. Science. 1998;281:269–272. doi: 10.1126/science.281.5374.269. [DOI] [PubMed] [Google Scholar]
- Hassan AB, Cook PR. Visualization of replication sites in unfixed human cells. J Cell Sci. 1993;105:541–550. doi: 10.1242/jcs.105.2.541. [DOI] [PubMed] [Google Scholar]
- Heald R, Tournebize R, Blank T, Sandaltzoupoulos R, Becker P, Hyman A, Karsenti E. Self-organization of microtubules into bipolar spindles around artificial chromosomes in Xenopusegg extracts. Nature. 1996;382:420–425. doi: 10.1038/382420a0. [DOI] [PubMed] [Google Scholar]
- Hiraoka Y, Minden JS, Swedlow JR, Sedat JW, Agard DA. Focal points for chromosome condensation and decondensation revealed by three-dimensional in vivo time-lapse microscopy. Nature. 1989;342:293–296. doi: 10.1038/342293a0. [DOI] [PubMed] [Google Scholar]
- Hozák P, Hassan AB, Jackson DA, Cook PR. Visualization of replication factories attached to a nucleoskeleton. Cell. 1993;73:361–373. doi: 10.1016/0092-8674(93)90235-i. [DOI] [PubMed] [Google Scholar]
- Jackson DA, Pombo A. Replicon clusters are stable units of chromosome structure: evidence that nuclear organization contributes to the efficient activation and propagation of S-phase in human cells. J Cell Biol. 1998;140:1285–1295. doi: 10.1083/jcb.140.6.1285. [DOI] [PMC free article] [PubMed] [Google Scholar]
- Jackson DA, Balajee AS, Mullenders L, Cook PR. Sites in human nuclei where DNA damaged by ultra-violet light is repaired: visualization and localization relative to the nucleoskeleton. J Cell Sci. 1994;107:1745–1752. doi: 10.1242/jcs.107.7.1745. [DOI] [PubMed] [Google Scholar]
- Kanda T, Sullivan KF, Wahl GM. Histone-GFP fusion protein enables sensitive analysis of chromosome dynamics in living mammalian cells. Curr Biol. 1998;8:377–385. doi: 10.1016/s0960-9822(98)70156-3. [DOI] [PubMed] [Google Scholar]
- Leavitt J, Fatone M, Hestdalen C, Obringer JW, Tillinghast HS. Mutagenic activity of high-energy 532 ultra-short laser pulses. Radiat Res. 1997;147:490–494. [PubMed] [Google Scholar]
- Li G, Sudlow G, Belmont AS. Interphase cell cycle dynamics of a late-replicating heterochromatic homogeneously staining region: precise choreography of condensation/decondensation and nuclear positioning. J Cell Biol. 1998;140:975–989. doi: 10.1083/jcb.140.5.975. [DOI] [PMC free article] [PubMed] [Google Scholar]
- Manders EM, Stap J, Brakenhoff GJ, van Driel R, Aten JA. Dynamics of three-dimensional replication patterns during the S-phase, analyzed by double labelling of DNA and confocal microscopy. J Cell Sci. 1992;103:857–862. doi: 10.1242/jcs.103.3.857. [DOI] [PubMed] [Google Scholar]
- Manders EM, Stap J, Strackee J, van Driel R, Aten JA. Dynamic behavior of DNA replicating domains. Exp Cell Res. 1996;226:328–335. doi: 10.1006/excr.1996.0233. [DOI] [PubMed] [Google Scholar]
- Manuelidis L. Individual interphase chromosome domains revealed by in situ hybridization. Hum Genet. 1985;71:288–293. doi: 10.1007/BF00388453. [DOI] [PubMed] [Google Scholar]
- Marshall WF, Straight A, Marko JF, Swedlow J, Dernburg A, Belmont A, Murray AW, Agard DA, Sedat JW. Interphase chromosomes undergo constrained diffusional motion in living cells. Curr Biol. 1997;7:930–939. doi: 10.1016/s0960-9822(06)00412-x. [DOI] [PubMed] [Google Scholar]
- McNeil PL. Incorporation of macromolecules into living cells. Methods Cell Biol. 1989;29:153–173. doi: 10.1016/s0091-679x(08)60193-4. [DOI] [PubMed] [Google Scholar]
- Minden JS, Agard DA, Sedat JW, Alberts BM. Direct cell lineage analysis in Drosophila melanogasterby time-lapse, three-dimensional optical microscopy of living embryos. J Cell Biol. 1989;109:505–516. doi: 10.1083/jcb.109.2.505. [DOI] [PMC free article] [PubMed] [Google Scholar]
- Misteli T, Caceres JF, Spector DL. The dynamics of pre-mRNA splicing factor in living cells. Nature. 1997;387:523–527. doi: 10.1038/387523a0. [DOI] [PubMed] [Google Scholar]
- Nakamura H, Morita T, Sato C. Structural organizations of replicon domains during DNA synthetic phase in the mammalian nucleus. Exp Cell Res. 1986;165:291–297. doi: 10.1016/0014-4827(86)90583-5. [DOI] [PubMed] [Google Scholar]
- Nakayasu H, Berezney R. Mapping replication sites in the eukaryotic cell nucleus. J Cell Biol. 1989;108:1–11. doi: 10.1083/jcb.108.1.1. [DOI] [PMC free article] [PubMed] [Google Scholar]
- Nickerson, J.A., B.J. Blencowe, and S. Penman. 1995. The architectural organization of nuclear metabolism. Int. Rev. Cytol. 162A:67–123. [DOI] [PubMed]
- O'Keefe RT, Henderson SC, Spector DL. Dynamic organization of DNA replication in mammalian cell nuclei: spatial and temporal defined replication of chromosome specific α-satellite DNA sequences. J Cell Biol. 1992;116:1095–1110. doi: 10.1083/jcb.116.5.1095. [DOI] [PMC free article] [PubMed] [Google Scholar]
- Paddy MR, Saumweber H, Agard DA, Sedat JW. Time-resolved, in vivo studies of mitotic spindle formation and nuclear lamina breakdown in Drosophilaearly embryos. J Cell Sci. 1996;109:591–607. doi: 10.1242/jcs.109.3.591. [DOI] [PubMed] [Google Scholar]
- Park PC, De Boni U. Dynamics of nucleolar fusion in neuronal interphase nuclei in vitro: association with nuclear rotation. Exp Cell Res. 1991;197:213–221. doi: 10.1016/0014-4827(91)90425-t. [DOI] [PubMed] [Google Scholar]
- Pillidge L, Downes CS, Johnson RT. Defective post-replication recovery and uv sensitivity in a simian virus 40-transformed Indian muntjac cell line. Int J Radiat Biol. 1986;50:119–136. doi: 10.1080/09553008614550501. [DOI] [PubMed] [Google Scholar]
- Robinett CC, Straight A, Li G, Willhelm C, Sudlow G, Murray A, Belmont AS. In vivo localization of DNA sequences and visualization of large-scale chromatin organization using lac operator/repressor recognition. J Cell Biol. 1996;135:1685–1700. doi: 10.1083/jcb.135.6.1685. [DOI] [PMC free article] [PubMed] [Google Scholar]
- Ryan AJ, Johnson RT. Dominant genetic instability and sensitivity to DNA damaging agents in a mammalian cell line. Somat Cell Mol Genet. 1996;22:177–189. doi: 10.1007/BF02369908. [DOI] [PubMed] [Google Scholar]
- Selvin PR. Fluorescence resonance energy transfer. Methods Enzymol. 1995;246:300–334. doi: 10.1016/0076-6879(95)46015-2. [DOI] [PubMed] [Google Scholar]
- Shelby RD, Hahn KM, Sullivan KF. Dynamic elastic behavior of α-satellite DNA domains visualized in situ in living human cells. J Cell Biol. 1996;135:545–557. doi: 10.1083/jcb.135.3.545. [DOI] [PMC free article] [PubMed] [Google Scholar]
- Straight AF, Belmont AS, Robinett CC, Murray AW. GFP tagging of budding yeast chromosomes reveals that protein–protein interactions can mediate sister chromatid cohesion. Curr Biol. 1996;6:1599–1608. doi: 10.1016/s0960-9822(02)70783-5. [DOI] [PubMed] [Google Scholar]
- Trask BJ, Allen S, Massa H, Fertitta A, Sachs R, van den Engh G, Wu M. Studies of metaphase and interphase chromosomes using fluorescence in situ hybridization. Cold Spring Harbor Symp Quant Biol. 1993;58:767–775. doi: 10.1101/sqb.1993.058.01.084. [DOI] [PubMed] [Google Scholar]
- Tsien RY, Miyawaki A. Seeing the machinery of live cells. Science. 1998;280:1954–1955. doi: 10.1126/science.280.5371.1954. [DOI] [PubMed] [Google Scholar]
- Yu H, Chao J, Patek D, Mujumdar R, Mujumdar S, Waggoner AS. Cyanine dye dUTP analogs for enzymatic labeling of DNA probes. Nucleic Acids Res. 1994;22:3226–3232. doi: 10.1093/nar/22.15.3226. [DOI] [PMC free article] [PubMed] [Google Scholar]
- Zhang D, Nicklas RB. ‘Anaphase' and cytokinesis in the absence of chromosomes. Nature. 1996;382:466–468. doi: 10.1038/382466a0. [DOI] [PubMed] [Google Scholar]
- Zink D, Cremer T, Saffrich R, Fischer R, Trendelenburg MF, Ansorge W, Stelzer EHK. Structure and dynamics of human interphase chromosome territories in vivo. Hum Genet. 1998;102:241–251. doi: 10.1007/s004390050686. [DOI] [PubMed] [Google Scholar]