

Abstract
Protein–protein recognition is the cornerstone of multiple cellular and pathological functions. Therefore, protein–protein interaction inhibition (2P2I) is endowed with great therapeutic potential despite the initial belief that 2P2I was refractory to small-molecule intervention. Improved knowledge of complex molecular binding surfaces has recently stimulated renewed interest for 2P2I, especially after identification of “hot spots” and first inhibitory compounds. However, the combination of target complexity and lack of starting compound has thwarted experimental results and created intellectual barriers. Here we combined virtual and experimental screening when no previously known inhibitors can be used as starting point in a structure-based research program that targets an SH3 binding surface of the HIV type I Nef protein. High-throughput docking and application of a pharmacophoric filter on one hand and search for analogy on the other hand identified drug-like compounds that were further confirmed to bind Nef in the micromolar range (isothermal titration calorimetry), to target the Nef SH3 binding surface (NMR experiments), and to efficiently compete for Nef–SH3 interactions (cell-based assay, GST pull-down). Initial identification of these compounds by virtual screening was validated by screening of the very same library of compounds in the cell-based assay, demonstrating that a significant enrichment factor was attained by the in silico screening. To our knowledge, our results identify the first set of drug-like compounds that functionally target the HIV-1 Nef SH3 binding surface and provide the basis for a powerful discovery process that should help to speed up 2P2I strategies and open avenues for new class of antiviral molecules.
Keywords: drug design, Src homology 3, docking, scoring function, NMR
Systematic screening of large libraries of compounds has often led to the identification of hits that fail in the later stages of lead development, usually because the earliest stages of the discovery process are relatively unselective and isolated compounds turn out to be biologically unsuitable for development as a medicine. Ways to improve not only the quality of the compounds entering the first screening but also the value of the assays that are performed are thus intensively explored to enhance the success rate (1–3). Structure-based drug design has provided great support toward this end, especially when reference compounds are compared with the newly discovered hits (4). Unfortunately, such compounds are mostly not available when targeting protein–protein interaction interfaces; thus, strategies aimed at facilitating the identification of such preliminary molecules are not yet available. Such strategies will require tractable models to evaluate and adapt rational drug design to the specific targeting of protein interactions, such as the HIV-1 Nef protein.
Active host–pathogen interactions take place during HIV-1 infection. These interactions implicate auxiliary viral proteins such as Nef and have direct impact on the efficiency of viral infection, pathogenicity, and disease progression (5–8). Being a nonenzymatic protein, Nef functions by means of protein–protein interactions, using distinct molecular surfaces such as the well defined Src homology 3 (SH3) binding surface (9) (Fig. 1). These biological properties have led to the proposal of Nef as a tractable model for a structure-based drug design program (9).
Fig. 1.

Structural conservation of HIV-1 Nef binding surfaces. (a) X-ray structure of the Nef–SH3Hck complex (Protein Data Bank ID code 1AVZ). The Nef surface is represented in light gray with its backbone in transparent green; the SH3 domain is shown in yellow ribbon. The 1,264-A2 hydrophobic SH3 RTLBR is circled in black. (b) Alignment of 1,292 Nef sequences from the Los Alamos HIV Sequence Database and amino acid conservation score. Low substitution rates (yellow) indicate a theoretically good target site for drug design. The Nef core domain is highly conserved in the 1,292 analyzed sequences, particularly at the RTLBR, because only two residues appear to vary. Amino acid 83 is an alanine in 44% of the analyzed sequences and a glycine in the remaining 51%, with conserved chemical and volumetric properties. The second variable residue at position 120 is a tyrosine in 65% of analyzed sequences and a phenylalanine in the remaining 35% of sequences. The phenyl group and volume remain unchanged, but the hydroxyl group is lost. These two substitutions are thus likely to have little impact on RTLBR–ligand interactions because of the shared chemical properties. (c) Residues of Nef core domain molecularly defined to be involved either directly or indirectly in cellular protein interactions and Nef functions are colored as indicated (24, 25). Only the SH3 interface identifies clearly a “deep” pocket, making the interface targetable in terms of structural biology.
The crystal structure of the unliganded core domain of Nef, as well as of Nef complexed to the SH3 domain, provides an essential template for the design of potential inhibitors of Nef's action (10, 11) (Fig. 1a). The interface between these two proteins is functionally conserved ex vivo (Fig. 1 b and c). It is composed of a total buried surface of 1,264 Å2 formed by a proline-rich region (residues 71–77) and the so-called “RT loop binding region” (RTLBR; dashed line in Fig. 1a). RTLBR includes a mostly hydrophobic “groove” delimited by three hydrophobic key residues, Phe-90, Trp-113, and Ile-114, and a salt bridge involving Arg-77. The RTLBR cavity was chosen for in silico targeting in a virtual screening approach using the National Cancer Institute (NCI) Diversity library.
Results
After an initial drug-like filtering process that retained 1,420 compounds, high-throughput docking was performed (Fig. 2a). The calculated scores were reevaluated by using GFscore (12), allowing for the preselection of 335 compounds. A pharmaco phoric filter based on the RTLBR was then applied to this selection [supporting information (SI) Fig. 5] and allowed, after clustering, to keep 33 candidates. Ten of these molecules (henceforth referred to as D1 to D10 for Diversity compounds 1–10) were selected by chemical and geometrical properties for experimental evaluation.
Fig. 2.

Protocol for the discovery of the first inhibitor, D1. (a) Flow chart of the protocol used to predefine the chemical space of interest. The NCI Diversity library data set was “cleaned up” by using 14 drug-like filters (see Materials and Methods). The resulting 1,420 compounds were docked and rescored by using GFscore (http://gfscore.cnrs-mrs.fr), leading to 335 potential hits. An SH3-based pharmacophoric filter was then derived by using MOE software (Chemical Computing Group), and the resulting 33 SH3 RT loop-like molecules were clustered in 10 final molecules. Testing only 10 molecules permits predefinition of the chemical space of interest to focus on specific chemistry. (b) Experimental scheme of the CheckMate cellular-based screening assay. Twenty-four hours after transfection with the VP16–Nef, GAL4–SH3Hck, and GAL4–Luc reporter construct, COS7 cells were seeded in 96-well assay plates. Eighteen hours later, inhibitor samples were added to each well for 36 h. In this assay, VP16–Nef/GAL4–SH3Hck interaction stimulates luciferase firefly (LucFF) production, and Renilla luciferase (LucRN) is produced by the GAL4–SH3Hck-expressing construct independent of VP16–Nef/GAL4–SH3Hck interaction, reflecting transfection efficiency and overall cell viability. Compounds reducing the LucFF:LucRN ratio (e.g., reducing VP16–Nef/GAL4–SH3Hck interaction without affecting cell viability) are considered hits. (c) The Diversity library-derived compounds D1 through D10, selected in the in silico screening, were distributed in the CheckMate assay plates at 2, 4, 8, 16, and 32 μM. Results are presented as a tendency curve of %Log LucFF:LucRN values. (d) Nef57–205 (100 ng) was incubated with D1 or vehicle (DMSO) as indicated and then reacted with GST (lanes 4 and 6) or GST–SH3Hck (lanes 1–3 and 5) followed by SDS/PAGE resolution of protein complexes and transfer to a PVDF membrane. Equivalent GST loading was verified by Red Ponceau staining (Lower), and Nef protein was detected by immunoblotting and chemiluminescence (Upper). Results were quantified and normalized to fraction number 3 fixed as 100% signal.
A mammalian two-hybrid assay system (CheckMate) was developed in intact COS7 cells (Fig. 2b). Among the 10 selected molecules only one compound, D1 (PubChem CID 308963), induced a dose-dependent reduction of normalized LucFF:LucRN ratio values produced by Nef–SH3Hck interaction (up to 77% reduction at a 32 μM concentration) but spared Id–MyoD interactions (up to 17% reduction at 32 μM), which were used here as a control for specificity (Fig. 2c and SI Fig. 6a). Two compounds (D4 and D9) either nonspecifically altered LucFF and LucRN transcription or altered cell viability and were thus excluded (SI Fig. 6 b–d). D1 cell treatment also reduced in a dose-dependent manner Nef-mediated MHC class I but not CD4 down-regulation (SI Fig. 7), which are, respectively, dependent and independent on the Nef–SH3 binding surface, as efficiently as the PI3K inhibitor LY294002 (13). The direct impact of D1 on Nef–SH3Hck interaction was then dose-dependently assessed in vitro by GST pull-down experiments. Preincubation of Nef with 0.1 μM D1 already interfered with GST–SH3Hck binding (Fig. 2d). Isothermal titration calorimetry (ITC) experiments indicated an equimolar interaction with an apparent KD in the micromolar range (1.8 ± 0.85 μM) (SI Fig. 8 and SI Table 2), comparable to the affinity of the Nef–SH3Hck interaction (KD ≈ 0.25 μM) (14).
Next, the entire Diversity library was screened by using the Nef–SH3Hck CheckMate assay adapted for high-throughput screening, using D1 as a reference compound (as described in Fig. 2b). Seven compounds of the 1,990 tested displayed a minimum of 50% inhibition for Nef–SH3Hck interaction at 20 μM concentration and were further evaluated as described in Table 1 (henceforth referred to as compounds D11 to D17). Most of these compounds were excluded because of poor drug-likeness with the exception of D14, which was identified as D1, the “best scored” molecule in the virtual screening process. Because PubChem CID 308963 was selected both in the virtual screening as D1 and again in the experimental screening as D14, our in silico preselection process was validated.
Table 1.
Chemical classes of hits found by high-throughput and virtual screening
| Compound | Structure | PubChem CID | CAS registry no. | Molecular weight | H donor | H acceptor | SlogP | Cell inhibition, % (20 μM) | Kd, μM |
|---|---|---|---|---|---|---|---|---|---|
| 11 | 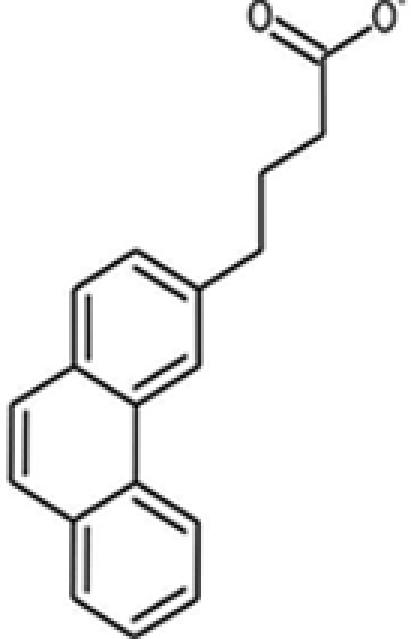 |
96904 | 13728-56-8 | 264.3 | 2 | 2 | 4.40 | 63.2 | 6.7 ± 2.1 |
| 12* | 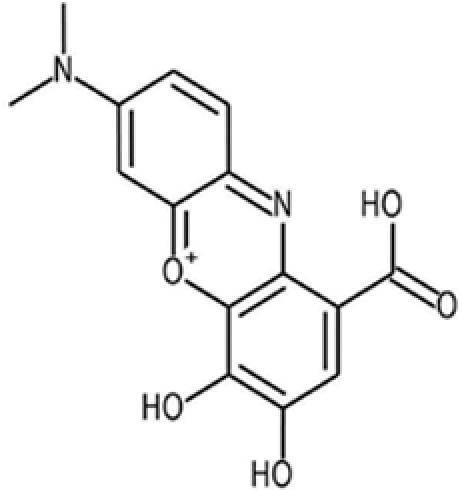 |
73801 | 1562-85-2 | 301.3 | 4 | 5 | 2.4 | 80.4 | 1.3 ± 0.52 |
| 13 | 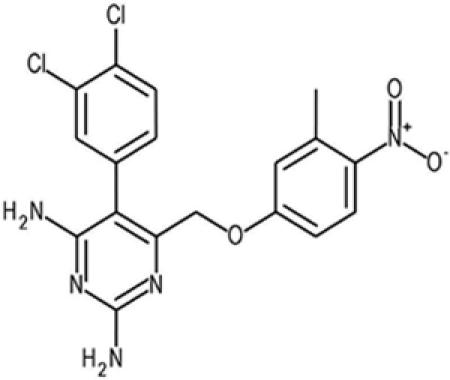 |
420759 | 21975-82-6 | 420.3 | 2 | 3 | 4.7 | 57.5 | — |
| 14† | 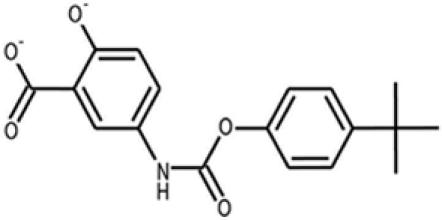 |
308963 | — | 329.4 | 4 | 4 | 4.0 | 73.4 | 1.8 ± 0.85 |
| 15 | 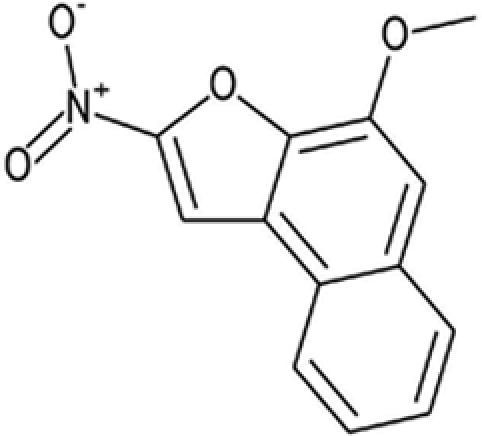 |
100603 | 75965-72-9 | 243.2 | 0 | 1 | 3.5 | 53.8 | 11 ± 5.4 |
| 16 | 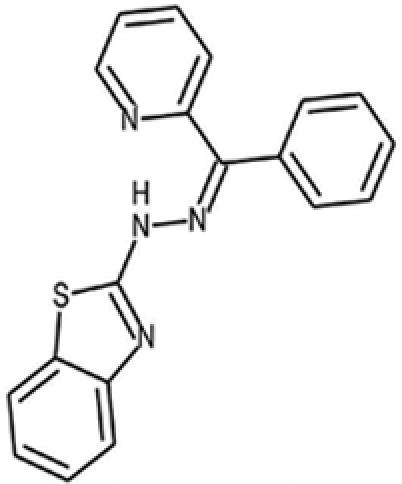 |
5999578 | — | 330.4 | 1 | 3 | 4.6 | 57.2 | — |
| 17 | 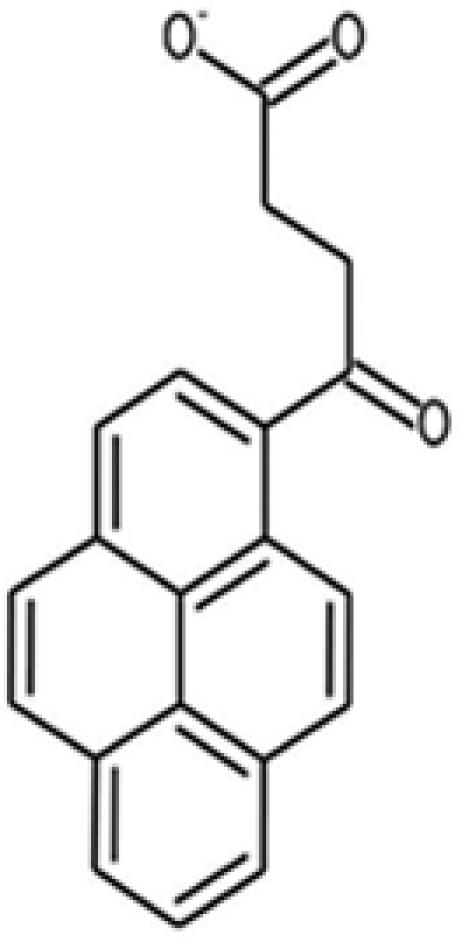 |
82011 | 7499-60-7 | 302.3 | 2 | 3 | 4.6 | 58.4 | — |
| DLC27 | 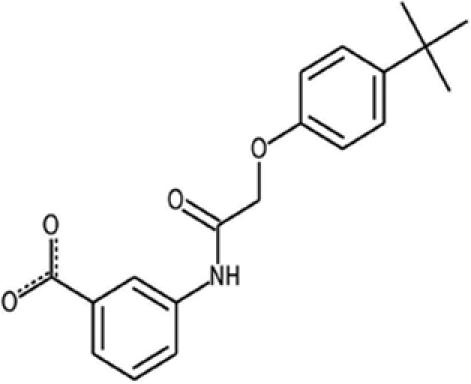 |
— | — | 326.4 | 2 | 1 | 2.3 | 75.1 | 0.98 ± 0.3 |
*D12, known as gallocyanine, is a mordant blue that was eliminated because of its chemical role (gallocyanine is used as a dye) and its strong interaction with DNA.
†D14 was described as D1 in the in silico screening and is the best candidate after high-throughput screening of the entire Diversity library.
The results obtained from both the in silico and the cell-based assay screening of the Diversity library also permitted the direct assessment of the effectiveness of our virtual screening procedure. As compared with random selection and depending on the combination of scoring functions used to rank the compounds after docking, the enrichment factor (EF), a ratio that represents the capacity to enrich the number of true binders in a list of potential hits, is used. The EF calculated for the first 15% of Diversity using FlexX/FlexX combination was the most effective with an EF of 5.6-fold (Fig. 3). Moreover, GFscore presented an average EF compared with specialized scoring functions (Fig. 3a) and performed as a generalist scoring function as expected, showing its utility for drug design in the absence of known inhibitors (12).
Fig. 3.

EF analysis. (a) EFs observed at 15% of the ranked database for the 1AVZ structure. Docking algorithms FlexX were used. The five scoring functions from the Cscore module (Tripos) and GFscore (http://gfscore.cnrs-mrs.fr) are represented. (b) Enrichment plot of the virtual screening data. The gray curve is the enrichment plot of virtual screening calculated as the ratio of the hits found by the virtual screen vs. the ratio of the ranked database. The black thin line indicates the random distribution of actives molecules.
Docking experiments were performed to gain preliminary insight into the possible mechanisms of interaction between D1 and the Nef surface. Several structural similarities were found with the SH3 RT loop interaction (10) (SI Fig. 9). Indeed, in this model, the D1 hydrophobic phenyl derivative superimposed the SH3 Ile-96 hydrophobic side chain, which was identified as a “hot spot” in a structure–activity relationship program (14). On the other side of the molecule, a benzoic acid derivative can engage in an electrostatic interaction with the protein, replacing the carboxyl group of the Asp-99 SH3 residue (10).
We thus applied a search for analogy in the Chembridge EXPRESS-Pick database (435,000 compounds) using the D1-derived carbamate and ring derivatives as a template (Fig. 4a). The nearest 70 compounds were selected and were purchased for further experimental validation. One compound, 3-{[(4-tert-butylphenoxy)acetyl]amino}benzoic acid (Chembridge Database ID 5744318)—referred to henceforth as DLC27 (for D1-like compound 27)—inhibited the Nef–SH3Hck interaction by >75% at 20 μM in the CheckMate assay (Fig. 4b). DLC27 was further validated to bind Nef in vitro by an NMR waterLOGSY experiment (SI Fig. 10) and displayed an apparent KD of 0.98 ± 0.3 μM in ITC experiments (Table 1 and SI Fig. 8 and SI Table 2). The two main chemical differences between D1 and DLC27 consist of (i) the transformation of the carbamate functionality into an amide group by a methylene insertion and (ii) the absence of phenolic function, leading to a benzoic acid bearing an N-acyl chain located in the meta position (SI Fig. 11). It is important to notice here that D1 and DLC27 are highly original and readily accessible scaffolds, with only one biological application recently reported for DLC27 (15). The docking of DLC27 on Nef was performed (SI Fig. 9), leading to a model very similar to that obtained for D1. The absence of a phenolic group allowing the formation of an intramolecular hydrogen bond with the carboxylic group of the benzoic acid improves the possibility for additional electrostatic contribution with the Lys-82 from Nef. The theoretical calculation of the log P values predicted DLC27 to be a more soluble molecule as compared with D1 (Table 1), and neither D1 nor DLC27 produced significant cell toxicity in cell viability assays for concentrations up to 100 μM (data not shown), which might be important for further development. Finally, NMR HSQC experiments (Fig. 4 c and d) structurally validated that DLC27 interacts with Nef at the expected RTLBR.
Fig. 4.

Protocol for the discovery of the second inhibitor. (a) Flow chart of the protocol that was used to identify new molecules derived from D1. A similarity search in the Chembridge EXPRESS-Pick database (435,000 compounds) was applied by using the D1-derived carbamate and ring derivatives as a template. The nearest 70 compounds were selected, taking into account the Tanimoto coefficient distance (minimum of 0.75), and were purchased for further experimental validation (mammalian two-hybrid system). (b) The 70 D1-like compounds (DLC1–70) selected as described in a were included in the CheckMate assay plates at 20 μM. Results are presented as relative light units (RLU) for each assay well (blue diamonds). Δ indicates the mean value of the 70 assay compounds. The dotted red lines indicate the 50% and 75% inhibition levels. Controls include VP16–Nef/GAL4–SH3Hck interaction in the presence of D1 (D1, red dots), VP16–Nef/GAL4–SH3Hck interaction in the presence of DMSO (SH3, open diamonds), and VP16–Nef/GAL4–SH3Hckmutated (SH3mut, black filled diamonds). DLC27 compound is circled. (c) Heteronuclear NMR experiments. Shown are (1H-15N) HSQC spectra of 15N-labeled Nef in the absence (black) and presence of two (red), three (blue), four (green), and five (magenta) equivalents of unlabeled DLC27. The spectra were collected at 308 K and pH 8.0. The concentration of free Nef was set to 0.1 mM. (d) Chemical shift mapping. Shown is a map of the chemical shift perturbations observed for Nef bound to DLC27. The surface representation was generated with Benchware 3D explorer (Tripos) by using the crystal structure of Nef (Protein Data Bank ID code 1AV). Small chemical shift changes are shaded in light red, and larger shifts are colored red. The interaction interface validates the RTLBR targeted region.
Discussion
In summary, we have identified the first two drug-like chemical compounds that bind the HIV-1 Nef SH3 binding surface in the micromolar range and can functionally compete for SH3Hck interaction, both in vitro and in cell-based assays. Virtual screenings that target protein surfaces are more challenging compared with inhibition of enzymatic cavities (16). However, our results in the field of inhibition of protein–protein interaction demonstrated that it is possible to design in silico inhibitors for protein–protein interfaces. These molecules open novel avenues and provide essential templates for future development of biologically active anti-Nef derivatives and new classes of antiviral molecules. These will include the structural resolution of the complexes formed with Nef for rational drug design approaches and their use as reference compounds in screening strategies. They will also facilitate further physiological experiments to more precisely define the role of the targeted HIV-1 Nef SH3 binding surface in vivo, especially concerning Nef-induced pathogenicity and immune escape (13, 17). Identification of these compounds was facilitated by a preliminary step of in silico screening that was next validated in a cell-based screening of the very same library of compounds, showing that a significant EF was attained in the preliminary virtual screening. Our results provide the basis for a powerful discovery process that should be applicable to larger libraries of compounds by either analogy searching or docking. This should help to hasten the identification of protein–protein interaction inhibitors using the 2P2I strategy (SI Fig. 12).
Materials and Methods
Sequence Variability Analysis on 1,292 Nef Sequences.
We considered 1,292 Nef protein sequences from the Los Alamos HIV Sequence Database. We treated this alignment to build a Nef frequency amino acid position matrix for the entire population sample using a Microsoft Excel computing table. We then used this frequency matrix to build the best conserved Nef sequence with the most frequent residues at each position. This sequence was then compare to the Nef protein sequence (B.FR.83.HXB2_LAI_IIIB_BRU_K03455) used for the in vitro validation assays, for modeling, and for virtual screening, to ensure that we were working on a representative model of the targeted surface.
Database Processing.
The NCI Diversity database was obtained from the Office of the Associate Director of the Developmental Therapeutics Program, Division of Cancer Treatment and Diagnosis, National Cancer Institute. More information is publicly available at http://dtp.nci.nih.gov/branches/dscb/diversity_explanation.html.
Modification of the original SDF file using “derived-Lipinski rules of five” (18, 19) in CONCORD (20) are described in SI Materials and Methods.
Preparation of the Protein Files for Docking.
A detailed description of preparation of the protein files for docking with FlexX 1.20.1 and virtual screening using Cscore (21) and GFscore (12) is provided in SI Materials and Methods.
EF Analysis.
The second docking was performed on the nonfiltered (1,990) molecules from Diversity database. For the FlexX docking we used the same parameters as described above on the “drug-like” filtered Diversity database. The results were ranked by using all combinations of scoring functions available in the CScore module and with our GFscore consensus function for both (i) best pose selection and (ii) ranking analysis. For each scoring function combination an EF value was computed to assess the virtual screening quality. The EF is a ratio of active (A) and inactive (I) compounds between the selected subset and the entire database: EF = (Asubset/Isubset)/(Adatabase/Idatabase) (16).
2D-Based Similarity Search.
We screened the entire Chembridge EXPRESS-Pick collection database of >435,000 compounds to search for D1 analogs using the Tanimoto coefficient (Tc)†† as described more precisely in SI Materials and Methods.
Mammalian Two-Hybrid Screening Assays.
The mammalian two-hybrid screening assay was developed by using the CheckMate assay system as recommended by the manufacturer (Promega) and is more precisely detailed in SI Materials and Methods.
GST Pull-Down Assay.
Purified Nef57–205 (10) (100 ng) was preincubated at 4°C with inhibitor sample or vehicle (1% DMSO) in 500 μl of reaction buffer (25 mM Hepes, pH 7.8/150 mM NaCl/10 mM EDTA/1 mM EGTA/1% Triton X-100) followed by addition of Sepharose-coupled recombinant GST or GST–SH3Hck (2 μg per 10 μl) for 2 h at 4°C. After three washes using reaction buffer, protein complexes were resolved by SDS/PAGE, transferred to a PVDF membrane, and colored by Red Ponceau to visualize loaded GST proteins, and the amount of Nef protein bound to GST matrix was detected by anti-Nef Western blotting and chemiluminescence (SuperWest Pico; Pierce) as described (22). Band intensity was quantified by using ImageJ (NCI).
ITC Experiments.
Purified Nef57–205 (10) (100 ng) was extensively dialyzed in degassed ITC buffer (20 mM Hepes, pH 7.0/100 mM NaCl/5% DMSO). Synthetic inhibitors were first dissolved at 10 mM in 100% DMSO and then diluted to 300–400 μM in ITC buffer with DMSO concentrations being adjusted to 5%. Inhibitors were injected from the 300-μl syringe into the 1.4-ml sample cell containing 15–25 μM Nef57–205. ITC titrations were performed at 25°C by using 10- to 15-μl injections every 300 s. All inhibitors were also titrated into ITC buffer alone, and the resulting heat of dilution was subtracted from the experimental curves. ITC was performed with a VP-ITC MicroCalorimeter from MicroCal, and data were fitted with Microcal Origin software.
NMR Experiments.
1H-15N HSQC and waterLOGSY were performed as described in SI Materials and Methods. Nef assignment already reported (23) was used to assign HSQC spectra.
Supplementary Material
Acknowledgments
We thank J. P. Borg, C. Mawas, and F. Birg for continued support and helpful discussions; O. Bornet for the NMR experiments; the laboratory of Prof. Luc Morin-Allory for the generous gift of MOE scripts; M. Beauzan and D. Byrne for bacterial expression and Nef purification; and T. Antoine for the similarity search in Tripos. Biological screenings were performed at TrGET, a targeting and screening facility at the Institut National de la Santé et de la Recherche Médicale Unité Mixte de Recherche 599. This project was supported by the Centre National de la Recherche Scientifique, Institut National de la Santé et de la Recherche Médicale, Agence Nationale de Recherche sur le SIDA, INCa, and the Regional Council Provence Alpes Côte d'Azur. A.R. was a fellow of the Agence Nationale de Recherche sur le SIDA and the recipient of SIDACTION grants. S.B. is a fellow of the Ministère de la Recherche et de l'Education Nationale.
Footnotes
Conflict of interest statement: X.M. and Y.C. are the coinventors of the herein described D1 and DLC27 molecules as HIV-1 Nef inhibitors, which are trademarked by INSERM and CNRS and covered under provisional European patent application 07021911.8 (13/11/2007).
This article is a PNAS Direct Submission.
This article contains supporting information online at www.pnas.org/cgi/content/full/0707130104/DC1.
Tanimoto TT, IBM Internal Report, November 17, 1957.
References
- 1.Morelli X, Rigby AC. Curr Comput Aided Drug Des. 2007;3:33–49. [Google Scholar]
- 2.Arkin MR, Wells JA. Nat Rev Drug Discov. 2004;3:301–317. doi: 10.1038/nrd1343. [DOI] [PubMed] [Google Scholar]
- 3.Chapman T. Nature. 2004;430:109–115. doi: 10.1038/430109a. [DOI] [PubMed] [Google Scholar]
- 4.Ahn NG, Resing KA. Science. 2005;308:1266–1267. doi: 10.1126/science.1113707. [DOI] [PubMed] [Google Scholar]
- 5.Fackler OT, Alcover A, Schwartz O. Nat Rev Immunol. 2007;7:310–317. doi: 10.1038/nri2041. [DOI] [PubMed] [Google Scholar]
- 6.Das SR, Jameel S. Indian J Med Res. 2005;121:315–332. [PubMed] [Google Scholar]
- 7.Peterlin BM, Trono D. Nat Rev Immunol. 2003;3:97–107. doi: 10.1038/nri998. [DOI] [PubMed] [Google Scholar]
- 8.Stevenson M. Nat Med. 2003;9:853–860. doi: 10.1038/nm0703-853. [DOI] [PubMed] [Google Scholar]
- 9.Saksela K. Curr Drug Targets Immune Endocr Metabol Disord. 2004;4:315–319. doi: 10.2174/1568008043339776. [DOI] [PubMed] [Google Scholar]
- 10.Arold S, Franken P, Strub MP, Hoh F, Benichou S, Benarous R, Dumas C. Structure (London) 1997;5:1361–1372. doi: 10.1016/s0969-2126(97)00286-4. [DOI] [PubMed] [Google Scholar]
- 11.Lee CH, Saksela K, Mirza UA, Chait BT, Kuriyan J. Cell. 1996;85:931–942. doi: 10.1016/s0092-8674(00)81276-3. [DOI] [PubMed] [Google Scholar]
- 12.Betzi S, Suhre K, Chetrit B, Guerlesquin F, Morelli X. J Chem Inf Model. 2006;46:1704–1712. doi: 10.1021/ci0600758. [DOI] [PubMed] [Google Scholar]
- 13.Hung CH, Thomas L, Ruby CE, Atkins KM, Morris NP, Knight ZA, Scholz I, Barklis E, Weinberg AD, Shokat KM, Thomas G. Cell Host Microbe. 2007;1:121–133. doi: 10.1016/j.chom.2007.03.004. [DOI] [PubMed] [Google Scholar]
- 14.Lee CH, Leung B, Lemmon MA, Zheng J, Cowburn D, Kuriyan J, Saksela K. EMBO J. 1995;14:5006–5015. doi: 10.1002/j.1460-2075.1995.tb00183.x. [DOI] [PMC free article] [PubMed] [Google Scholar]
- 15.Lee K, Lee JH, Boovanahalli SK, Jin Y, Lee M, Jin X, Kim JH, Hong YS, Lee JJ. J Med Chem. 2007;50:1675–1684. doi: 10.1021/jm0610292. [DOI] [PubMed] [Google Scholar]
- 16.Polgar T, Baki A, Szendrei GI, Keseru GM. J Med Chem. 2005;48:7946–7959. doi: 10.1021/jm050504d. [DOI] [PubMed] [Google Scholar]
- 17.Hanna Z, Weng X, Kay DG, Poudrier J, Lowell C, Jolicoeur P. J Virol. 2001;75:9378–9392. doi: 10.1128/JVI.75.19.9378-9392.2001. [DOI] [PMC free article] [PubMed] [Google Scholar]
- 18.Lipinski CA, Lombardo F, Dominy BW, Feeney PJ. Adv Drug Delivery Rev. 1997;23:3–25. doi: 10.1016/s0169-409x(00)00129-0. [DOI] [PubMed] [Google Scholar]
- 19.Oprea TI. J Comput Aided Mol Des. 2000;14:251–264. doi: 10.1023/a:1008130001697. [DOI] [PubMed] [Google Scholar]
- 20.Pearlman RS. Chem Des Auto News. 1987;2:1–7. [Google Scholar]
- 21.Clark RD, Strizhev A, Leonard JM, Blake JF, Matthew JB. J Mol Graphics Model. 2002;20:281–295. doi: 10.1016/s1093-3263(01)00125-5. [DOI] [PubMed] [Google Scholar]
- 22.Greenway AL, Dutartre H, Allen K, McPhee DA, Olive D, Collette Y. J Virol. 1999;73:6152–6158. doi: 10.1128/jvi.73.7.6152-6158.1999. [DOI] [PMC free article] [PubMed] [Google Scholar]
- 23.Grzesiek S, Bax A, Clore GM, Gronenborn AM, Hu JS, Kaufman J, Palmer I, Stahl SJ, Wingfield PT. Nat Struct Biol. 1996;3:340–345. doi: 10.1038/nsb0496-340. [DOI] [PubMed] [Google Scholar]
- 24.Pizzato M, Helander A, Popova E, Calistri A, Zamborlini A, Palu G, Gottlinger HG. Proc Natl Acad Sci USA. 2007;104:6812–6817. doi: 10.1073/pnas.0607622104. [DOI] [PMC free article] [PubMed] [Google Scholar]
- 25.Arold ST, Baur AS. Trends Biochem Sci. 2001;26:356–363. doi: 10.1016/s0968-0004(01)01846-1. [DOI] [PubMed] [Google Scholar]
Associated Data
This section collects any data citations, data availability statements, or supplementary materials included in this article.