Abstract
Complex traits are the product of multiple genes with effects that depend on both the genetic and environmental background. Although this complexity makes a comprehensive genetic analysis difficult, identification of even a single gene provides insight into the biochemical and/or signaling pathway underlying a trait. However, it is unknown whether multiple pathways, and consequently multiple genes, must be identified to adequately understand a trait's molecular basis. Using crosses between three natural isolates of Saccharomyces cerevisiae, we mapped sensitivity to a number of pharmacologically active compounds to a single nonsynonymous polymorphism in cystathione-β-synthase (CYS4), which is required for the first committed step in the cysteine biosynthesis pathway. Drug sensitivity is mediated by a deficiency in cysteine and consequently glutathione production, because drug sensitivity is abrogated by cysteine or glutathione supplementation. Within a diverse panel of 60 natural yeast isolates, the drug-sensitive CYS4 allele is rare, and glutathione supplementation failed to alleviate drug-dependent growth defects in two other drug-sensitive strains. These results implicate the cysteine/glutathione biosynthesis pathway as a significant, but not the sole contributor to pharmacological variation in yeast.
Keywords: CYS4, population variation in drug response, transsulfuration pathway
Genes have been identified for many complex traits (1), making it possible to investigate the molecular mechanism by which a gene produces its effect on a trait and, in the case of complex disease, to improve diagnostics and existing treatments. However, identification of multiple genes underlying a single trait remains a significant challenge and has made it difficult to know how many genes must be identified to adequately understand a trait.
In the context of response to pharmacological compounds, individual phenotypes and the underlying genes are critical. Adverse drug reactions in even a few individuals can limit or even eliminate the use of a drug (2). A significant challenge to understanding pharmacogenetic variation is that it has a complex genetic basis that depends on both drug metabolism as well as a drug's direct and indirect targets (3). Saccharomyces cerevisiae has proven an effective model for identifying a drug's mode of action and targets (4–6), for understanding multidrug resistance (7, 8), and for dissecting the genetic basis of drug resistance (9, 10). Although many cellular processes relevant to a drug's response have been identified, the number of pathways that vary and independently contribute to drug responses is not well understood.
To identify genes that underlie pharmacological variation in natural isolates of S. cerevisiae, we have mapped growth defects caused by 31 different pharmacologically active compounds. We found a gene of major effect that accounts for most of the drug-dependent growth defects of a vineyard strain. Although this gene provides insight into genetic variation underlying sensitivity to pharmacological compounds, we show by chemical complementation that genes in other pathways must be identified to fully understand pharmacological variation in the general population.
Results
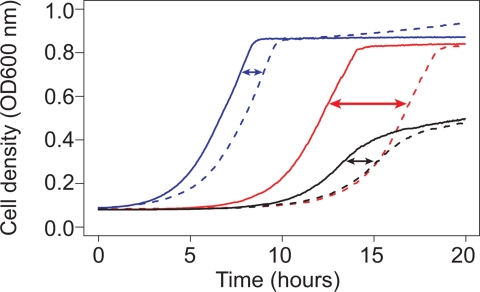
To investigate population genetic variation in response to pharmacological compounds, we screened a library of 1,280 compounds for strain-dependent effects on growth by using three natural isolates of S. cerevisiae. Although few drugs caused variation in the maximum growth rate or maximum cell density, nearly 10% produced a strain-specific delay in growth. To account for growth differences in the absence of any pharmacological compound and to control for differences in the initial cell density, we measured drug resistance by the drug-dependent delay in growth by using nearly continuous-time measurements of cell density in the presence and absence of each drug. Differences in sensitivity to the chemotherapeutic drug cisplatin are shown in Fig. 1.
Fig. 1.
Strain-dependent differences in sensitivity to cisplatin. Sensitivity was measured by the relative delay (arrows) of growth in rich medium (solid lines) to rich medium with 50 μM cisplatin (dashed lines). The growth delay was measured by the intersection of a line fit to the maximum growth rate and the initial cell density for Y (blue), M (red), and S (black).
Thirty-one drugs were selected for linkage mapping by using a three-way cross design. Each cross was generated using one of three parental strains: M22 (M), a vineyard isolate; YPS163 (Y), an oak tree isolate; and S288C (S), a laboratory strain (11). For each cross, we conducted linkage mapping by using 45 recombinant strains genotyped at 198 loci, a spacing of approximately one marker every 30 cm. In rich medium, S shows a reduced growth rate and growth yield. These two growth characteristics both map to the URA3 locus, which is deficient in S.
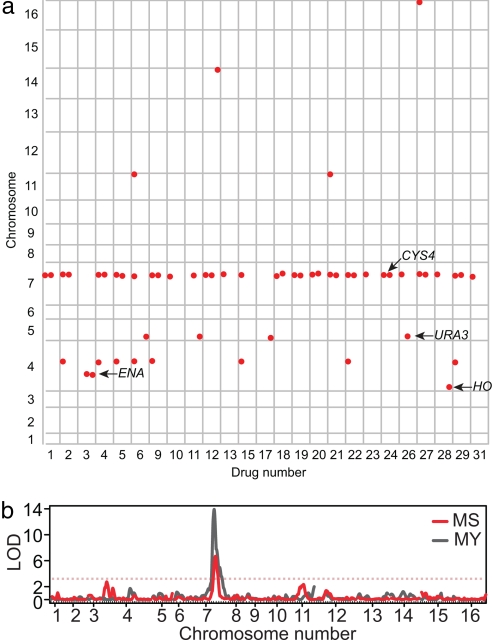
Linkage mapping of each drug-dependent growth difference in each cross separately produced 56 quantitative trait loci (QTL) at a false discovery rate (FDR) of 1% [supporting information (SI) Table 1]. Combining QTL that cause sensitivity to different drugs and map to the same location, a total of eight QTL were identified (Fig. 2a).
Fig. 2.
QTL identified by genome scans of 31 drug-sensitivity phenotypes. (a) QTL identified for each drug across the 16 chromosomes. Significant QTL (1% FDR) were plotted as red circles at the chromosomal position (vertical axis) for 27 drugs for which at least one QTL was identified (horizontal axis). Each drug column is divided into three subcolumns that indicate QTL identified in the MY, MS, and YS crosses, respectively. Drug names corresponding to each number are given in SI Table 3. (b) Genome scan showing linkage (lod score) to atenolol sensitivity in the MS cross (red) and in the MY cross (gray). Red and gray dotted lines indicate the lod score cutoff at a FDR of 1% for the MS and MY cross, respectively.
The QTL on chromosome 7 has a major effect on sensitivity to 25 of the 31 pharmacological compounds in both the MY and MS crosses, explaining 20–70% of the phenotypic variation (Fig. 2 and SI Table 1). Of the seven other QTL, two map to known S deficiencies at URA3 and HO. A third QTL on chromosome 4, which confers sensitivity to lithium chloride, spans a cluster of tandemly duplicated ENA genes (P-type ATPases involved in efflux of sodium and lithium ions) that vary in copy number among strains (12, 13). The remaining four QTL have logarithm of odds (lod) scores that range from 2.89 to 3.86 and effects that are all secondary to that of chromosome 7, and were identified in only one of the two crosses.
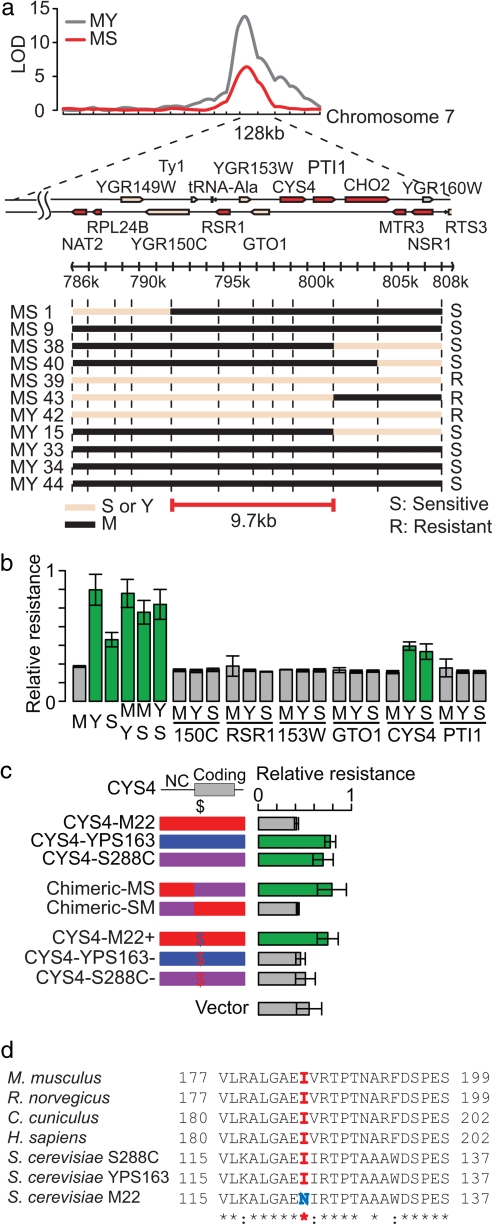
To identify the major effect QTL on chromosome 7, we used fine-scale mapping followed by allele-specific complementation. For fine-scale mapping, we genotyped an additional 17 markers within the 128-kb QTL for 24 strains showing recombination within the interval. Using cisplatin and atenolol as two representative drugs, we classified strains as drug-resistant, drug-sensitive, or intermediate (uninformative) and narrowed the QTL to a 9.7-kb region containing 6 protein-coding genes: YGR150C, RSR1, YGR153W, GTO1, CYS4, and PTI1 (Fig. 3a). The drug-resistance of MY and MS hybrid strains indicated that the drug-sensitive allele is recessive (Fig. 3b). Thus, we tested each gene for allele-specific complementation. Only one of the six genes showed complementation. CYS4 from either Y or S alleviated drug sensitivity, whereas CYS4 from M produced no effect (Fig. 3b). Three noncoding polymorphisms, one nonsynonymous polymorphism, and one synonymous polymorphism differentiate the M allele from the other two strains. To determine which of these are functional, we tested a series of constructs for complementation and found that drug sensitivity is caused by the nonsynonymous polymorphism, I123N, at a position conserved between yeast and mammals (Fig. 3 c and d).
Fig. 3.
Identification of a nonsynonymous change within CYS4 that causes drug sensitivity. (a) Fine-scale mapping of the chr7 QTL. Black and pink lines indicate M and Y/S inheritance, respectively. (b) Plasmid-based complementation tests of six genes. Relative resistance to antenolol is shown for the parental strains (M, Y, and S), the hybrid strains (MY, MS, YS), and for complementation with the M, Y, or S allele from six protein-coding genes. Relative resistance is measured by the minimum growth delay divided by the growth delay of each strain. Strains showing significant levels of resistance are indicated in green. (c) Plasmid-based complementation of resistance to atenolol using chimeric CYS4 constructs. CYS4 constructs include: the M (red), Y (blue), and S (purple) allele; chimeric constructs containing either the coding or noncoding region (NC) from M or S; and single-base substitution constructs that result in a single nonsynonymous change to the M allele (red $) or the wild-type allele (blue $), and a no-insert vector control. (d) Conservation of the CYS4 drug-resistance allele between yeast and mammals.
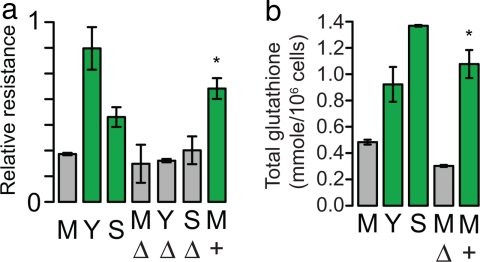
To measure the effects of the nonsynonymous change at its endogenous locus, we generated an allele replacement. With the drug-resistant CYS4 allele, M is transformed from a drug-sensitive into a drug-resistant strain (Fig. 4a). Deletion of CYS4 in M, Y, and S results in drug-sensitivity similar to that of M and indicates that the nonsynonymous change results in a substantial loss of function.
Fig. 4.
CYS4 affects drug-sensitivity and glutathione levels. (a) Relative resistance to atenolol for the parental strains (M, Y, S); for the deletion of CYS4 in M (MΔ), Y (YΔ), and S (SΔ); and for the M allele replacement (M+). (b) Total glutathione levels for the parental strains (M, Y, S), for the deletion of CYS4 in M (MΔ), and for the M allele replacement (M+).
CYS4 encodes cystathione-β-synthase, which converts homocysteine into cystathione and leads to the biosynthesis of cysteine and subsequently glutathione (SI Fig. 7). Glutathione plays an important role in regulating intracellular redox potential and, when conjugated to xenobiotic compounds, in facilitating detoxification (14). If glutathione deficiency is responsible for the drug sensitivity, then M should show reduced levels of glutathione, and drug-dependent growth differences should be eliminated by cysteine or glutathione supplementation. Total intracellular glutathione quantification revealed that M has significantly lower intracellular glutathione compared with Y and S, and the M allele replacement has normal levels of glutathione (Fig. 4b). In comparison with the M CYS4 deletion strain, M has significantly more glutathione, indicating that the M allele of CYS4 is a hypomorph.
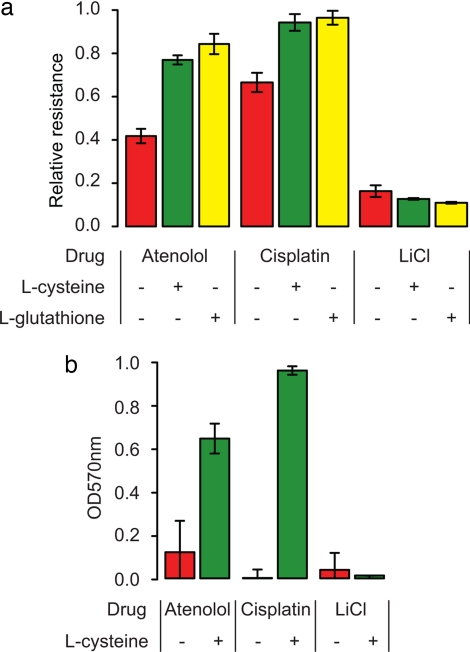
To determine whether CYS4-induced glutathione deficiency causes drug sensitivity, we measured drug-dependent growth differences in the presence and absence of glutathione and cysteine. Supplementation with 1 mM cysteine or 1 mM glutathione suppressed the drug-sensitive phenotype of M (Fig. 5a) and recombinant strains carrying the M allele of CYS4 (SI Fig. 8).
Fig. 5.
Chemical complementation in yeast and human hepatoma cells. (a) Relative resistance of M to 2 mM atenolol and 10 μM cisplatin and relative resistance of Y to 4 mM lithium chloride in media supplemented with water (red), 1 mM cysteine (green), and 1 mM glutathione (yellow). Resistance of Y is set to 1 for atenolol and cysteine and to 0.08 for lithium chloride. (b) Resistance of HepG2 cell lines to 4 mM atenolol, 32 μM cisplatin, and 60 mM lithium chloride after 48 h of growth in media supplemented with water (red) and 20 mM l-cysteine (green). Resistance is measured by OD570 from an MTT assay, which is proportional to the number of viable cells.
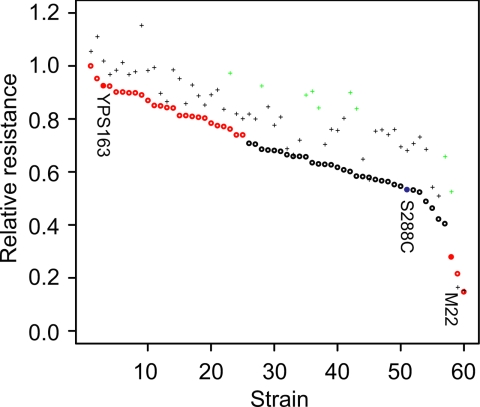
The importance of CYS4 to pharmacological variation in yeast depends on the frequency of the drug-sensitive allele. Of 60 strains of diverse origin (SI Table 2), only M carries the drug-sensitive allele. However, the same strains were highly variable in their response to 5 mM atenolol (Fig. 6, ANOVA, P < 10−16). Compared with S, 3 strains, including M, were significantly more sensitive, and 25 strains, including Y, were significantly more resistant (t test, P < 0.05, Bonferroni corrected). This finding implies that polymorphism in genes other than CYS4 contributes to drug sensitivity in yeast.
Fig. 6.
Sensitivity to atenolol is not always complemented by glutathione supplementation in a set of 60 strains of diverse origin. Relative resistance to 5 mM atenolol with (+) and without (o) glutathione is shown for each strain (see SI Table 2 for strain names). Strains that show significantly higher or lower resistance relative to S are shown in red, and strains that show a significant increase in resistance with glutathione are shown in green.
If drug sensitivity is due to population variation in glutathione levels or metabolic flux, then drug sensitivity should be attenuated in glutathione-supplemented medium. In the presence of 1 mM glutathione, there was an overall increase in resistance to atenolol (ANOVA, P < 10−16), and the change in drug sensitivity was strain-specific (ANOVA, P < 0.003). Compared with S, nine strains, including M, showed a significant decrease in drug sensitivity (t test, P < 0.05, Bonferroni corrected). Interestingly, glutathione produced no effect on the two most drug-sensitive strains, UWOP87–242 and NCYC361, and some glutathione-responsive strains showed high levels of resistance in the absence of glutathione (Fig. 6). Glutathione-responsive strains may result from a deficiency in glutathione levels before drug treatment or from deficiencies in glutathione production in response to drug treatment. We measured intracellular glutathione levels before drug treatment and found no correlation with drug-sensitivity or glutathione dependent changes in drug sensitivity. This finding implies either a dynamic relationship between glutathione levels and drug sensitivity or that other factors confound the relationship between glutathione and drug sensitivity.
What role does cysteine biosynthesis play in pharmacogenetic variation in humans? Although most cysteine is obtained from diet, it is estimated that half of the glutathione in the liver is generated through the transsulfuration pathway (15). Furthermore, acetaminophen overdoses are primarily treated with N-acetyl-l-cysteine, which stimulates glutathione biosynthesis (16); and a common polymorphism in CBS, the human homologue of CYS4, has been implicated in resistance to 5-fluorouracil (17).
To test whether modulating cysteine biosynthesis influences drug-sensitivity in humans, we examined drug toxicity in the human hepatoma cell line, HepG2. Cysteine supplementation significantly enhanced cell viability in the presence of increasing concentrations of atenolol and cisplatin, but not lithium, as found in S. cerevisiae (Fig. 5b).
Discussion
Although many genes involved in complex traits have been identified, polymorphism within these genes can be rare (18, 19) or can have small, background-dependent effects (20–22). This finding illustrates the need for understanding phenotypes as the product of a system of interacting parts. We have shown that a rare polymorphism in CYS4 affects glutathione levels and multidrug sensitivity. Glutathione supplementation in a diverse collection of strains showed that drug sensitivity is not always caused by defects in the cysteine/glutathione biosynthesis pathway. The increase in resistance observed for nine strains with intermediate phenotypes implicates quantitative variation in the cysteine/glutathione biosynthesis pathway. However, these effects may have been mediated by indirect effects of glutathione on other pathways or on cellular processes besides those leading to glutathione biosynthesis. Overall, our results indicate that genes in multiple pathways must be identified to adequately understand the network of interactions leading to quantitative variation present in natural populations.
Materials and Methods
Yeast Strains and Media.
Rich medium [yeast extract/peptone/dextrose (YPD)], uracil dropout medium (CM-ura), and G418 selection were made as described in ref. 23. For chemical complementation tests, l-cysteine and reduced l-glutathione (Sigma) were dissolved in distilled water and added to rich medium.
Natural yeast isolates were obtained from a number of sources (SI Table 2), and S was obtained from D. Botstein (Princeton University, Princeton, NJ) (DBY8268, MATa/α, GAL2/GAL2, Δura3 EcoRV-StuI/ura3-52 ho/ho). S, M, and Y were sporulated, tetrads were dissected, and hybrids of paired spores were selected by observation. Each of the three hybrids was sporulated, tetrads were dissected, and recombinant strains were derived from single spores. The strains derived from these spores were homozygous diploid, or they were haploid if the ho- allele was inherited from S.
Deletion of CYS4 in M was generated using the kanMX deletion cassette (24). Deletion of CYS4 in S was generated as part of the deletion collection (25). To generate the allele replacement, a 397-bp PCR fragment containing the S allele of CYS4, differing from the M allele by a single nucleotide, was directly transformed into M (cys4::kanMX). Transformants were grown in complete media for 24 h and then plated onto complete media. Large colonies were transferred to YPD supplemented with 1 mM CuSO4. Because the drug-sensitive allele of CYS4 also causes rust coloration in the presence of copper, white colonies were isolated, and the replacement was confirmed by sequencing CYS4 and five random sites on different chromosomes to ensure no contamination from other strains.
Library Screen.
The parental strains were screened for resistance to a library of 1,280 pharmacologically active compounds (LOPAC1280; Sigma) along with two other added chemicals: hydrogen peroxide and menadione. Overnight cultures were used to inoculate rich medium (YPD) in flat-bottom, 96-well plates. After 2 h of growth, compounds were added to obtain a final predetermined concentration (SI Table 3). Subsequent growth rates were estimated by OD600 measurements of cell density. Ninety-seven compounds were selected from those that produced the most variation in growth rates among S, M, and Y in comparison with growth in the absence of any compound. Of these, 72 showed repeatable effects on growth rate (SI Table 3). The frequency of the drugs categorized as affecting neurotransmission, cell signaling, apoptosis/cell cycle, hormones, antibiotics, ion channels, lipid metabolism, phosphorylation, and cell proliferation were not significantly different from the frequencies in the entire library. A total of 31 drugs were selected for further analysis by those that caused growth defects in different strains and that could be used at the lowest concentrations (SI Table 3).
Phenotype Assay.
To phenotype drug resistance, strains were grown overnight, diluted 1:1,000 in 90 μl of rich medium (YPD), grown for 2 h, treated with 10 μl of water or a pharmacological compound, and then grown for 20 h. Samples were grown in an iEMS incubator (30°C)/shaker (1,200 rpm)/plate reader (OD600) (model no. 1400; Labsystems). Drug resistance was measured by estimating the growth delay of each strain relative to the absence of a drug by finding the intersection between a line fit to the time point with the maximum growth rate and a horizontal line set at the initial cell density.
Genotyping.
The 135 recombinant strains were genotyped at a total of 198 loci, even spaced every 60 kb (≈30 cM). To distinguish the three parental alleles we genotyped two SNPs at each marker locus. Primer extensions of PCR products were assayed by MALDI-TOF mass spectrometry using the MassARRAY system (Sequenom, San Diego, CA). Because one of the strains from the YS cross showed no recombination, we removed it from the QTL analysis. This resulted in a total of 134 recombinant strains.
QTL Mapping.
The Haley–Knott regression algorithm (26) implemented in R/QTL (27) was used to identify QTL in each cross separately. Significant lod scores were determined using the FDR from permutations of 1,000 shuffled phenotypes. The FDR for a given lod cutoff was estimated by dividing the fraction of the false positives from shuffled data by the fraction of positives from the observed data. We defined QTL as being potentially pleiotropic if they were within the same marker interval or within 15 cm of one another. A total of eight previously undiscovered QTL were identified. The genotype and phenotype data are available in the SI Dataset 1.
Plasmid Complementation.
Six candidate genes from each of three parental strains were PCR amplified to contain full coding and flanking noncoding regions and cloned into the CEN plasmid, pRS316 (28). CYS4 chimeric constructs MS and SM were generated by restriction digestion and ligation by using an EcoRI site at the 5′ end of the coding region and a BamHI site at the 3′ end of the coding region. Constructs with a point mutation at the 123rd amino acid were generated by fusion PCR and ligated with EcoRI–BamHI vector fragments. Constructs were confirmed by sequencing. Constructs were assayed in one of the MS recombinant strains that was drug-sensitive (MS40, Δura3, ho-) and with the chr7 QTL region inherited from M.
Glutathione Quantification.
Overnight cultures were inoculated into rich media (YPD) and grown for 2 h. Cells were washed and suspended in 100 μl of water. Cell density was measured at OD600, and cells were boiled for 8 min (29). Ten and five μl from each sample were used for the assay. Total glutathione concentration was measured by following the manufacturer's protocol (Sigma).
Human Cell-Line Assay.
The human hepatoma cell line, HepG2, was grown in a 37°C humidified incubator with 5% CO2. At confluency, the same volume of cells were resuspended in 96-well plates and attached for 24 h before adding atenolol, cisplatin, or lithium and/or l-cysteine (Sigma) to DMEM (Invitrogen) supplemented with 10% FBS (Invitrogen). Cells were grown for 72 h, and their viability was measured by the 3-(4,5-dimethylthiazol-2-yl)-2,5-diphenyl tetrazolium bromide (MTT) assay (30).
Supplementary Material
Acknowledgments
We thank M. Johnston (Washington University) for sharing the plasmid and knockout strains; A. Bowcock (Washington University) for the core genotyping service; C. Cemenkovich (Washington University) for sharing the HepG2 cell line; J. Huh (Washington University) for providing the M22 CYS4 knockout strain; E. Louis, G. Litti, and L. Kruglyak (all at Princeton University) for sharing natural yeast isolates; and S. Doniger, J. Gerke, H. True-Krob, and B. Cohen for critical reading and helpful discussions.
Footnotes
The authors declare no conflict of interest.
This article is a PNAS Direct Submission.
This article contains supporting information online at www.pnas.org/cgi/content/full/0708194104/DC1.
References
- 1.Glazier AM, Nadeau JH, Aitman TJ. Science. 2002;298:2345–2349. doi: 10.1126/science.1076641. [DOI] [PubMed] [Google Scholar]
- 2.Shah RR. Pharmacogenomics. 2006;7:889–908. doi: 10.2217/14622416.7.6.889. [DOI] [PubMed] [Google Scholar]
- 3.Goldstein DB, Tate SK, Sisodiya SM. Nat Rev Gen. 2003;4:937–947. doi: 10.1038/nrg1229. [DOI] [PubMed] [Google Scholar]
- 4.Giaever G, Shoemaker DD, Jones TW, Liang H, Winzeler EA, Astromoff A, Davis RW. Nat Gen. 1999;21:278–283. doi: 10.1038/6791. [DOI] [PubMed] [Google Scholar]
- 5.Lum PY, Armour CD, Stepaniants SB, Cavet G, Wolf MK, Butler JS, Hinshaw JC, Garnier P, Prestwich GD, Leonardson A, et al. Cell. 2004;116:121–137. doi: 10.1016/s0092-8674(03)01035-3. [DOI] [PubMed] [Google Scholar]
- 6.Giaever G, Flaherty P, Kumm J, Proctor M, Nislow C, Jaramillo DF, Chu AM, Jordan MI, Arkin AP, Davis RW. Proc Natl Acad Sci USA. 2004;101:793–798. doi: 10.1073/pnas.0307490100. [DOI] [PMC free article] [PubMed] [Google Scholar]
- 7.Kolaczkowski M, Kolaczowska A, Luczynski J, Witek S, Goffeau A. Microb Drug Resist. 1998;4:143–158. doi: 10.1089/mdr.1998.4.143. [DOI] [PubMed] [Google Scholar]
- 8.Wolfger H, Mamnun YM, Kuchler K. Res Microbiol. 2001;152:375–389. doi: 10.1016/s0923-2508(01)01209-8. [DOI] [PubMed] [Google Scholar]
- 9.Perlstein EO, Ruderfer DM, Roberts DC, Schreiber SL, Kruglyak L. Nat Gen. 2007;39:496–502. doi: 10.1038/ng1991. [DOI] [PubMed] [Google Scholar]
- 10.Homann OR, Cai H, Becker JM, Lindquist SL. PLoS Gen. 2005;1:e80. doi: 10.1371/journal.pgen.0010080. [DOI] [PMC free article] [PubMed] [Google Scholar]
- 11.Fay JC, Benavides JA. PLoS Gen. 2005;1:66–71. doi: 10.1371/journal.pgen.0010005. [DOI] [PMC free article] [PubMed] [Google Scholar]
- 12.Wieland J, Nitsche AM, Strayle J, Steiner H, Rudolph HK. EMBO J. 1995;14:3870–3882. doi: 10.1002/j.1460-2075.1995.tb00059.x. [DOI] [PMC free article] [PubMed] [Google Scholar]
- 13.Garciadeblas B, Rubio F, Quintero FJ, Banuelos MA, Haro R, Rodriguez-Navarro A. Mol Gen Genet. 1993;236:363–368. doi: 10.1007/BF00277134. [DOI] [PubMed] [Google Scholar]
- 14.Salinas AE, Wong MG. Curr Med Chem. 1999;6:279–309. [PubMed] [Google Scholar]
- 15.Vitvitsky V, Dayal S, Stabler S, Zhou Y, Wang H, Lentz SR, Banerjee R. Am J Physiol. 2004;287:R39–R46. doi: 10.1152/ajpregu.00036.2004. [DOI] [PubMed] [Google Scholar]
- 16.Kelly GS. Alt Med Rev. 1998;3:114–127. [PubMed] [Google Scholar]
- 17.Sasaki S, Watanabe T, Kobunai T, Nagawa H. Cancer Lett (Shannon, Irel) 2006;242:256–262. doi: 10.1016/j.canlet.2005.10.022. [DOI] [PubMed] [Google Scholar]
- 18.Macdonald SJ, Patinen T, Long AD. Genetics. 2005;171:1741–1756. doi: 10.1534/genetics.105.045344. [DOI] [PMC free article] [PubMed] [Google Scholar]
- 19.Deutschbauer AM, Davis RW. Nat Gen. 2005;37:1333–1340. doi: 10.1038/ng1674. [DOI] [PubMed] [Google Scholar]
- 20.Kroymann J, Mitchell-Olds T. Nature. 2005;435:95–98. doi: 10.1038/nature03480. [DOI] [PubMed] [Google Scholar]
- 21.Badano JL, Leitch CC, Ansley SJ, May-Simera H, Lawson S, Lewis RA, Beales PL, Dietz HC, Fisher S, Katsanis N. Nature. 2006;439:326–330. doi: 10.1038/nature04370. [DOI] [PubMed] [Google Scholar]
- 22.The Wellcome Trust Case Control Consortium. Nature. 2007;447:661–678. [Google Scholar]
- 23.Rose MD, Winston F, Hieter P. Methods in Yeast Genetics: A Laboratory Course Manual. Cold Spring Harbor, NY: Cold Spring Harbor Lab Press; 1990. [Google Scholar]
- 24.Wach A, Brachat A, Pohlmann R, Philippsen P. Yeast. 1994;10:1793–1808. doi: 10.1002/yea.320101310. [DOI] [PubMed] [Google Scholar]
- 25.Winzeler EA, Shoemaker DD, Astromoff A, Liang H, Anderson K, Andre B, Bangham R, Benito R, Boeke JD, Bussey H, et al. Science. 1999;285:901–906. doi: 10.1126/science.285.5429.901. [DOI] [PubMed] [Google Scholar]
- 26.Haley CS, Knott SA. Heredity. 1992;69:315–324. doi: 10.1038/hdy.1992.131. [DOI] [PubMed] [Google Scholar]
- 27.Broman KW, Wu H, Sen S, Churchill GA. Bioinformatics. 2003;19:889–890. doi: 10.1093/bioinformatics/btg112. [DOI] [PubMed] [Google Scholar]
- 28.Sikorski RS, Hieter P. Genetics. 1989;122:19–27. doi: 10.1093/genetics/122.1.19. [DOI] [PMC free article] [PubMed] [Google Scholar]
- 29.Bannister SJ, Wittrup D. Biotech Bioeng. 2000;68:389–395. doi: 10.1002/(sici)1097-0290(20000520)68:4<389::aid-bit4>3.0.co;2-n. (2000) [DOI] [PubMed] [Google Scholar]
- 30.Horiuchi N, Nakagawa K, Sasaki Y, Minato K, Fujiwara Y, Nezu K, Ohe Y, Saijo N. Cancer Chemother Phamacol. 1988;22:246–250. doi: 10.1007/BF00273419. [DOI] [PubMed] [Google Scholar]
Associated Data
This section collects any data citations, data availability statements, or supplementary materials included in this article.


