Abstract
Bardet–Biedl syndrome (BBS) is a genetically heterogeneous disorder that results in retinal degeneration, obesity, cognitive impairment, polydactyly, renal abnormalities, and hypogenitalism. Of the 12 known BBS genes, BBS1 is the most commonly mutated, and a single missense mutation (M390R) accounts for ≈80% of BBS1 cases. To gain insight into the function of BBS1, we generated a Bbs1M390R/M390R knockin mouse model. Mice homozygous for the M390R mutation recapitulated aspects of the human phenotype, including retinal degeneration, male infertility, and obesity. The obese mutant mice were hyperphagic and hyperleptinemic and exhibited reduced locomotor activity but no elevation in mean arterial blood pressure. Morphological evaluation of Bbs1 mutant brain neuroanatomy revealed ventriculomegaly of the lateral and third ventricles, thinning of the cerebral cortex, and reduced volume of the corpus striatum and hippocampus. Similar abnormalities were also observed in the brains of Bbs2−/−, Bbs4−/−, and Bbs6−/− mice, establishing these neuroanatomical defects as a previously undescribed BBS mouse model phenotype. Ultrastructural examination of the ependymal cell cilia that line the enlarged third ventricle of the Bbs1 mutant brains showed that, whereas the 9 + 2 arrangement of axonemal microtubules was intact, elongated cilia and cilia with abnormally swollen distal ends were present. Together with data from transmission electron microscopy analysis of photoreceptor cell connecting cilia, the Bbs1 M390R mutation does not affect axonemal structure, but it may play a role in the regulation of cilia assembly and/or function.
Bardet–Biedl syndrome [BBS, Online Mendelian Inheritance in Man (OMIM) 209900] is a genetically heterogeneous autosomal recessive disorder characterized by obesity, retinal degeneration, polydactyly, cognitive impairment, hypogenitalism, and renal abnormalities, as well as susceptibility to hypertension, diabetes mellitus, olfaction deficits, and congenital cardiac defects. Twelve BBS genes (BBS1-12) have been identified to date (1–14). They encode a set of proteins thought to play a role in the structure or function of cilia, basal bodies, and intracellular transport (15, 16). Mutations in BBS1 are the most commonly observed in BBS. A single missense mutation that converts a methionine codon to an arginine codon (M390R) accounts for ≈80% of BBS1 mutations and is involved in 25% of all BBS cases (5). The M390R mutation occurs near predicted regions of coiled-coil protein domains and lies within a conserved predicted WD40-like protein motif. These protein motifs are involved in such basic biological processes as signal transduction, RNA synthesis/processing, chromatin assembly, vesicular trafficking, cytoskeletal assembly, cell cycle control, and apoptosis (17).
Recently, BBS1, BBS2, BBS4, BBS5, BBS7, BBS8, and BBS9 were shown to form a stable ≈450-kDa protein complex called the BBSome in cultured retinal pigment epithelial (RPE) cells and mouse testes. Depletion of some components of the BBSome, including BBS1, affects ciliogenesis in RPE cells by interfering with membrane trafficking to the cilium (16). To better understand the function of BBS1 and the molecular consequences of the M390R mutation, we developed a Bbs1M390R/M390R knockin mouse model. The mice manifest cardinal features of the human phenotype, including retinal degeneration, male infertility, obesity, and olfaction deficits, as reported for Bbs2, Bbs4, and Bbs6 knockout mouse models (18–22). Here, we report a previously uncharacterized BBS mouse model neuroanatomical phenotype, ventriculomegaly involving the third and lateral ventricles, thinning of the cerebral cortex, and reduction in the size of the corpus striatum and hippocampus. In addition, morphological abnormalities in the ependymal cell cilia lining the enlarged third ventricle of the Bbs1 mutant brain were observed. These results validate the efficacy of the Bbs1 M390R knockin mouse model for further elucidation of BBS pathophysiology.
Results
Generation of Bbs1M390R/M390R Knockin Mice.
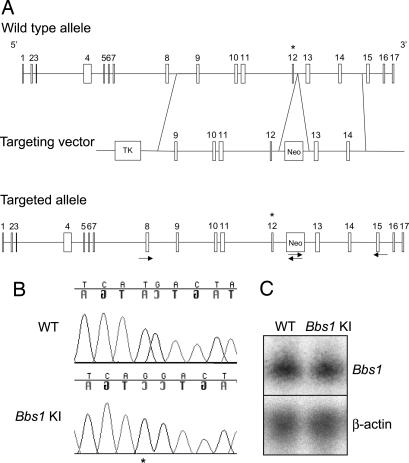
We targeted the Bbs1 gene in mice by constructing a vector containing regions of the mouse Bbs1 gene that replaced the normal methionine codon at position 390 in exon 12 with an arginine codon on homologous recombination (Fig. 1A). RT-PCR of cDNA amplified from the knockin mice confirmed that the M390R allele was spliced correctly without inclusion of the intronic neomycin cassette. Sequencing of the Bbs1M390R/M390R cDNA confirmed that the Bbs1 gene was modified with the incorporation of the homozygous methionine to arginine (ATG to AGG) change in the knockin line (Fig. 1B). Bbs1 mRNA expression levels in knockin mouse brains were comparable to those of wild-type mice as assessed by Northern blotting (Fig. 1C). Mating of Bbs1+/M390R heterozygous mice resulted in 25.8% of progeny homozygous for the knockin M390R allele (Pearson χ2 goodness of fit = 0.72). This is in contrast to the depressed frequency of homozygous null mutants for the Bbs2, Bbs4, or Bbs6 strains generated by our laboratory (18, 19, 21). This indicates that the Bbs1 M390R mutation does not result in embryonic or neonatal lethality.
Fig. 1.
Bbs1M390R/M390R knockin gene targeting. Bbs1 exon 12 (denoted with an asterisk) is replaced with an M390R-containing alternate exon on homologous recombination. Arrows indicate primers used for the 5′ and 3′ homologous recombination test (A). Sequencing of the entire Bbs1 cDNA of Bbs1 mutant animals confirms that the homozygous M390R (ATG to AGG) missense mutation was homologously recombined with integrity (asterisk) (B). Northern blot analysis of Bbs1 expression in 20 μg of total cellular RNA from wild-type (WT) and mutant brains by using a Bbs1 partial 5′ cDNA probe (Upper) and β-actin as a loading control (Lower) (C).
Bbs1 M390R Knockin Mice Lack Sperm Flagella and Do Not Develop Polydactyly or Renal Cysts.
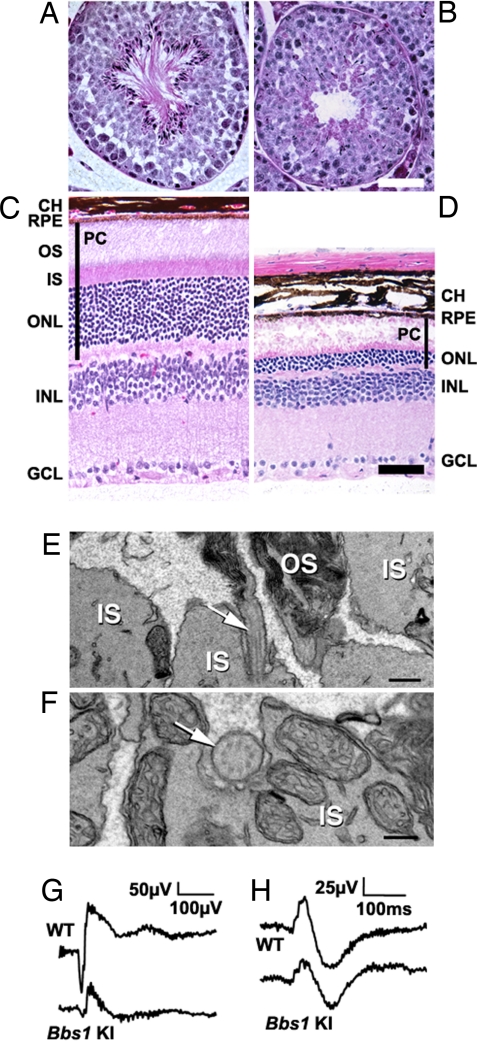
Although polydactyly and renal cysts are cardinal features of the human BBS phenotype, we did not observe forelimb or hindlimb abnormalities or renal cysts in the mutant mice analyzed in triplicate (data not shown). The absence of polydactyly has been noted in all of our BBS mouse strains, although renal cysts have been observed in Bbs2−/− and Bbs4−/− mice. Bbs1 mutant mice also exhibited a lack of social dominance (P < 0.001), partial anosmia (P = 0.0003), and a lack of sperm flagella (Fig. 2 A and B).
Fig. 2.
Sperm flagella loss and photoreceptor defects. Hematoxylin/eosin- (H&E)-stained 6-month-old wild-type (A) and mutant (B) seminiferous tubules show a lack of spermatozoa flagella. (Scale bar, 50 μm.) H&E-stained 6-month-old wild-type (C) and mutant (D) retinas show loss of the outer nuclear layer in Bbs1 knockin (KI) retinas and degeneration of photoreceptor inner and outer segments. (Scale bar, 50 μm.) TEM analysis of a 5-month-old mutant retina (E) shows disrupted morphology and disorientation of photoreceptor OS membranous discs. Connecting cilia are visible in sagittal sections (arrow). (Scale bar, 500 nm.) Connecting cilia were observed en face between the IS and the OS (F). (Scale bar, 200 nm.) Representative ERG measurement for wild-type and mutant mice at luminance 26.7 cd·s·m−2 showing reduced a- and b-wave amplitudes in the mutant animal (G). Representative ERG measurements of responses to photopic stimuli in wild-type and mutant mice. No significant difference was detected between the two genotypes (H). CH, choroid; RPE, retinal pigment epithelium; OS, outer segments; IS inner segments; ONL, outer nuclear layer; INL, inner nuclear layer; GCL, ganglion cell layer; PC, photoreceptor cells.
Bbs1 M390R Knockin Mice Undergo Photoreceptor Degeneration.
At 6 months of age, significant degeneration of the inner and outer segments of photoreceptor cells and the outer nuclear layer was observed in Bbs1 mutant mice (Fig. 2 C and D). Rhodopsin was mislocalized in the outer nuclear layer (data not shown), and severely disrupted morphology and disorientation of outer segment membranous discs were seen in the mutant retinas (Fig. 2E). Photoreceptor cells connecting cilia were observed occasionally en face between the mitochondria-rich inner segments and abnormal outer segment membranous discs (Fig. 2F). The normal 9 + 0 arrangement of axonemal microtubules appeared intact in Bbs1 M390R photoreceptor cells connecting cilia.
Electroretinograms (ERGs) of 11-week-old Bbs1 mutants were not significantly different from age-matched controls in amplitude or scotopic threshold response at the lowest scotopic luminance [supporting information (SI) Fig. 6A]. At higher scotopic luminance, there was significant attenuation in the a- (P < 0.001) and b-waves (P = 0.0021) (Fig. 2G and SI Fig. 6B). The b-wave was still graded with respect to luminance, suggesting a reduction in either the number or efficiency of rod photoreceptors. Photopic Vmax was lower (Fig. 2H) but not significantly so in mutant animals. There was a significant difference (P = 0.0038) in the variance of the photopic b-wave in mutants, suggesting an effect of the M390R mutation on the cone pathway, although the site of this effect remains ambiguous. The retina pigment epithelium- (RPE) generated c-wave amplitude was significantly reduced (P = 0.046) but was luminance-graded in mutants, suggesting this results from photoreceptor dysfunction rather than a dysfunction in the RPE itself. The sum of these ERG observations indicates the Bbs1 M390R mutation predominantly affects the number and/or function of the rod photoreceptor cells.
Obesity and Cardiovascular Phenotype.
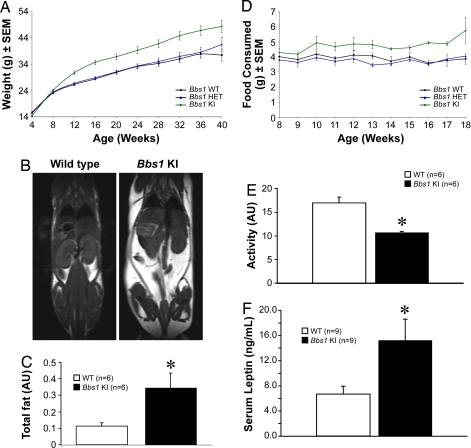
In addition to the cardinal human BBS features of male infertility, olfaction deficits, and retinal degeneration, Bbs1 mutant mice also become obese. The M390R mutation resulted in increased body weight (Fig. 3A). Magnetic resonance imaging (MRI) of 3.5- to 6-month-old animals revealed that the total fat content of the mutant mice was significantly elevated relative to controls (Fig. 3 B and C). The weight of fat depots in individual dissected tissues was measured. Significant increases in the fat content of brown adipose tissue, reproductive fat, perirenal fat, and omental fat validated the MRI data (SI Fig. 7). The increased fat mass in Bbs1 mutants was associated with high serum levels of the adipocyte-derived hormone leptin (Fig. 3F). Furthermore, Bbs1 mutants had increased food intake (Fig. 3D) and decreased locomotor activity (Fig. 3E). Alteration in both these parameters accounts for the obesity phenotype observed in these animals. Because the Bbs1 knockin mice used for telemetry were not visually impaired, vision loss is not the cause of the decreased locomotor activity (SI Fig. 8). Rather, it could be the consequence of decreased leptin signaling, because leptin increases locomotor activity (23), and Bbs1 knockin mice are hyperleptinemic, suggesting leptin resistance. Further experiments are required to demonstrate the primary cause of the decreased locomotor activity.
Fig. 3.
Obesity phenotype. Weight gain in male and female animals vs. age (minimum of 11 animals per group). Values are expressed as mean ± SEM. By week 12, homozygous mutant mice were significantly heavier than wild-type or heterozygous mice (A). Representative T1-weighted coronal MRI demonstrates an increase in fat mass in 3.5- to 6-month-old mutant mice vs. wild-type controls. Fat appears white, whereas muscle and water appear gray or black (B). Total fat (in arbitrary units, AU) quantified by ImageJ analysis of MRI data of wild-type (n = 6) vs. mutant (n = 6) animals (C). Average food consumption (male and female animals combined with a minimum of 11 animals per group, averaged) (D). Twenty-four-hour activity of wild-type (n = 6) vs. mutant (n = 5) mice measured by telemetry (E). Mutant mice exhibit significantly less locomotor activity than wild-type controls. Serum leptin levels are significantly elevated in mutant mice (F). *, P ≤ 0.05 vs. wild-type animals.
Finally, to test whether the mutant mice have the cardiac defects and hypertension commonly found in BBS patients, echocardiography and hemodynamic functions were measured in 3.5- to 6-month-old mutant and control mice. Bbs1 mutant mice had higher heart rates when compared with controls (SI Table 1). In contrast, no significant changes in mean arterial pressure or cardiac size and function were observed.
Neuroanatomical Defects.
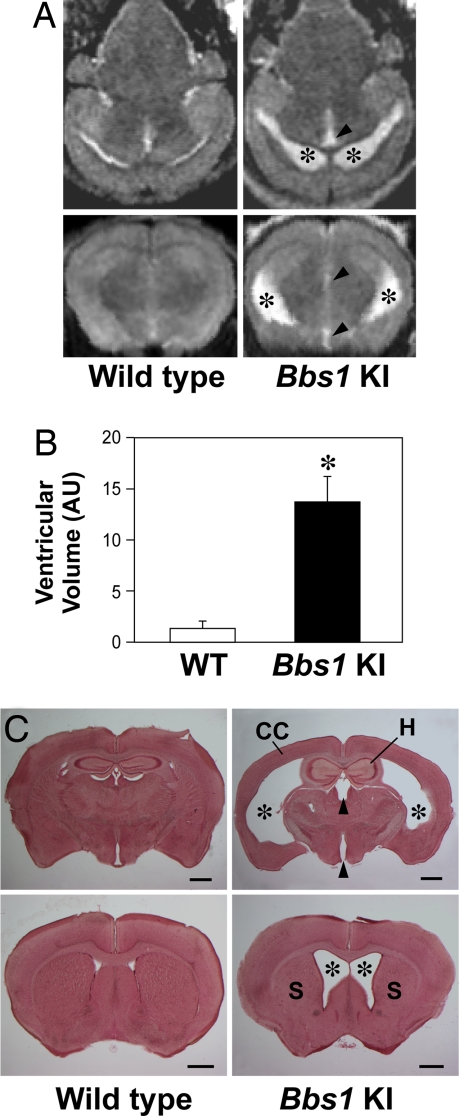
Bbs1 mutant mouse brains exhibited ventriculomegaly restricted to the lateral and third cerebral ventricles. Enlargement of the lateral ventricles was the most severe, whereas the increased size of the third ventricle was less pronounced. Moderately enlarged lateral ventricles and a reduced corpus striatum were seen as early as postnatal week 3 (SI Fig. 9). The pathology appeared to be progressive based on greater enlargement of the lateral and third ventricles of 3.5- to 6-month-old mutant animals as assessed by coronal MRI (Fig. 4A). Ventricular volumes were quantified by using ImageJ software (Fig. 4B) and further validated in counterstained coronal brain sections taken from the same mice (Fig. 4C). In addition to ventriculomegaly, we also observed thinning of the caudal half of the cerebral cortex and a reduction in the size of the corpus striatum and hippocampus (Fig. 4C). These neuroanatomical defects were also noted in Bbs2−/−, Bbs4−/−, and Bbs6−/− mice of comparable ages (SI Fig. 10). Sagittal MRI of all four BBS mutant mouse strains showed no gross enlargement of the fourth ventricle (data not shown). In addition, no gross morphological abnormalities in the skull or cerebellum were observed in any of the BBS mutant mouse strains (data not shown).
Fig. 4.
Neuroanatomical defects. Representative T1-weighted axial (A Upper) and coronal (A Lower) MRI demonstrating enlarged lateral (asterisk) and third (arrowhead) ventricles in 3- to 6.5-month-old mutant vs. wild-type controls. (B) Quantification of ventricular volumes from MRI data using ImageJ software. (C) Neutral red-stained 100-μm-thick coronal brain sections from mice used in the MRI study illustrate enlarged lateral and third ventricles, thinning of the cerebral cortex (CC), reduced hippocampus (H), and corpus striatum (S). (Scale bars, 1 mm.) *, P ≤ 0.05 vs. wild-type animals.
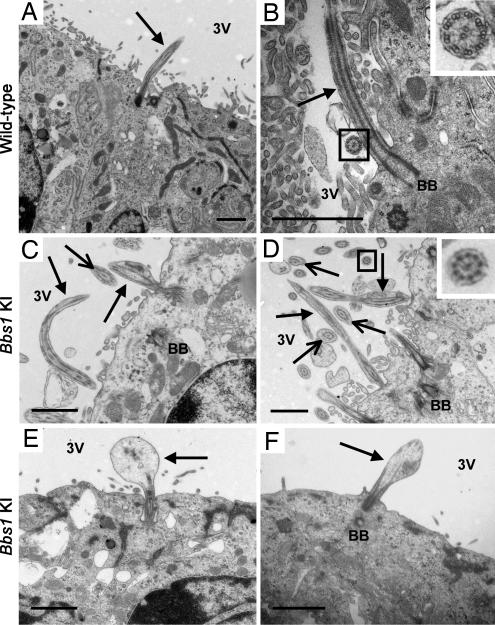
To better understand the underlying pathology of the enlarged ventricles in Bbs1 mutant mice, we used transmission electron microscopy (TEM) to examine the ependymal cell cilia that line the third ventricle. Ependymal cells line all of the cerebral ventricles and have numerous motile cilia, composed of 9 + 2 doublets of axonemal microtubules, that are thought to play a role in cerebrospinal fluid (CSF) circulation through the brain (24). We observed two types of ependymal cell cilia morphological defects in the mutant brains. Approximately 20% of the cilia were abnormally long, and 80% had swollen distal regions that contained vesicular aggregates (Fig. 5). Transverse sections of mutant ependymal cell cilia showed no abnormalities in the 9 + 2 axonemal arrangement of microtubules.
Fig. 5.
Ependymal cell cilia abnormalities. Electron micrographs of ependymal cell cilia lining the ventral portion of the third ventricle (adjacent to the arcuate nucleus of the hypothalamus) in wild-type mice (A and B) and Bbs1 mutant mice (C–F) demonstrate abnormal lengthening of cilia in Bbs1 mutant animals (C and D) and enlargement of the distal region of cilia (E and F). Solid arrows point to intact cilia in mutant mice (C–F). Open-head arrows point to transverse sections of abnormal cilia (C and D). The normal 9 + 2 axonemal arrangement of microtubules in transverse cilia sections from wild-type and Bbs1 M390R knockin mice is shown in higher magnification (Insets of B and D). [Scale bars, 1 μm (A–F).] BB, basal body; 3V, third ventricle.
Discussion
In this study, we present a phenotypic evaluation of an animal model of the most common BBS mutation, BBS1 M390R. These mice exhibit retinal degeneration, a lack of sperm flagella in males, decreased olfaction, and a lack of social dominance. They are obese, hyperphagic, and hyperleptinemic and show decreased locomotor activity. These phenotypes are typical of all BBS mouse models studied to date (18–22). Although their underlying cause is not yet fully understood, the phenotypes are consistent with the idea that BBS proteins are required for proper basal body/cilia/flagella synthesis and/or function (15, 16). Among the affected tissues, defective cilia have been associated with olfaction deficits (20), and abnormally long cilia have been observed in Bbs4−/− kidney cells and may play a role in renal cyst development in these mice (25). Loss of functional Bbs1, Bbs2, Bbs4, or Bbs6 proteins also appears to result in photoreceptor cell connecting cilia/intracellular transport dysfunction starting at the earliest stages of retinal development (26). The functional consequences of these anomalies are reflected in the aberrant ERG measurements described in the current study and support the observation of visual dysfunction in BBS patients harboring the M390R mutation (27).
The brain also contains numerous ciliated cells. Neuronal cilia are nonmotile and are thought to function in chemosensation and mechanosensation (28). Ependymal cells lining the cerebral ventricles possess numerous motile cilia and facilitate the circulation of CSF through the ventricles (24, 29). In this study, we observed a BBS mouse model phenotype that may be the consequence of aberrant ependymal cell cilia morphology and/or function. The loss of functional Bbs1, Bbs2, Bbs4, or Bbs6 resulted in severe enlargement of the lateral ventricles and, to a lesser degree, enlargement of the third ventricle, thinning of the cerebral cortex in the caudal region of the brain, and reduction in the size of the hippocampus and corpus striatum. One explanation for this phenotype is that brain atrophy or incomplete development of brain tissue results in a compensatory ex vacuo enlargement of the ventricles. A more likely alternative is that compression of the cerebral cortex, hippocampus, and corpus striatum may be a secondary effect of the enlarged ventricles. Closer inspection of the ependymal cell cilia lining the enlarged third ventricle in Bbs1 M390R knockin mice showed both elongated cilia and cilia with swollen distal regions, suggesting these abnormalities underlie the brain phenotype.
Studies of a number of knockout mouse models have shown that ciliary defects in ependymal cells can result in hydrocephalus, a condition characterized by impaired CSF flow, excess CSF production, and/or insufficient CSF resorption (30). In severe cases, this can lead to compression of the cerebral cortex and cerebellum and an enlarged dome-shaped head. In mice, the development of hydrocephalus has been correlated with defects in proteins associated with the ciliary membrane matrix (napa/hydin), ciliary axoneme-associated proteins (hydin/Spag6, Mdnah5), the intraflagellar (IFT) machinery (polaris), and other genes required for ciliogenesis, such as the transcription factor Rfx3 (30, 31). Further analysis of BBS mutant mice will help determine the initial events leading to the development of hydrocephalus such as CSF flow impediments, change in intracranial pressure, and the presence of cerebral aqueduct stenosis. Documentation of neuroantomical defects in BBS patients by brain imaging is limited. A recent study of three patients with BBS-like features reported evidence of cerebral cortical atrophy, cerebellar atrophy, lateral ventricle enlargement, temporal and parietal lobe hyperplasia, and microcephaly (32). However, genetic evidence of BBS mutations was limited or unavailable. A thorough correlation of BBS patient genotype and neuroanatomical phenotype will be necessary to explore further the connection between the human neuroanatomical findings and our mouse model.
Recently, BBS1 was found to be a component of a protein complex called the BBSome (16). BBS1 associates with Rabin 8, a guanosyl exchange factor for Rab 8, known for vesicular trafficking. Depletion of BBS1 in cultured RPE cells affected ciliogenesis by interfering with membrane trafficking. In the current study, intact arrangements of axonemal microtubules were found in two different types of cilia, motile and nonmotile, in two different cell types in Bbs1 M390R knockin mice. Based on these findings, Bbs1 may not be required for grossly normal axonemal microtubule structure. Rather, the M390R mutation may impair the completion of cilia assembly and/or function. This is consistent with the location of M390R mutation in a WD40-like protein motif that has been shown to be involved in vesicular trafficking, among other cellular functions (17).
In conclusion, BBS mouse models have proven to be valuable tools for studying the pathophysiology of BBS. Many of the phenotypes studied to date appear to be cilia-related. In this study, we present evidence for a previously undescribed neuroanatomical phenotype (ventriculomegaly) that appears to be caused by defective ependymal cell cilia. Continued use of BBS mouse models in functional studies will add to our understanding of the cilia- and noncilia-related aspects of the disorder.
Methods
Generation of Bbs1M390R/M390R Knockin Mice.
PCR was used to amplify 5′ and 3′ regions of the Bbs1 gene from 129/SvJ genomic DNA that were cloned into the targeting vector pOSDUPDEL (provided by O. Smithies, University of North Carolina, Chapel Hill). The linearized vector was electroporated into R1 embryonic stem (ES) cells (129 × 1/SvJ3 129S1/Sv). G418-resistant clones were screened by PCR to identify Bbs1-targeted ES cell lines. Two ES cell lines were used to produce chimeras. Mice were genotyped by PCR by using primers that both flanked and were internal to the targeted region of the gene. All studies adhered to guidelines established for the care and use of experimental animals and were approved by the Animal Care and Use Committee of the University of Iowa.
RNA Isolation and Northern Blot Analysis.
Total RNA was isolated from 3-month-old Bbs1 mutant and age-matched control mouse brains, electrophoresed, blotted, and hybridized as described (33). The probe was a 400-bp Bbs1 cDNA from exons 2 to 6. The blot was stripped of radioactivity and reprobed with β-actin as a loading control.
Social Dominance Test, Olfactory Test, Measurement of Arterial Pressure, Heart Rate, and Activity.
Histological Analysis of Bbs1 M390R Knockin Mice.
Hematoxylin/eosin staining of the eye and testes from 6-month-old Bbs1 mutant and age-matched controls was conducted as described (18). Photographs were taken by using an Olympus BX-41 microscope with a SPOT-RT digital camera.
Brain morphology studies of 3.5- to 6-month-old Bbs1 mutant animals (n = 3) and control animals (n = 3) were carried out as described (34). Sixty- to 100-μm coronal serial sections were stained with Neutral red and photographed with an Olympus SZX12 stereomicroscope.
TEM.
Electron micrographs of 7- to 8-month-old Bbs1 mutant brains (n = 3) and age-matched control mouse brains (n = 3) were obtained as described in ref. 33. Electron micrographs of at least three Bbs1 mutants and age-matched control retinas of various ages were obtained as described in ref. 26.
Electroretinography.
Electroretinography was conducted on 11-week-old Bbs1 M390R knockin mice (n = 6) and age-matched controls (n = 5) as described in SI Text.
Weight, Adiposity, and Food Consumption Analyses.
Food intake of individually caged Bbs1 mutant animals was compared with heterozygote and wild-type controls from 8 to 18 weeks of age using an average of 11 animals per group. Weight was recorded weekly beginning at weaning. To quantify individual fat tissues of mutant mice (n = 6) and wild-type mice (n = 6), different fat depots were dissected at death and weighed.
Leptin Assay.
Circulating leptin levels were analyzed in blood collected from adult Bbs1 mutant mice (n = 9) and control mice (n = 9). Plasma was obtained by centrifuging blood at 2,040 × g for 8 min. Concentration of murine leptin was measured by RIA using a commercially available kit (Crystal Chem).
MRI and Quantification of Fat and Brain Ventricles.
Imaging of body fat and the brain of 3.5- to 6-month-old Bbs1 M390R knockin mice (n = 3) and control mice (n = 3) by MRI was performed as described in SI Text. The volume of the brain ventricles was measured by using ImageJ software (National Institutes of Health).
Echocardiography.
Two-dimensional echocardiography was performed on 3- to 6-month-old control and Bbs1 M390R knockin mice (5–10 mice per group), as described in SI Text (35, 36).
Supplementary Material
Acknowledgments
We thank Dr. Larry Pinto and Brandon Invergo of Northwestern University for assistance with the ERG system, the University of Iowa Central Electron Microscopy Research Facility for use of the facility, Marissa Olvera for technical support, and Drs. Jian Huang and Kai Wang for helpful discussions. This work was supported by National Institutes of Health Grant R01-EY-11298 (to E.M.S. and V.C.S.); the Carver Endowment for Molecular Ophthalmology (E.M.S. and V.C.S.); Research to Prevent Blindness, New York (Department of Ophthalmology, University of Iowa); Foundation for Fighting Blindness (R.F.M.); and National Institutes of Health Grants K26RR017369, RR016652, and RR017838 (to R.M.W.). V.C.S. and E.M.S. are investigators of the Howard Hughes Medical Institute.
Footnotes
The authors declare no conflict of interest.
This article is a PNAS Direct Submission.
This article contains supporting information online at www.pnas.org/cgi/content/full/0708571104/DC1.
References
- 1.Katsanis N, Beales PL, Woods MO, Lewis RA, Green JS, Parfrey PS, Ansley SJ, Davidson WS, Lupski JR. Nat Genet. 2000;26:67–70. doi: 10.1038/79201. [DOI] [PubMed] [Google Scholar]
- 2.Slavotinek AM, Stone EM, Mykytyn K, Heckenlively JR, Green JS, Heon E, Musarella MA, Parfrey PS, Sheffield VC, Biesecker LG. Nat Genet. 2000;26:15–16. doi: 10.1038/79116. [DOI] [PubMed] [Google Scholar]
- 3.Nishimura DY, Searby CC, Carmi R, Elbedour K, Van Maldergem L, Fulton AB, Lam BL, Powell BR, Swiderski RE, Bugge KE, et al. Hum Mol Genet. 2001;10:865–874. doi: 10.1093/hmg/10.8.865. [DOI] [PubMed] [Google Scholar]
- 4.Mykytyn K, Braun T, Carmi R, Haider NB, Searby CC, Shastri M, Beck G, Wright AF, Iannaccone A, Elbedour K, et al. Nat Genet. 2001;28:188–191. doi: 10.1038/88925. [DOI] [PubMed] [Google Scholar]
- 5.Mykytyn K, Nishimura DY, Searby CC, Shastri M, Yen HJ, Beck JS, Braun T, Streb LM, Cornier AS, Fox GF, et al. Nat Genet. 2002;31:435–438. doi: 10.1038/ng935. [DOI] [PubMed] [Google Scholar]
- 6.Ansley SJ, Badano JL, Blacque OE, Hill J, Hoskins BE, Leitch CC, Kim JC, Ross AJ, Eichers ER, Teslovich TM, et al. Nature. 2003;425:628–633. doi: 10.1038/nature02030. [DOI] [PubMed] [Google Scholar]
- 7.Badano JL, Ansley SJ, Leitch CC, Lewis RA, Lupski JR, Katsanis N. Am J Hum Genet. 2003;72:650–658. doi: 10.1086/368204. [DOI] [PMC free article] [PubMed] [Google Scholar]
- 8.Chiang AP, Nishimura D, Searby C, Elbedour K, Carmi R, Ferguson AL, Secrist J, Braun T, Casavant T, Stone EM, Sheffield VC. Am J Hum Genet. 2004;75:475–484. doi: 10.1086/423903. [DOI] [PMC free article] [PubMed] [Google Scholar]
- 9.Fan Y, Esmail MA, Ansley SJ, Blacque OE, Boroevich K, Ross AJ, Moore SJ, Badano JL, May-Simera H, Compton DS, et al. Nat Genet. 36:989–993. doi: 10.1038/ng1414. [DOI] [PubMed] [Google Scholar]
- 10.Li JB, Gerdes JM, Haycraft CJ, Fan Y, Teslovich TM, May-Simera H, Li H, Blacque OE, Li L, Leitch CC, et al. Cell. 2004;117:541–552. doi: 10.1016/s0092-8674(04)00450-7. [DOI] [PubMed] [Google Scholar]
- 11.Nishimura DY, Swiderski RE, Searby CC, Berg EM, Ferguson AL, Hennekam R, Merin S, Welber RG, Biesecker LL, Stone EM, Sheffield VC. Am J Hum Genet. 2005;77:1021–1033. doi: 10.1086/498323. [DOI] [PMC free article] [PubMed] [Google Scholar]
- 12.Stoetzel C, Laurier V, Davis EE, Muller J, Rix S, Badano JL, Leitch CC, Salem N, Chouery E, Corbani S, et al. Nat Genet. 2006;38:521–524. doi: 10.1038/ng1771. [DOI] [PubMed] [Google Scholar]
- 13.Chiang AP, Beck JS, Yen HJ, Tayeh MK, Scheetz TE, Swiderski RE, Nishimura DY, Braun TA, Kim KY, Huang J, et al. Proc Natl Acad Sci USA. 2006;103:6287–6292. doi: 10.1073/pnas.0600158103. [DOI] [PMC free article] [PubMed] [Google Scholar]
- 14.Stoetzel C, Muller J, Laurier V, Davis EE, Zaghloul NA, Vicaire S, Jacquelin C, Plewniak F, Leitch CC, Sarda P, et al. Am J Hum Genet. 2007;80:1–11. doi: 10.1086/510256. [DOI] [PMC free article] [PubMed] [Google Scholar]
- 15.Blacque OE, Leroux MR. Cell Mol Life Sci. 2006;63:2145–2161. doi: 10.1007/s00018-006-6180-x. [DOI] [PMC free article] [PubMed] [Google Scholar]
- 16.Nachury MV, Loktev AV, Xhang Q, Westlake CJ, Peranen CJ, Merdes J, Slusarski DC, Scheller RH, Bazan JF, Sheffield VC, Jackson PK. Cell. 2007;129:1201–1213. doi: 10.1016/j.cell.2007.03.053. [DOI] [PubMed] [Google Scholar]
- 17.Li D, Roberts R. Cell Mol Life Sci. 2001;58:2085–2097. doi: 10.1007/PL00000838. [DOI] [PMC free article] [PubMed] [Google Scholar]
- 18.Mykytyn K, Mullins RF, Andrews M, Chiang AP, Swiderski RE, Yang B, Braun T, Casavant T, Stone EM, Sheffield VC. Proc Natl Acad Sci USA. 2004;101:8664–8669. doi: 10.1073/pnas.0402354101. [DOI] [PMC free article] [PubMed] [Google Scholar]
- 19.Nishimura DY, Fath M, Mullins RF, Searby C, Andrews M, Davis R, Andorf JL, Mykytyn K, Swiderski RE, Yang B, et al. Proc Natl Acad Sci USA. 2004;101:16588–16593. doi: 10.1073/pnas.0405496101. [DOI] [PMC free article] [PubMed] [Google Scholar]
- 20.Kulaga HM, Leitch CC, Eichers ER, Badano JL, Lesemann A, Hoskins BE, Lupski JR, Beales PL, Reed RR, Katsanis N. Nat Genet. 2004;36:994–998. doi: 10.1038/ng1418. [DOI] [PubMed] [Google Scholar]
- 21.Fath MA, Mullins RF, Searby C, Nishimura DY, Wei J, Rahmouni K, Davis RE, Tayeh MK, Andrews M, Yang B, et al. Hum Mol Genet. 2005;14:1109–1118. doi: 10.1093/hmg/ddi123. [DOI] [PubMed] [Google Scholar]
- 22.Eichers ER, Abd-El-Barr MM, Paylor R, Lewis RA, Bi W, Lin X, Meehan TP, Stockton DW, Wu SM, Lindsay E, et al. Hum Genet. 2006;120:211–226. doi: 10.1007/s00439-006-0197-y. [DOI] [PubMed] [Google Scholar]
- 23.Pellymounter MA, Cullen MJ, Baker MB, Hecht R, Winters D, Boone T, Collins F. Science. 1995;269:540–543. doi: 10.1126/science.7624776. [DOI] [PubMed] [Google Scholar]
- 24.Ibanez-Tallon I, Pagenstecher A, Flieguaf M, Olbrich H, Kispert A, Ketelsen U-P, North A, Heintz N, Omram H. Hum Mol Genet. 2004;13:2133–2141. doi: 10.1093/hmg/ddh219. [DOI] [PubMed] [Google Scholar]
- 25.Mokrzan EM, Lewis JS, Mykytyn K. Nephron Exp Nephrol. 2007;106:e88–e96. doi: 10.1159/000103021. [DOI] [PubMed] [Google Scholar]
- 26.Swiderski RE, Nishimura DY, Mullins RF, Olvera MA, Ross JL, Huang J, Stone EM, Sheffield VC. Invest Ophthalmol Vis Sci. 2007;48:3329–3340. doi: 10.1167/iovs.06-1477. [DOI] [PubMed] [Google Scholar]
- 27.Azari AA, Aleman TS, Cideciyan AV, Schwartz SB, Windsor EA, Sumaroka A, Cheung AY, Steinberg JD, Roman AJ, Stone EM, et al. Invest Ophthalmol Vis Sci. 2006;47:5004–5010. doi: 10.1167/iovs.06-0517. [DOI] [PubMed] [Google Scholar]
- 28.Fuchs JL, Schwark HD. Cell Biol Int. 2004;28:111–118. doi: 10.1016/j.cellbi.2003.11.008. [DOI] [PubMed] [Google Scholar]
- 29.Bruni JE, Del Bigio MR, Clattenburg RE. Brain Res Rev. 1985;9:1–19. doi: 10.1016/0165-0173(85)90016-5. [DOI] [PubMed] [Google Scholar]
- 30.Marshall WF, Nonaka S. Curr Biol. 2006;16:R604–R614. doi: 10.1016/j.cub.2006.07.012. [DOI] [PubMed] [Google Scholar]
- 31.Baas D, Meiniel A, Benadiba C, Bonnafe E, Meiniel O, Reith W, Durand B. Eur J Neurosci. 2006;24:1020–1030. doi: 10.1111/j.1460-9568.2006.05002.x. [DOI] [PubMed] [Google Scholar]
- 32.Rooryck C, Pelras S, Chatiel J-F, Cances C, Arveiler B, Verloes A, Lacombe D, Golzet C. Neuropediatrics. 2007;38:5–9. doi: 10.1055/s-2007-981466. [DOI] [PubMed] [Google Scholar]
- 33.Swiderski RE, Ying L, Cassell MD, Alward WLM, Stone EM, Sheffield VC. Mol Brain Res. 1999;68:64–72. doi: 10.1016/s0169-328x(99)00085-6. [DOI] [PubMed] [Google Scholar]
- 34.Agassandian K, Gedney M, Cassell MD. Brain Res. 2006;1076:78–86. doi: 10.1016/j.brainres.2006.01.009. [DOI] [PubMed] [Google Scholar]
- 35.Weiss RM, Ohashi M, Miller JD, Young SG, Heistad DD. Circulation. 2006;114:2065–2069. doi: 10.1161/CIRCULATIONAHA.106.634139. [DOI] [PubMed] [Google Scholar]
- 36.Hill JA, Karimi M, Kutschke W, Davisson RL, Zimmerman K, Wang Z, Kerber RE, Weiss RM. Circulation. 2000;101:2854–2862. doi: 10.1161/01.cir.101.24.2863. [DOI] [PubMed] [Google Scholar]
Associated Data
This section collects any data citations, data availability statements, or supplementary materials included in this article.


