Abstract
The loss of naïve T cells is a hallmark of immune aging. Although thymic involution is a primary driver of this naïve T cell loss, less is known about the contribution of other mechanisms to the depletion of naïve T cells in aging primates. We examined the role of homeostatic cycling and proliferative expansion in different T cell subsets of aging rhesus macaques (RM). BrdU incorporation and the expression of the G1-M marker Ki-67 were elevated in peripheral naïve CD4 and even more markedly in the naïve CD8 T cells of old, but not young adult, RM. Proliferating naïve cells did not accumulate in old animals. Rather, the relative size of the naïve CD8 T cell compartment correlated inversely to its proliferation rate. Likewise, T cell receptor diversity decreased in individuals with elevated naïve CD8 T cell proliferation. This apparent contradiction was explained by a significant increase in turnover concomitant with the naïve pool loss. The turnover increased exponentially when the naïve CD8 T cell pool decreased below 4% of total blood CD8 cells. These results link the shrinking naïve T cell pool with a dramatic increase in homeostatic turnover, which has the potential to exacerbate the progressive exhaustion of the naïve pool and constrict the T cell repertoire. Thus, homeostatic T cell proliferation exhibits temporal antagonistic pleiotropy, being beneficial to T cell maintenance in adulthood but detrimental to the long-term T cell maintenance in aging individuals.
Keywords: aging, CD8, homeostasis
The immune system undergoes dramatic age-related changes in both structure and function. Of these, the best investigated and the most pronounced are the changes affecting aging T cells. Age-related changes were seen in T cell subset representation and T cell diversity in humans (1–3) and experimental animals (4, 5) and have been associated with higher mortality in the aging humans (6, 7). Moreover, impaired T cell activation has been documented in senescent rodent and human T cells (8–11). Although the molecular lesions in T cell activation have been thoroughly studied, the picture of the age-related dysregulation of T cell populations is still emerging.
Optimal protection against new or evolving pathogens requires a reserve of naïve T cells. However, naïve T cell production is reduced in old age because of the involution of the thymus. The maintenance of the naïve T cell compartment is further challenged by the lifelong consumption of naïve cells that respond to acute and persistent infections and become memory T cells. With age, the balance between naïve and antigen-selected memory cells changes in favor of the latter, reducing the diversity of T cell receptors (TCRs). In fact, the aging naïve T cell population is reduced in both relative and absolute terms, suggesting that homeostatic mechanisms that maintain the size and the clonal diversity of the T cell repertoire progressively break down (12–14).
T cells can also be replenished by extrathymic mechanisms, which rely on homeostatic proliferation in the absence of manifest antigenic stimulation. Little is known about the role of homeostatic proliferation in the maintenance of naïve T cell pools in the aging host. A cross-comparison of young and elderly humans showed an increase in naïve CD4 cell cycling in the very old (15). In adult rodents depletion of naïve T cells initiates compensatory homeostatic cycling in the remaining naïve T cells, likely because of the surplus of maintenance cytokines, such as IL-7 (reviewed in ref. 16). Increased T cell cycling was also observed in primates with low CD4 counts upon simian immunodeficiency virus (SIV) infection (17). It remains unclear whether compensatory proliferation occurs during natural age-related loss of naïve cells and what the role is for this mechanism in the maintenance the TCR diversity.
To gain a clinically relevant insight into the homeostatic regulation of T cell subsets with aging, we have developed and characterized the rhesus macaque (Macaca mulatta, RM in the text) model of immune senescence (18, 19). This model recapitulates the changes in T cells of elderly humans, which are not seen in old rodents, particularly with regard to the expression patterns of CD28 (18, 20). Here we report on the role of homeostatic proliferation in the renewal of the naïve T cell compartment of old primates. We show that the extent of proliferation in the naïve T cell compartment correlates positively to age and negatively to the relative size of the naïve T cell pool in peripheral blood and to the TCR diversity. These results are discussed in light of the antagonistic pleiotropy theory of aging (21, 22).
Results
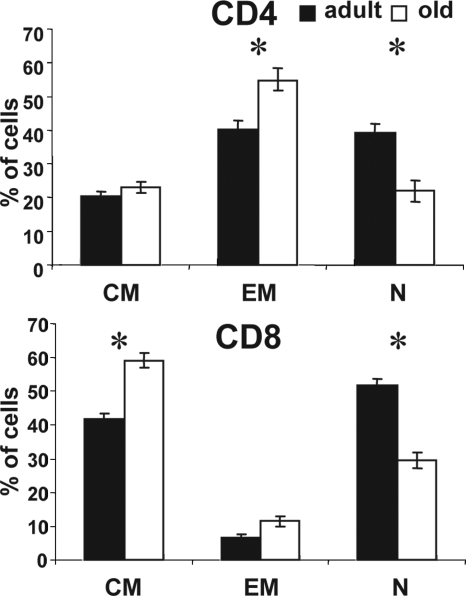
Significant age-dependent loss of naïve cells occurs in humans, non-human primates, and rodents (reviewed in refs. 13 and 23). To confirm this in our RM cohorts, we compared T cell phenotypes of peripheral blood mononuclear cells (PBMC) in young adult (6–9 years old) and aged (18–24 years old) RM. As previously published (18, 20), we defined CD28intCD95lo cells as naïve (N), the CD28hiCD95hi cells as central memory (CM), and the CD28loCD95hi cells as effector memory (EM) for both the CD4 and CD8 cells [supporting information (SI) Fig. 7]. Functional assays confirmed that CM and EM, but not N, cells can readily secrete TNFα and IFNγ upon short polyclonal stimulation with PMA and ionomycin (refs. 18–20 and data not shown). Old RM contained fewer naïve blood T cells in both the CD4+ and CD8+ subsets than the adult ones (Fig. 1), and this difference was statistically significant (P < 0.0001 for CD4 and P = 0.0012 for CD8). In accord with previous results (18–20), we observed a significant increase in CD4+ CM cells and CD8+ EM cells in the old RM cohort (Fig. 1) with no significant gender-related differences.
Fig. 1.
Replacement of naïve with memory T cells in old RM. Lymphocytes were gated on CD4 or CD8 subsets and analyzed for CD28 and CD95 expression (SI Fig. 7). Cells from each subset were gated into N (CD28intCD95lo), CM (CD28hiCD95hi), and EM (CD28loCD95hi) cells. Average percentages of each cell subset in young (n = 18, filled bars) and old (n = 36, open bars) RM are shown. Error bars indicate SEM. *, P < 0.05.
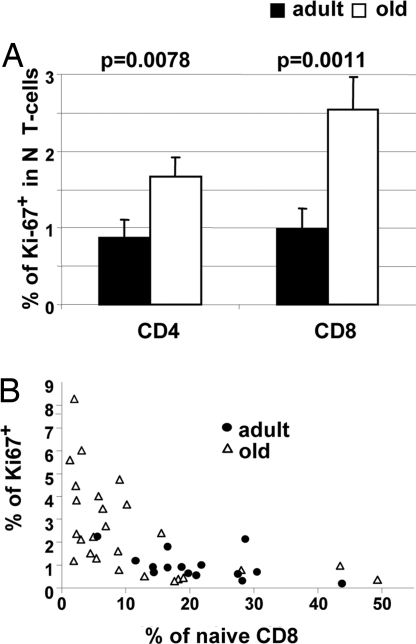
The response of T lymphocytes to natural or experimentally induced lymphopenia features a compensatory increase in cycling of the remaining cells (16, 24). It is unclear whether N T cell loss during normal aging leads to compensatory cell proliferation, whether it affects both major T cell subsets (CD4 and CD8), and whether and how this may impact the dynamics of the aged T cell compartment. Therefore, we examined the expression in the naïve subsets of CD4 and CD8 T cells of Ki-67, a marker expressed in the G1–M phases of the cell cycle that rapidly disappears in the G0 phase (25). Only ≈1% of N cells in each subset expressed Ki-67 in the adult cohort, in contrast to the 2- and 2.5-fold-larger Ki-67+ fraction among the old N CD4 (P = 0.0078) and CD8 (P = 0.0011), demonstrating a significantly higher cycling in old T cells (Fig. 2A).
Fig. 2.
Age-related and population size-related increase in homeostatic proliferation of naïve T cells. (A) Naïve CD4+ and CD8+ cells were analyzed for Ki-67 expression. Shown are the average percentages of Ki-67+ cells in naïve CD4 and naïve CD8 cells from young (n = 15, filled bars) or old (n = 25, open bars) RM. Error bars indicate SEM. (B) Percentage of naïve cells in the total CD8 pool of individual old (open triangles) or young (filled circles) animals are shown on the x axis, and the percentage of Ki-67+ cells in the naïve CD8 subset are shown on the y axis.
Our results were similar to the data by Naylor et al. (15) on human CD4 T cells. The critical question, not answered by their work, is whether the age-related naïve T cell loss is causally connected to increased proliferation of old naïve T cells. If so, one would expect that animals with the smallest N T cell compartment should exhibit the most pronounced naïve T cell proliferation. Consistent with that prediction, we found strong positive correlation between naïve T cell proliferation and shrinking of the N CD8+ (Fig. 2B) and N CD4+ (data not shown) pools in individual animals. To independently confirm these data, we redefined naïve CD8 T cells using alternative markers CCR-7, CD11a, and CD31 (20, 26) and measured Ki-67 expression in these populations. The results confirmed the correlation of N CD8 proliferation to the age and the size of the N pool regardless of the markers used to define N cells (SI Fig. 8).
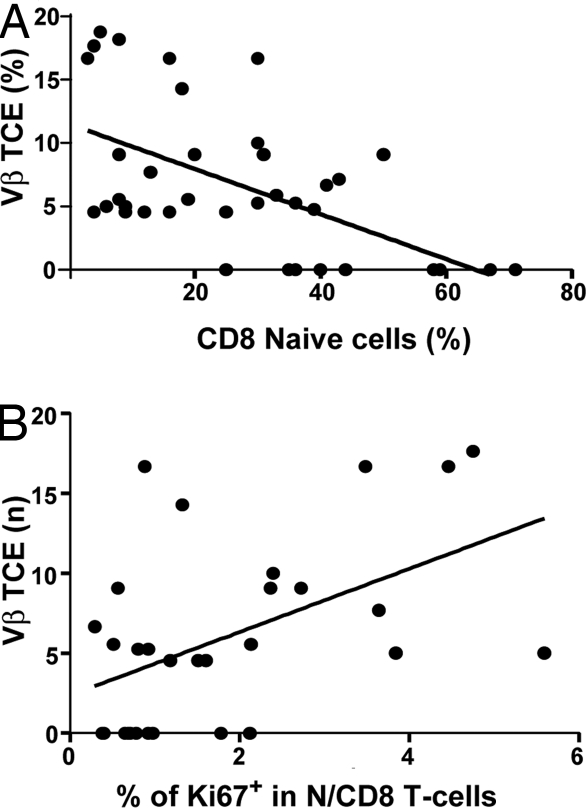
We also examined the TCR diversity in aging monkeys by analyzing the TCRVβ CDR3 length polymorphism (27). Vβ families exhibiting a single PCR peak were classified as containing T cell clonal expansions (TCE) and were quantified in each monkey as a correlate of T cell repertoire diversity loss. The percentage of Vβ families with a TCE was plotted for each animal against naïve T cell size and proliferation. Not surprisingly, the size of the naïve CD8 pools inversely correlated to the fraction of Vβ families exhibiting a TCE (Fig. 3A), confirming that the loss of naïve T cells results in an overall loss of TCR repertoire diversity. We next correlated Ki-67 expression in N CD8 T cells to the number of TCE+ Vβ families in our monkey cohort. TCE were more frequent in animals with high Ki-67+ N populations (Fig. 3B). Therefore, our data argue for a direct correlation between N CD8 proliferation and loss of TCR repertoire.
Fig. 3.
Occurrence of TCE correlates to the size of the N CD8 subset and its proliferation rate. RNA isolated from RM PBMCs was analyzed by PCR for TCR length polymorphism in each of the 24 V regions of the β TCR chain. Vβ families exhibiting a single peak were defined as TCE+, and their fraction among all PCR-identified Vβ families was expressed as Vβ TCE (%). Data were obtained for individual animals and correlated to the percentage of naïve CD8 cells (A) or the percentage of Ki-67+ cells in the N CD8 subset (B) of each animal.
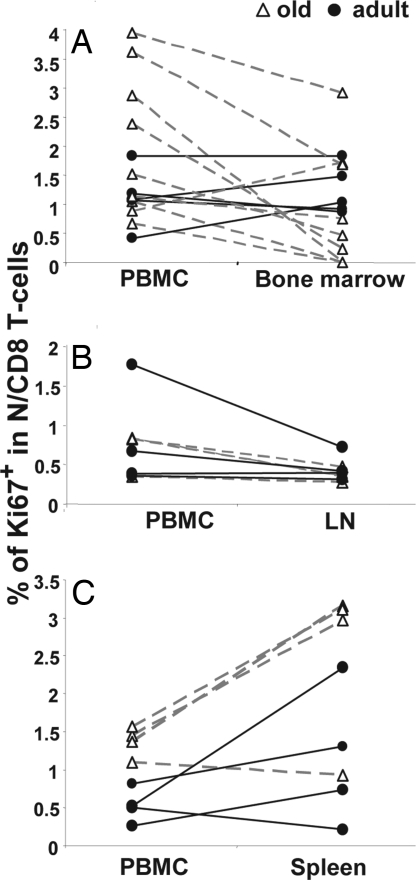
The increase in N T cell homeostatic proliferation in the blood of old animals could be specific for blood or representative of homeostatic proliferation in other peripheral lymphatic organs. To discern between these possibilities, we measured Ki-67 expression in N CD8+ cells derived from lymph nodes (Fig. 4A), bone marrow (Fig. 4B), and spleen (Fig. 4C) and compared them to the values obtained from parallel PBMC samples. The bone marrow (Fig. 4A) and lymph nodes (Fig. 4B) contained similar or lower percentages of proliferating N cells than PBMC in most of the animals. On the other hand, proliferation was generally higher in the spleen than in PBMC, and this effect was more pronounced with age (Fig. 4C). Therefore, elevated cycling of peripheral naïve T cells in old monkeys was not confined to blood, and spleen was likely the main site of age-related homeostatic N T cell proliferation.
Fig. 4.
Comparison of Ki-67 expression in naïve CD8 T cells in the blood to those in other compartments. Percentages of Ki-67+ naïve (CD28intCD95lo) CD8 T cells in the blood or bone marrow (A), axillary lymph node (B), or spleen (C) are shown on the y axis. Data from individual young (filled circles) or old (open triangles) RM are connected with solid black lines (young) or dashed gray lines (old).
An increase in proliferation should result in expansion of that cell subset provided that there is no cell loss. However, the increase in naïve T cell homeostatic proliferation was not matched by an increase in the naïve T cell pool but rather correlated to its decline (Fig. 2 and data not shown). To test whether naïve T cell turnover is increased in old monkeys, we used the BrdU pulse–chase approach. Cohorts of adult and old monkeys were pulsed with BrdU on days 0–3 and assayed for its incorporation/decay kinetic in blood T cells over time. In this analysis, BrdU+ cells are those that proliferated at any time over the 4 days of BrdU administration (the pulse), and they can be further differentiated into actively proliferating cells (Ki-67+BrdU+, cells that proliferated both at the time of the pulse, thus BrdU+, and also at the time of analysis, thus Ki-67+) and cells that ceased proliferating by the time of detection (Ki-67−BrdU+).
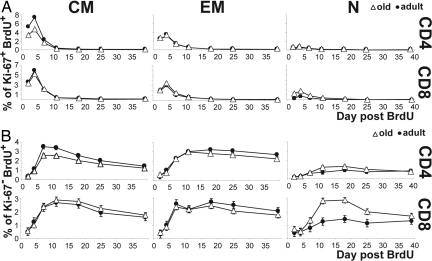
BrdU incorporation into actively proliferating (Ki-67+BrdU+) T cells peaked on the day after the BrdU pulse (day 4) and rapidly declined thereafter, with the highest overall proliferation in CM cells and the lowest overall proliferation in N cells, consistent with previous findings (20). Cross-age comparisons revealed no age-related differences in the Ki-67+BrdU+ kinetics in the EM subsets and an age-related decline in proliferation of CM CD4 (P < 0.0001) and CD8 (P = 0.0338) cells (Fig. 5A). Whereas the naïve T cells exhibited lower BrdU incorporation relative to CM and EM cells, CD4 and CD8 naïve subsets from old RM showed higher peak percentages of Ki-67+BrdU+ cells than those in young monkeys (Fig. 5A), and this difference was significant in the case of CD8 cells (P = 0.0073). This provided an independent confirmation of our Ki-67 results from Fig. 2.
Fig. 5.
BrdU kinetics in cells. Old (open triangles) and young (filled circles) monkeys were pulsed with 40 mg/kg BrdU on days 0, 1, 2, and 3, and PBMC were collected at indicated time points. Cells were stained for CD4, CD8, CD28, CD95, Ki-67, and BrdU and gated as shown in Fig. 1. The percentages of KI-67+BrdU+ (A) and KI-67−BrdU+ (B) cells were assessed in CM (Left), EM (Center), or N (Right) subsets of CD4 (Upper) or CD8 (Lower) subsets. Data points indicate averages from six independent experiments, each with at least two monkeys per age group. Error bars indicate SEM.
As might be expected, BrdU peaked somewhat later and was retained longer in cells that ceased proliferating by the time of detection (Ki-67− cells) (Fig. 5B). A significant (P = 0.0009) age-related decrease in the peak percentage of Ki-67−BrdU+ cells was observed in the CD4 CM cells, consistent with the data from Fig. 5A showing reduced Ki-67+BrdU+ labeling in old CM cells (Fig. 5B). Yet the most remarkable age-related difference was seen in the N cells, where the old RM had higher peak values of Ki-67−BrdU+ N cells compared with adult ones (Fig. 5B). The difference was significant in N CD8 cells (P < 0.0001) and showed the same trend, but no statistical significance, in the N CD4 cells (P = 0.0909). Interestingly, the peak of Ki-67−BrdU+ cells exceeded the peak of Ki-67+BrdU+ CD8 cells in old RM, arguing that Ki-67−BrdU+ N cells migrated into the blood after proliferating elsewhere. This was consistent with the high Ki-67+ values found in spleen N cells (Fig. 4C), suggesting that spleen was the main site of naïve T cell proliferation. Moreover, BrdU was lost more rapidly from the N CD8 cells of old animals than from their counterparts in young animals (P = 0.0003), as measured by comparing differences between the percentage of BrdU+ cells at the peak and at the end of the chase period.
Taken together our data showed that N CD8 and, to a lesser extent, N CD4 T cells in old animals exhibited higher proliferation and higher turnover than their young counterparts.
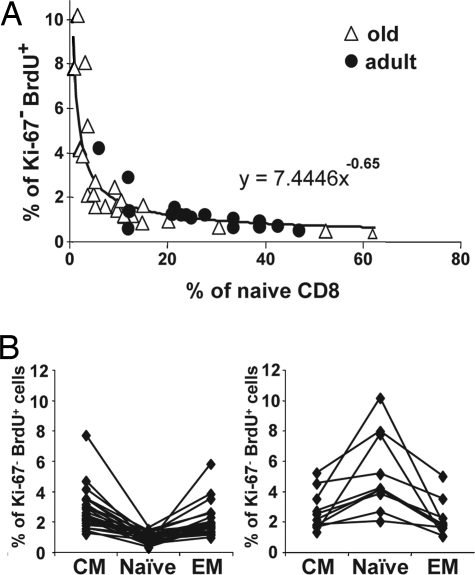
This, together with a decrease in the relative size of the N subset, suggested that elevated turnover comes with a N T cell loss that matches or exceeds the elevated proliferation in RM with small N CD8 pools. To define the relationship between turnover and the size of the N CD8 pool, we correlated the peak percentage of Ki-67−BrdU+ cells (day 18) to the relative size of N CD8+ pools in individual animals. We observed a clear relationship consistent with the loss of homeostatic control, so that a loss of naïve CD8 T cells progressively turned into a logarithmic increase in BrdU incorporation (Fig. 6). Importantly, whereas the vast majority of animals with reduced N CD8 T cell pool were old, adult outliers with few naïve T cells also showed high BrdU incorporation, and, conversely, old animals with preserved N T cells showed low N T cell proliferation. Thus, all 10 animals with <5% of naïve cells in the CD8 pool had >2% of BrdU+ cells, and six of seven animals with <3% of naïve CD8 cells had >4% of BrdU+ cells. On the other side of the spectrum, all animals with >30% of naïve cells had <1% of BrdU+ cells (Fig. 6A). Overall, there was a significant inverse association between the percentage of Ki-67−BrdU+ cells and the percentage of N CD8+ cells (P < 0.0001), so that for a 1% increase in the N CD8 T cell population there was a 0.65% decrease in the Ki-67− BrdU+ cells in the CD8 N population. Finally, we found that the animals with high turnover in the N CD8 gate (BrdU+ > 2%), exhibited a lower percentage of BrdU+ cells in the adjacent memory T cell gates (Fig. 6B), which excluded the possibility that the turnover increase observed in small N populations was an artifact caused by the contamination of the N cell gate with memory cells. Therefore, the turnover of N CD8 cells correlated inversely to the size of their pool regardless of the age of the animals. These results also ruled out the possibility that the proliferation of the naïve pool occurred as a bystander effect of a generalized increased in T cell turnover, i.e., because of an infection, which would be expected to affect more severely the memory pool. Similar results have been observed in the naïve CD4 population, but the correlation was less tight (data not shown).
Fig. 6.
Proliferation of naïve CD8 T cells is a function of the naïve CD8 pool size. (A) Cells obtained from the BrdU-pulsed animals shown in Figs. 3 and 4 were analyzed by flow cytometry on day 12 after BrdU pulse. The percentage of naïve cells in the total CD8 pool of individual old (open triangles) or young (filled circles) animals are shown on the x axis, and the percentage of Ki-67−BrdU+ cells in the naïve CD8 subset are shown on the y axis. (B) The percentage of Ki-67−BrdU+ cells in the N, CM, and EM subsets of CD8 T cells was assessed in animals shown in A. Values belonging to individual animals are connected, and, for illustration purposes, we have divided the groups into animals with <2% (Left) or >2% (Right) Ki-67−BrdU+CD8+ N cells. Labeling was higher in the CM and EM subsets in animals with <2% Ki-67−BrdU+CD8+ N cells (Left). Most importantly, animals with >2% of Ki-67−BrdU+ cells in the N CD8 subset have higher Ki-67−BrdU+ values in the naïve subset compared with either of the two memory subsets (Right).
Discussion
The results shown above document that the naïve T cell compartment in RM undergoes increased proliferation and turnover with age and that this increase correlates inversely to the size of the naïve T cell pool. Our results strongly argue that the age-specific increase in homeostatic proliferation is specific for naïve and not memory T cells and that its correlation to N pool size occurs regardless of the parameters used to define the naïve T cells. We thereby excluded alternative trivial explanations that the increase in Ki-67 or BrdU labeling reflects a general age-related increase in T cell turnover, a concurrent infection or other abnormality, or a contamination with memory cells from one of the adjacent flow cytometry gates. Because we used a CD8β-specific antibody for the detection of CD8 cells, we detected specifically CD8αβ+ T cells in our experiments, strongly suggesting that the CD8 subset was of thymic origin rather than gut-derived. We also aimed to examine immune reconstitution in young monkeys, and we observed that in vivo depletion of CD8+ cells by monoclonal antibodies resulted in a significant increase of Ki-67 expression in N CD8 cells (our unpublished observations). Thus, these results suggested that in monkeys under lymphopenia even young N cells react by homeostatic proliferation.
Because peak BrdU values among the blood N CD8 T cells were higher in Ki-67− cells than in Ki-67+ cells (Fig. 5 A and B Lower Left), our results indicate that active N proliferation did not occur in blood, and a survey of Ki-67 expression in relevant peripheral lymphatic tissues suggested that spleen may be a major site of homeostatic proliferation. RM spleens exhibited considerably higher absolute T cell counts than the blood or other organs sampled here. A soluble, short-acting mediator driving T cell proliferation would operate more effectively in a compartmentalized organ such as the spleen than systemically in the blood, which is consistent with our results. We interpret the above results to reveal the operation of a homeostatic mechanism that leads to increased cycling in the N T cell pool as the pool shrinks, perhaps as a consequence of increased availability of cytokines that regulate survival and cycling of N T cells (24). For example, IL-7 is believed to be the main regulator of N T cell turnover, and its administration to monkeys has been shown to increase N T cell proliferation (28). Based on our recent findings (19, 29, 30), the reduction in naïve T cell representation and diversity resulting from a mechanism of this kind would have the potential to adversely affect the induction of protective immunity.
In a study of human CD4 T cell maintenance in aging, Naylor et al. (15) have reported results consistent with a progressive decline in thymic output in humans, spanning the sixth and seventh decade of life, followed by a “catastrophic” loss of CD4 T cell diversity that could leave many old individuals vulnerable to infection. These authors also noted an increase in CD4 T cell proliferation. The loss of T cell diversity and the increase in CD4 T cell proliferation with age were not linear in that study but were described by the authors to exhibit a “threshold effect,” with a dramatic increase after 70 years of age (15).
We now provide results on the dysregulation of homeostasis in aged non-human primates that are consistent with and can explain much of the above data. We observed an increase in naïve T cell proliferation and turnover whereby the level of turnover increased exponentially with the decrease of N pool size. We explain these results in the context of homeostatic forces that govern the maintenance of peripheral T cell pools. Mild depletion of the naïve T cells is expected to induce a somewhat increased level of homeostatic naïve T cell cycling to maintain the compartment. However, the progressive depletion of the N pool at some point induces homeostatic proliferation where the naïve T cells turn over but also many become memory T cells (16, 28, 31); this further depletes the naïve pool. Indeed, the naïve cell numbers and their proliferation seen in our experiments are connected by a perfectly fitting exponential curve, which is best explained by the activation of a positive feedback loop that accelerates T cell loss once the naïve T cells are depleted beyond certain levels. Both the loss of N cells and the increase in their cycling correlated to the occurrence of TCE, and thus to the loss of TCR repertoire diversity, and are consistent with the existence of such a loop.
These results and the results of Naylor et al. (15) should also be considered from the standpoint of Williams's concept of antagonistic pleiotropy (21, 22), which has garnered renewed interest in the last decade from molecular and cellular biologists (reviewed in ref. 32). This concept states that mechanisms that operate earlier in life to ensure the fitness of the organism, and are therefore selected for in a population, often may exert multiple (pleiotropic) effects, which may, later in life, become unwanted. Because there is little selection in the postreproductive stage of life, these “antagonistic” effects are essentially unchecked and therefore lead to aging and age-associated dysfunction. By substituting the pleiotropic process (homeostatic proliferation) for a pleiotropic gene (Williams's original concept), one could speculate that homeostatic proliferation contributes to aging of the immune system via such an antagonistically pleiotropic mechanism. Homeostatic cycling would initially be useful for the maintenance of the naïve T cell repertoire in the face of increased consumption and reduced production, probably buying extra time for the organism to be fully defended against pathogens. Late in life, however, this mechanism will defeat its own purpose by exhausting the few remaining N cells. If so, one specific prediction of our work would be that, similar to the effects observed in keratinocyte growth factor-treated SIV-infected adult monkeys (33), successful treatment of T cell senescence by thymic or peripheral T cell rejuvenation will result in the lowering of cell turnover in the naïve T cell compartment.
Materials and Methods
Animals.
Colony-bred male and female RM (M. mulatta) of Indian origin were maintained according to federal, state, and local guidelines. All experiments were approved by the Animal Care and Use Committee at the Oregon National Primate Research Center. Animals with tumors, amyloidosis, or signs of clinical disease were excluded from the study. Cohorts consisted of 18 young adult (mean age = 6.8 years, range 6–9 years, 11 males and seven females) and 36 old (mean age = 21.8 years, range 18–25 years, 15 males and 21 females) RM. All animals were analyzed for T cell phenotype of their PBMC; randomized subsets of these animals were used for other assays as described below, with a minimum of 15 adults and 26 old RM per assay. Because the above RM are part of a longitudinal study, comparison of Ki-67 expression in the spleen and blood was analyzed on unrelated RM (four adult RM, mean age = 13.2 years, range 12–14 years; four old RM, mean age = 25.3 years, range 21–27 years).
BrdU Administration.
Fifteen adult and 30 old RM were randomly selected from the above cohort and injected with 2′-5′bromodeoxyuridine (Sigma–Aldrich) i.v. into the saphenous vein at 40 mg/kg for 4 consecutive days under ketamine anesthesia; blood was taken under anesthesia on days 2, 4, 7, 11, 18, 25, and 39 after the initial day of BrdU administration. BrdU incorporation into newly synthesized DNA of PBMC was monitored in conjunction with cell surface markers by flow cytofluorometry (see below).
Cell Preparation.
Blood collected in Na-heparin was differentially enriched by gradient centrifugation on Ficoll–Paque Plus (GE Health) according to the manufacturer's recommendations. Tissue samples were obtained in parallel by needle aspiration (bone marrow), surgical resection (lymph nodes), or elective necropsy (spleen). Single-cell suspensions were obtained by sterile organ homogenization followed by erythrocyte lysis with NH4Cl (0.84% wt/vol). All cells, except spleen and lymph node samples, were used in assays immediately upon collection. Spleen, lymph nodes, and their control blood samples were banked in liquid N2 in FBS supplemented with 10% DMSO.
Flow Cytofluorometry.
PBMC were stained for BrdU essentially as previously published (20) with the following modifications. Surface staining was performed with mAb against human CD4 (conjugated to PerCP-Cy5.5; Becton Dickinson, clone L200), anti-CD8β-ECD (Beckman Coulter, clone 2ST8.5H7), anti-CCR-7-PE-Cy7 (Becton Dickinson, clone 3D12), CD11a-APC (eBioscience, cloneHI100), anti-CD95-PE (eBioscience, clone DX2), and CD28-biotin (eBioscience, clone CD28.2) or CD31-biotin (Biolegend, clone WM59) followed by streptavidin–Alexa Fluor 700 (Molecular Probes). Surface-stained cells were fixed by using cytofix/cytoperm (Becton Dickinson) for 30 min, additionally permeabilized with cell wash (Becton Dickinson) supplemented with 10% DMSO for 20 min, and repeat-fixed with cytofix/cytoperm for 5 min. Cells were overnight (16 h) digested in 60 μl of cell wash supplemented with 0.28 mg of bovine pancreas-derived DNase (Sigma–Aldrich). For the analysis of Ki-67 expression in lymph node and bone marrow, random subsets from same animal cohorts were used. Intracellular staining was done with anti-Ki-67-FITC (Becton Dickinson, clone B56) and anti-BrdU-APC (Becton Dickinson, clone 3D4) for 30 min. Cells were analyzed by using an LSR-II instrument (Becton Dickinson) equipped with DiVa software and the FCS3.0 file system. Files were transferred and analyzed by using FlowJo software (version 8.2; TreeStar) on a Macintosh 10.3 operating system platform.
TCR Length Polymorphism Analysis.
RNA was isolated from 1 × 10⁶ to 5 × 10⁶ PBMC by using TriReagent (Sigma). cDNA was made by using RT-PCR and subjected to a set of 24 separate TCR Vβ-specific PCRs using previously published conditions (34, 35), except for forward primers used to detect Vβ3, Vβ5, and Vβ24, which were modified as follows: Vβ3, 5′-GCACAACAGTTCCCTGACTTGCAC-3′; Vβ5, 5′-TGTCTACTGGTACCAGCAGG-3′; Vβ24, 5′-ACAATGAAGCAGACACCCCT-3′. PCR products were separated by PAGE using a ABI prism 377 sequencer (Applied Biosystems) and analyzed by using Immunoscope software (Institut Pasteur, Paris). The percentage of Vβ families exhibiting a single PCR peak in each animal was calculated by comparing the number of TCE+ Vβ families with the number of successfully PCR-expanded families in each of the animals, and animals expanding <50% of their Vβ families were not included in the statistics.
Statistical Analysis.
A linear mixed model was used to examine the effect of aging and sex on the T cell subset distribution. For multiple comparisons, a Bonferroni-adjusted significance level was considered to control the family-wise error rate. Because the animals were measured at multiple time points over time, the mixed-effects models were used to analyze whether adult and old groups had similar temporal changes in BrdU value (percentage of cells detected). The covariance structure was assumed to have a first-order autoregressive, AR (1), based on the Bayesian information criterion. Two-sample t test analysis was used to determine the effect of aging in the percentage of Ki-67. Homogeneity of variance was tested by Levene's test, and Satterthwaite t statistics for unequal variance were used. The relation between the percentage of Ki-67−BrdU+ and the percentage of N CD8 counts was investigated by using simple linear regression. Because of the skewness of the data, the data were transformed by using a logarithm. All statistical data analysis was performed with Statistical Analysis System software (version 9.1; SAS), and P < 0.05 was considered statistically significant.
Supplementary Material
Acknowledgments
We thank Thomas Totonchy, Dan Allen, and Randa Mills for expert technical assistance and Miles Davenport for useful discussion. This research was supported by U.S. Public Health Service Awards AG21384 and AG23664 from the National Institute on Aging (to J.N.-Ž.), Deutsche Forschungsgemeinschaft Research Fellowship Ci-129/1-1 (to L.Č.-Š.), and Core National Primate Research Center Award RR 0163 from the National Center for Research Resources to the Oregon National Primate Research Center.
Footnotes
The authors declare no conflict of interest.
This article is a PNAS Direct Submission.
This article contains supporting information online at www.pnas.org/cgi/content/full/0705905104/DC1.
References
- 1.Hingorani R, Choi I-H, Akolka P, Gulwani-Akolkar B, Pergolizzi R, Silver J, Gregersen PK. J Immunol. 1993;151:5762–5769. [PubMed] [Google Scholar]
- 2.Posnett DN, Sinha S, Kabak S, Russo C. J Exp Med. 1994;179:609–617. doi: 10.1084/jem.179.2.609. [DOI] [PMC free article] [PubMed] [Google Scholar]
- 3.Wikby A, Maxson P, Olsson J, Johansson B, Ferguson FG. Mech Ageing Dev. 1998;102:187–198. doi: 10.1016/s0047-6374(97)00151-6. [DOI] [PubMed] [Google Scholar]
- 4.Callahan JE, Kappler JW, Marrack P. J Immunol. 1993;151:6657–6669. [PubMed] [Google Scholar]
- 5.LeMaoult J, Messaoudi I, Manavalan JS, Potvin H, Nikolich-Zugich D, Dyall R, Szabo P, Weksler ME, Nikolich-Zugich J. J Immunol. 2000;165:2367–2373. doi: 10.4049/jimmunol.165.5.2367. [DOI] [PubMed] [Google Scholar]
- 6.Wikby A, Ferguson F, Forsey R, Thompson J, Strindhall J, Lofgren S, Nilsson BO, Ernerudh J, Pawelec G, Johansson B. J Gerontol A Biol Sci Med Sci. 2005;60:556–565. doi: 10.1093/gerona/60.5.556. [DOI] [PubMed] [Google Scholar]
- 7.Hadrup SR, Strindhall J, Kollgaard T, Seremet T, Johansson B, Pawelec G, thor Straten P, Wikby A. J Immunol. 2006;176:2645–2653. doi: 10.4049/jimmunol.176.4.2645. [DOI] [PubMed] [Google Scholar]
- 8.Garcia GG, Miller RA. J Immunol. 2001;166:3151–3157. doi: 10.4049/jimmunol.166.5.3151. [DOI] [PubMed] [Google Scholar]
- 9.Effros RB. Exp Gerontol. 2004;39:885–890. doi: 10.1016/j.exger.2004.03.004. [DOI] [PubMed] [Google Scholar]
- 10.Vallejo AN, Brandes JC, Weyand CM, Goronzy JJ. J Immunol. 1999;162:6572–6579. [PubMed] [Google Scholar]
- 11.Ouyang Q, Wagner WM, Zheng W, Wikby A, Remarque EJ, Pawelec G. Exp Gerontol. 2004;39:607–613. doi: 10.1016/j.exger.2003.11.016. [DOI] [PubMed] [Google Scholar]
- 12.Fry TJ, Mackall CL. Springer Semin Immunopathol. 2002;24:7–22. doi: 10.1007/s00281-001-0092-5. [DOI] [PubMed] [Google Scholar]
- 13.Miller RA. Science. 1996;273:70–74. doi: 10.1126/science.273.5271.70. [DOI] [PubMed] [Google Scholar]
- 14.Linton PJ, Dorshkind K. Nat Immunol. 2004;5:133–139. doi: 10.1038/ni1033. [DOI] [PubMed] [Google Scholar]
- 15.Naylor K, Li G, Vallejo AN, Lee WW, Koetz K, Bryl E, Witkowski J, Fulbright J, Weyand CM, Goronzy JJ. J Immunol. 2005;174:7446–7452. doi: 10.4049/jimmunol.174.11.7446. [DOI] [PubMed] [Google Scholar]
- 16.Surh CD, Sprent J. Microbes Infect. 2002;4:51–56. doi: 10.1016/s1286-4579(01)01509-x. [DOI] [PubMed] [Google Scholar]
- 17.Ribeiro RM, Hazenberg MD, Perelson AS, Davenport MP. J Virol. 2006;80:802–809. doi: 10.1128/JVI.80.2.802-809.2006. [DOI] [PMC free article] [PubMed] [Google Scholar]
- 18.Jankovic V, Messaoudi I, Nikolich-Zugich J. Blood. 2003;102:3244–3251. doi: 10.1182/blood-2003-03-0927. [DOI] [PubMed] [Google Scholar]
- 19.Messaoudi I, Warner J, Fischer M, Park B, Hill B, Mattison J, Lane MA, Roth GS, Ingram DK, Picker LJ, et al. Proc Natl Acad Sci USA. 2006;103:19448–19453. doi: 10.1073/pnas.0606661103. [DOI] [PMC free article] [PubMed] [Google Scholar]
- 20.Pitcher C, Hagen S, Walker J, Lum R, Mitchell B, Maino V, Axthelm M, Picker LJ. J Immunol. 2002;168:29–43. doi: 10.4049/jimmunol.168.1.29. [DOI] [PubMed] [Google Scholar]
- 21.Williams GC. Evolution (Lawrence, Kans) 1957;11:398–411. [Google Scholar]
- 22.Gavrilov LA, Gavrilova NS. Sci World J. 2002;2:339–356. doi: 10.1100/tsw.2002.96. [DOI] [PMC free article] [PubMed] [Google Scholar]
- 23.Nikolich-Zugich J, Messaoudi I. Exp Gerontol. 2005;40:884–893. doi: 10.1016/j.exger.2005.06.007. [DOI] [PubMed] [Google Scholar]
- 24.Fry TJ, Mackall CL. J Immunol. 2005;174:6571–6576. doi: 10.4049/jimmunol.174.11.6571. [DOI] [PubMed] [Google Scholar]
- 25.Gerdes J, Lemke H, Baisch H, Wacker HH, Schwab U, Stein H. J Immunol. 1984;133:1710–1715. [PubMed] [Google Scholar]
- 26.Kimmig S, Przybylski G, Schmidt C, Laurisch K, Måwes B, Radbruch A, Thiel A. J Exp Med. 2002;195:789–794. doi: 10.1084/jem.20011756. [DOI] [PMC free article] [PubMed] [Google Scholar]
- 27.Pannetier C, Even J, Kourilsky P. Immunol Today. 1995;16:176–181. doi: 10.1016/0167-5699(95)80117-0. [DOI] [PubMed] [Google Scholar]
- 28.Moniuszko M, Fry T, Tsai WP, Morre M, Assouline B, Cortez P, Lewis MG, Cairns S, Mackall C, Franchini G. J Virol. 2004;78:9740–9749. doi: 10.1128/JVI.78.18.9740-9749.2004. [DOI] [PMC free article] [PubMed] [Google Scholar]
- 29.Messaoudi I, Lemaoult J, Guevara-Patino JA, Metzner BM, Nikolich-Zugich J. J Exp Med. 2004;200:1347–1358. doi: 10.1084/jem.20040437. [DOI] [PMC free article] [PubMed] [Google Scholar]
- 30.Messaoudi I, Warner J, Nikolich-Zugich D, Fischer M, Nikolich-Zugich J. J Immunol. 2006;176:301–308. doi: 10.4049/jimmunol.176.1.301. [DOI] [PubMed] [Google Scholar]
- 31.Goldrath A, Sivakumar P, Glaccum M, Kennedy M, Bevan M, Benoist C, Mathis D, Butz E. J Exp Med. 2002;195:1515–1522. doi: 10.1084/jem.20020033. [DOI] [PMC free article] [PubMed] [Google Scholar]
- 32.Campisi J. Mech Ageing Dev. 2002;123:567–573. doi: 10.1016/s0047-6374(02)00006-4. [DOI] [PubMed] [Google Scholar]
- 33.Seggewiss R, Lore K, Guenaga FJ, Pittaluga S, Mattapallil J, Chow CK, Koup RA, Camphausen K, Nason MC, Meier-Schellersheim M, et al. Blood. 2007;110:441–449. doi: 10.1182/blood-2006-12-065623. [DOI] [PMC free article] [PubMed] [Google Scholar]
- 34.Pannetier C, Cochet M, Darche S, Casrouge A, Zoller M, Kourilsky P. Proc Natl Acad Sci USA. 1993;90:4319–4323. doi: 10.1073/pnas.90.9.4319. [DOI] [PMC free article] [PubMed] [Google Scholar]
- 35.Chen Z, Kou Z-C, Shen L, Reimann K, Letvin NL. J Immunol. 1993;151:2177–2187. [PubMed] [Google Scholar]
Associated Data
This section collects any data citations, data availability statements, or supplementary materials included in this article.


