Abstract
Skeletal muscle constitutes ≈40% of the human body mass, and alterations in muscle mass and strength may result in physical disability. Therefore, the elucidation of the factors responsible for muscle force development is of paramount importance. Excitation–contraction coupling (ECC) is a process during which the skeletal muscle surface membrane is depolarized, causing a transient release of calcium from the sarcoplasmic reticulum that activates the contractile proteins. The ECC machinery is complex, and the functional role of many of its protein components remains elusive. This study demonstrates that deletion of the gene encoding the sarcoplasmic reticulum protein JP45 results in decreased muscle strength in young mice. Specifically, this loss of muscle strength in JP45 knockout mice is caused by decreased functional expression of the voltage-dependent Ca2+ channel Cav1.1, which is the molecule that couples membrane depolarization and calcium release from the sarcoplasmic reticulum. These results point to JP45 as one of the molecules involved in the development or maintenance of skeletal muscle strength.
Keywords: calcium release, excitation–contraction coupling
In skeletal muscle excitation–contraction coupling (ECC), an electrical signal (sarcolemma depolarization) is converted to a chemical signal (a transient increase in the intracellular calcium concentration) (1, 2), which ultimately leads to muscle contraction, a vital human function that is often diminished in the elderly, impairing their quality of life (3). ECC occurs at the triad, a structure made up of two membrane compartments where two interacting macromolecular complexes containing two distinct Ca2+ channels intimately involved in ECC are located. The voltage-gated Ca2+ channel Cav1 is localized in the transverse (T) tubule membranes, and the ryanodine receptors (RyR) are the calcium-release channel localized in the SR terminal cisternae membranes (4–10). The Cav1 is a heterooligomeric complex made up of at least four subunits: Cav1.1, β1a, α2–δ, and γ (11–15). The pore-forming Cav1.1 is an integral membrane protein and is indispensable for ECC, the cytosolic β1a and α2–δ subunits have regulatory functions, and the role of the γ-subunit has yet to be clearly defined (12, 15, 16). The β1a subunit associates tightly with Cav1.1 by binding to the α-interacting domain (17) and plays a crucial role in plasma membrane expression of Cav1.1. Targeting of Cav1.1 at the triad results from the cooperation of a sequence located in the COOH domain of Cav1.1 (18–20) with other domains/polypeptides. T tubule depolarization evokes intramembrane Cav1.1 charge movement (21), which is transmitted to the RyR to initiate ECC. Contractile proteins are activated by SR terminal cisternae calcium release via RyR opening (22).
In addition to the calcium-release channel (RyR), the SR and T tubule membranes also have a variety of proteins that, because of their subcellular location, are thought to contribute to ECC (23, 24). They are involved in (i) calcium storage (calsequestrin) (25), (ii) signal transduction (triadin TD, junctin JC, mitsugumin-29, JP45) (23, 24, 26, 27), (iii) calcium homeostasis (Ca2+ pump, Na/Ca exchanger) (28), and (iv) maintenance of SR spatial organization and integrity (junctophilin) (29). Our previous studies (24, 30) demonstrated that JP45, an integral protein constituent of the skeletal muscle SR junctional face membrane, interacts with Cav1.1 and the luminal calcium-binding protein calsequestrin (30, 31). Cav1.1 and JP45 form a complex that is down-regulated during aging and may contribute to decayed muscle strength and physical disability in the elderly (31, 32). On the basis of these initial observations, we reasoned that skeletal muscle strength may depend not only on the composition and functional integrity of the contractile apparatus but also on the molecular composition of the ECC machinery. To test this hypothesis, we created a JP45 knockout (KO) animal model and examined the functional and biochemical properties of skeletal muscles from young JP45 KO mice and age-matched wild-type littermates.
Results and Discussion
Phenotype of the JP45 KO Mice.
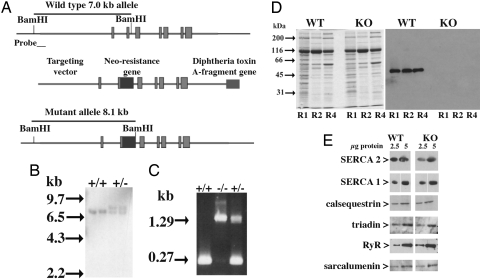
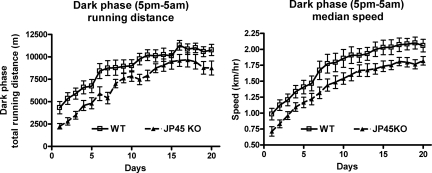
The absence of JP45 in the skeletal muscle of the mutant mice was confirmed by Western blot analysis of SR membranes isolated from JP45 KO and wild-type mice (Fig. 1D). The ablation of JP45 is not associated with major alterations in other SR proteins (Fig. 1E). Homozygous JP45 KO mice did not exhibit either a lethal phenotype or defects in embryonic or postnatal development. To look for a skeletal muscle phenotype, we analyzed the animals using a voluntary running wheel setup. The mice had free access to the wheel at any time of day. This experimental approach avoids potential problems linked to the effect of circadian rhythm on animal activity and/or animal compliance in performing nonvoluntary motor activity. We assessed spontaneous dark-phase (17.00– 5.00 h) motor activity of 3-month-old wild-type and JP45 KO mice (Fig. 2). In the first week, the total running distance of the wild-type mice was approximately double that of the JP45 KO mice. Two weeks of training improved skeletal muscle performance in both groups. After 3 weeks of training, the total running distance increased 2- to 3-fold until it plateaued at ≈9–10 kilometers per night for both sets of mice, although the total running distance remained significantly lower in the JP45 KO mice (Mann–Whitney test, two-tailed, P < 0.05). We also found that the median cruise speed of the JP45 KO mice was significantly lower that that of the wild-type mice (Mann–Whitney test, two-tailed, P < 0.05).
Fig. 1.
Generation of JP45 KO mice. (A) Targeting vector construction strategy. (B) Southern blot analysis of genomic DNA from ES cells of mutant mice according to Nishi et al. (27). (C) PCR analysis of genomic DNA from wild-type and JP45 KO mice. (D) SR R1, R2, and R4 fraction proteins (10 μg) separated by SDS/PAGE and stained with Coomassie BB (Left) and anti-JP45 Ab (Right). (E) Western blot analysis of SR fraction proteins with anti-SR proteins.
Fig. 2.
Spontaneous activity of JP45 KO mice. Shown is dark-phase spontaneous activity in 12-week-old wild-type (squares) and JP45 KO (triangles) mice individually housed in cages equipped with a running wheel. Data points are expressed as mean ± SEM (n = 10–13 mice). P < 0.05 (Mann–Whitney two-tailed test).
Mechanical Properties of Intact Skeletal Muscle from Wild-Type and JP45 KO Mice.
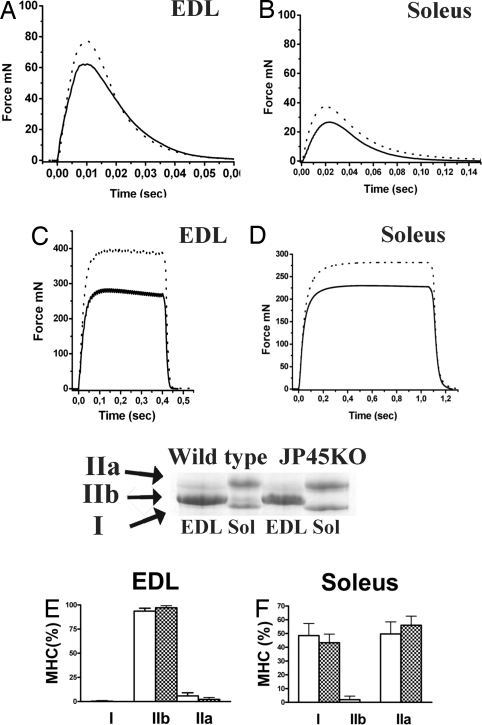
The reduced speed and total running distance among the JP45 KO mice may be associated with decreased muscle strength (33) resulting from alterations in their ECC machinery caused by the lack of JP45. To investigate this possibility, we studied the mechanical properties of intact extensor digitorum longus (EDL) and soleus muscles from wild-type and JP45 KO mice (Fig. 3 A–D). Analysis of muscle contraction revealed significant differences in JP45 KO mice. Their EDL and soleus muscles exhibited decreased twitch and maximal tetanic absolute force compared with wild-type mice, whereas their contraction and relaxation kinetics did not differ significantly (Table 1). The reduced absolute force observed in their skeletal muscles cannot be attributed to loss of contractile protein content, because the wet weight of their EDL and soleus muscles did not significantly differ from those of wild-type mice. The myofibril area in EDL and soleus muscles also did not differ significantly between JP45 KO and wild-type mice [supporting information (SI) Fig. 6]. The muscle specific force (maximal tetanic force normalized to muscle cross-sectional area) of EDL and soleus muscles from JP45 KO mice was also significantly impaired. EDL maximal tetani recorded in JP45 KO (287 ± 38.6 mN·mm−2, mean ± SD, n = 22) are ≈25% lower than those recorded in wild-type mice (381 ± 46.7 mN·mm−2, n = 13, P < 0.05). A similar decrease in maximal tetanic force generation was observed in solei from JP45 KO (244 ± 41.6, n = 22) compared with wild-type (301 ± 46.7, n = 13) mice (P < 0.05). Specific tetanic force decreased in single, intact flexor digitorum brevis (FDB) muscle fibers to an extent similar to that in EDL and soleus whole-muscle contraction, but the calcium sensitivity of the contractile proteins, tested in the same fiber after chemical skinning, did not differ significantly in JP45 KO compared with wild-type mice (SI Fig. 7). The decrease in force output is not due to fast-to-slow fiber transition because we observed no changes in the expression of myosin heavy chain (MHC) isoforms in EDL (E) and soleus (F) muscles. EDL from JP45 KO and wild-type mice expresses predominantly MHC IIb, whereas soleus expresses mainly MHC I and IIa. No gross alterations in the overall microscopic structure were observed in JP45 KO mice (data not shown).
Fig. 3.
Mechanical properties of skeletal muscle from wild-type and JP45 KO mice. (A–D) Shown is twitch (A and B) and maximal tetanus force (C and D) recorded in wild-type (dotted line) and JP45 KO (continuous line) mice. (E) SDS/PAGE of MHC from wild-type and JP45 KO mice. (F and G) MHC isoforms in EDL (F) and soleus (G).
Table 1.
Mechanical properties of EDL and soleus muscles of wild-type and JP45 KO mice
| Muscle | Twitch |
Tetanus |
|||||||||
|---|---|---|---|---|---|---|---|---|---|---|---|
| Time to peak, ms | Half-time to peak, ms | Half-relaxation time, ms | Absolute force, mN | Half-contraction time, ms | Half-relaxation time, ms | Absolute force, mN | Muscle wet weight, mg | Muscle length, mm | Specific force, mN/mm2 | Mouse body weight, g | |
| EDL | |||||||||||
| Wild type | 9.9 ± 1.5 | 3.2 ± 0.6 | 10.5 ± 2.1 | 71 ± 16.3 | 20.0 ± 2.1 | 20.9 ± 1.8 | 339 ± 39.06 | 11.9 ± 1.7 | 12.9 ± 1.0 | 381 ± 46.7 | 30.0 ± 3.5 |
| JP45 KO | 9.3 ± 0.9 | 3.1 ± 0.3 | 11.3 ± 2.0 | 59 ± 9.7* | 19.0 ± 2.6 | 19.6 ± 1.7 | 281 ± 36.08** | 12.2 ± 1.1 | 12.2 ± 0.6 | 287 ± 38.6** | 28.7 ± 2.7 |
| Soleus | |||||||||||
| Wild type | 18.9 ± 2.5 | 5.2 ± 0.7 | 26 ± 4.2 | 31 ± 6.8 | 36.8 ± 6.7 | 53.1 ± 5.1 | 263 ± 28.39 | 10.6 ± 1.0 | 11.8 ± 0.8 | 301 ± 46.7 | |
| JP45 KO | 18.6 ± 3.1 | 5.5 ± 0.9 | 24.5 ± 5.1 | 25 ± 6.7* | 34.9 ± 7.4 | 55.5 ± 3.8 | 235 ± 42.9* | 11.0 ± 1.2 | 11.0 ± 0.8 | 244 ± 41.6** | |
Values are presented as mean ± SD. n = 13 (wild type) and 22 (JP45 KO).
*, P < 0.05;
**, P < 0.001 (significant differences between JP45 KO mice and wild-type controls, unpaired two-tailed t test).
Ablation of JP45 Decreases Cav1.1 Density in Sarcotubular Membranes.
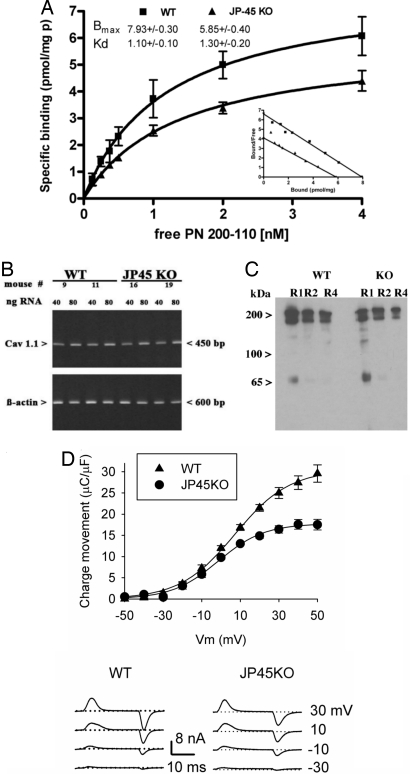
Because the decreased muscle strength observed in JP45 KO mice cannot be explained by loss of contractile proteins or changes in MHC isoforms, we thought that it might be linked to alterations of the ECC mechanism. We reasoned that the site of such alterations might be the supramolecular complex made up of Cav1.1 and RyR. Cav1.1 is the voltage sensor, which generates charge movement that is transmitted to the RyR to initiate the calcium release necessary to activate muscle contraction. Because JP45 forms a complex with Cav1.1 (30), we investigated whether the decreased muscle function caused by JP45 ablation was related to alterations in the expression of Cav1.1. Fig. 4 shows that, indeed, chronic JP45 depletion is accompanied by a decrease in the density of Cav1.1 in the sarcotubular membranes, as indicated by radioligand binding assays with the high-affinity Cav1.1 probe [3H] PN200-110 (Fig. 4A). Scatchard analysis of [3H] PN200-110 isothermal equilibrium binding to isolated sarcotubular membranes from JP45 KO and wild-type mice shows that the former have a significant decrease in PN200-110 Bmax with no alteration of its dissociation constant [Bmax, pmol/mg of protein = 5.8 ± 0.40 vs. 7.9 ± 0.30, mean ± SD (n = 11 for JP45 KO and wild-type, respectively); Kd = 1.3 ± 0.20 vs. 1.1 ± 0.10 nM, mean ± SD (n = 11 for JP45 KO and wild-type mice, respectively)]. The decrease of PN200-110 binding in the sarcotubular membranes from JP45 KO mice is not due to differences in recoveries of T tubules membrane because we did not observe a difference in the content of the T tubule membrane marker albumin in the isolated sarcotubular membrane fractions from wild-type and JP45 KO mice (SI Fig. 8). Semiquantitative RT-PCR with Cav1.1-specific primers suggests that the decrease in Cav1.1 density is not linked to alterations in Cav1.1 gene transcription (Fig. 4B).
Fig. 4.
Ablation of JP45 reduces Cav1.1 charge movement and membrane density. (A) Sarcotubular R1 fraction 3H-PN200-110 equilibrium binding. Data points represent mean ± SD of 10–14 determinations carried out in three different R1 fraction preparations, which contain membrane vesicles deriving from T tubules (37). SERCA1 expression, used as a marker of light SR membranes (R1) and a reference for PN200-110 binding, did not differ significantly in JP45 KO and wild-type mouse muscles. (B) Semiquantitative RT-PCR. The figure represents three experiments with RNA extracted from two different hind limb muscle preparations. (C) Sarcotubular membrane proteins (15 μg) were separated by SDS/PAGE and stained with affinity-purified anti-Cav1.1. (D Upper) Charge-movement vs. membrane voltage (Vm) relationship recorded in FDB fibers from wild-type (n = 15) and JP45 KO (n = 16) mice. Data points, expressed as mean ± SEM, were fitted to a Boltzmann equation. Best-fitting parameters are shown in Table 2. (D Lower) Illustrative charge-movement recordings. Membrane potential is shown on the right. Dotted lines represent the baseline.
Electrophysiological Properties of Skeletal Muscle Fibers from Wild-Type and JP45 KO Mice.
The decreased Cav1.1 membrane density in the skeletal muscle from JP45 KO mice causes modifications in the fiber's electrophysiological properties; in fact, we found a reduction in the asymmetric capacitive current, which results in a 40% decrease in maximal Cav1.1 gating charge in intact FDB fibers (Fig. 4D) without significantly affecting charge movement half-activation potential (Table 2). These results together with previous studies on JP45 overexpression (30, 34) indicate that the stoichiometry of JP45–Cav1.1 subunit exhibited by mature skeletal muscle is crucial for maintaining the molecular and functional expression of the Cav1.1 subunit (31).
Table 2.
Best-fitting parameters describing the voltage dependence of charge movement and intracellular Ca2+ release in FDB fibers from wild-type and JP45 KO mice
| Mice | Charge movement* |
Intracellular Ca2+ release† |
||||
|---|---|---|---|---|---|---|
| Qmax, μC/μF | V1/2Q, mV | K | ΔF/Fmax | V1/2F, mV | K | |
| Wild type | 30.5 ± 3.4 | 7.6 ± 0.92 | 14.2 ± 1.8 | 17.8 ± 2.6‡ | 6.4 ± 0.75 | 12.0 ± 1.5 |
| JP45 KO | 0.61 ± 0.08 | 12.9 ± 0.19 | 15.4 ± 1.8 | 0.39 ± 0.06‡ | 13.0 ± 0.15 | 16.3 ± 1.9 |
Values are mean ± SEM.
‡, P < 0.01 (statistically significant differences between wild type and JP45 KO).
*n = 15 (wild type) and 16 (JP45 KO) fibers.
†n = 17 (wild type) and 20 (JP45 KO) fibers.
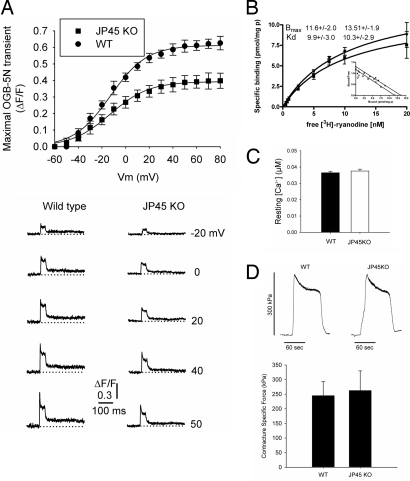
Because the Cav1.1 charge movement is the activating signal for RyR1-mediated calcium release from the SR, we performed experiments to evaluate whether depolarization-induced calcium release from the SR of JP45 KO mice is also affected. We found that the peak depolarization-induced calcium release is significantly decreased in JP45 KO fibers (Fig. 5A). The flux amplitudes JT (μM·ms−1) and JS (μM·ms−1) were 181 ± 13 and 115 ± 18 for fibers from wild-type mice and 108 ± 17 and 68 ± 7.3 for fibers from JP45 KO mice, respectively (P < 0.05). The decreased depolarization-induced calcium release is apparently not due to reduced RyR1 calcium-release channel density because Scatchard analysis of [3H]ryanodine binding to heavy SR fractions revealed no changes (Bmax values were 11.60 ± 2.0 and 13.51 ± 1.9 pmol/mg of protein for wild-type and JP45 KO mice, respectively) (Fig. 5B). The lack of significant differences in their resting calcium concentrations indicates that myoplasmic calcium-buffer capacity is preserved in JP45 KO mice (Fig. 5C). A nonsignificant difference in Ca ATPase activity in the light SR fraction supports this conclusion (SI Fig. 9).
Fig. 5.
Ablation of JP45 reduced maximal voltage-dependent SR Ca2+ release. (A Upper) SR Ca2+ release in FDB fibers from wild-type (n = 17) and JP45 KO (n = 20) mice. Data points (mean ± SEM) were fitted to a Boltzmann equation. (A Lower) OGB-5N transients in FDB fibers from wild-type and JP45 KO mice in response to various command pulses corresponding to the steepest part of the fluorescence/membrane voltage relationship. (B) [3H]Ryanodine binding to heavy SR fractions from wild-type and JP45 KO mice. Points represent the mean ± SD of five to eight determinations in two different R4 fraction preparations. (C) Fura-2 resting Ca2+ concentration measurements in FDB fibers from wild-type (n = 72 fibers) and JP45 KO (n = 71) mice did not differ significantly. (D Upper) Typical contractures in response to 1 mM 4-CmC in FDB fibers from wild-type (n = 8) and JP45 KO (n = 11) mice. (D Lower) Differences are not statistically significant.
We also investigated 4-chloro-m-cresol-induced force output in single, intact FDB fibers to finely assess maximal SR-releasable calcium (35). We found no differences in force generation between wild-type and JP45 KO muscle fibers induced by the RyR1 agonist 4-chloro-m-cresol (Fig. 5D). On the basis of 4-chloro-m-cresol-induced force experiments, we are confident that the reduction in voltage-dependent calcium release is not a result of SR calcium-store depletion but rather of altered Cav1.1expression.
The most important and novel finding of this report is the demonstration that alterations to the molecular composition of the ECC machinery resulting from JP45 depletion are sufficient to induce a 20–30% decrease in skeletal muscle strength in young animals. In addition, this study elucidates the underlying molecular mechanism(s) responsible for the decay of muscle strength in JP45 KO mice. It unambiguously shows that the decrease in muscle strength is not due to changes in muscle fiber types or contractile protein properties but to alterations of the signal transduction machinery between Cav1.1 and RyR1 at the T tubule/SR junction. We believe that the crucial switch is the activating calcium signal from the SR, which is then delivered to the contractile proteins. Altering the components of this switch may affect global muscle function. This conclusion is supported by the data demonstrating that reduced membrane depolarization due to impaired functional expression of Cav1.1 reduces calcium release. The molecular basis of the reduction in Cav1.1 functional expression is likely linked to protein–protein interactions occurring within the EC-coupling macromolecular complex. Membrane targeting of Cav1.1 depends on amino acid sequences contained within the COOH terminal domain and in the I–II loop of the Cav1.1 (20). JP45 interacts with both Cav1.1 domains involved in membrane targeting (31), and the lack of these interactions may interfere with either proper Cav1.1 membrane targeting or the stabilization of the Cav1.1 complex in the T tubular membrane. In conclusion, this study provides new insights into some mechanism(s) responsible for diminished muscle strength.
Experimental Procedures
Generation of JP45 KO Mice.
JP45 KO mice were generated as previously described (27). A mouse genomic library (from Stratagene) was screened with a cDNA probe to isolate genomic clones encompassing the 5′ end of the JP45 gene. A targeting vector was constructed by using a 5′-end JP45 genomic clone, Neo-resistance, and the diphtheria toxin gene DT-A as positive-selection and negative-selection cassettes, respectively (Fig. 1A). A SalI-linearized vector was used to transfect J1 mouse ES cells, and 140 ES clones carrying a homologous recombination were identified by Southern blot screening (Fig. 1B). JP45+/− mice were backcrossed three times in a C57BL6 background and then intercrossed to obtain JP45−/− mice. Genotyping was carried out by PCR using the following primers: JP45F2, 5′-TAA AGA CAG AGA CCA CAT CCT CCC-3′; JP45R4, 5′-GAC AAG GGG TGT GGG GTA TGA GGC-3′ (Fig. 1C).
DNA and RNA Manipulation.
Nucleic acid manipulation was carried out as previously described (27, 36).
Microsomal Preparation and Biochemical Analysis.
The isolation of SR membrane fractions (37), SDS/PAGE, and Western blot analysis were carried out as described by Anderson et al. (30). [3H] PN200-110 and [3H]ryanodine binding was carried out according to Anderson et al. (38). Curve fitting was performed by using Prism4 software (GraphPad). MHC band separation was performed as described by Talmadge and Roy (39), and densitometry was analyzed with the NIH ImageJ1.36 software.
In Vivo and in Vitro Muscle Strength Assessment.
Animals were individually housed in cages equipped with a running wheel carrying a magnet. Wheel revolutions were registered by a reed sensor connected to an I-7053D Digital-Input module (Spectra), and the revolution counters were read by a standard laptop computer via an I-7520 RS-485-to-RS-232 interface converter (Spectra). Digitized signals were processed by the “mouse running” software developed at Santhera Pharmaceuticals. To test force in vitro, EDL and soleus muscles were dissected and mounted into a muscle testing setup (Heidelberg Scientific Instruments). Muscle force was digitized at 4 kHz by using an AD Instruments converter and stimulated with 15-V pulses for 0.5 ms. EDL tetanus was recorded in response to 400-ms pulses at 10–120 Hz, whereas, for soleus, 1,100-ms pulses at 10–150 Hz were applied. Specific force was normalized to the muscle cross-sectional area [CSA = wet weight (mg)/length (mm) × 1.06 (density mg/mm3)] (40).
Cell Electrophysiology and Optical Recordings.
FDB fibers from wild-type and JP45 KO were enzymatically dissociated, plated, and recorded as previously described (41). For whole-cell patch clamp, the composition of the pipette solution was 140 mM Cs-aspartate, 5 mM Mg-aspartate2, 10 mM Cs2EGTA [ethylene glycol-bis(α-aminoethyl ether)-N,N,N′N′-tetraacetic acid], and 10 mM Hepes [N-(2-hydroxyethyl)piperazine-N′-(2-ethanesulfonic acid)]. The pH was adjusted to 7.4 with CsOH. The external solution contained 145 mM tetraethylammonium hydroxide (TEA)·Cl, 10 mM CaCl2, 10 mM Hepes, and 0.001 mM tetrodotoxin. Solution pH was adjusted to 7.4 with TEA·OH.
For charge-movement recording, calcium current was blocked by adding 0.5 Cd2+ plus 0.3 La3+ to the external solution (8, 32). We recorded the charge movement corresponding to gating of the Cav1.1 channel. To this end, we used a protocol consisting of a 2-s prepulse to −30 mV and a subsequent 5-ms repolarization to a pedestal potential of −50 mV followed by a 25-ms depolarization from −50 mV to 50 mV with 10-mV intervals (8, 31). Intramembrane charge movements were calculated as the integral of the current in response to depolarizing pulses and are expressed per membrane capacitance (coulombs per farad). For analysis of the relationship between charge movement and membrane voltage, data points were fitted to a Boltzmann equation of the form Qon = Qmax/[1 + exp(VQ1/2 − Vm)/K], where Qmax is the maximum charge, Vm is the membrane potential, VQ1/2 is the charge movement half-activation potential, and K is the steepness of the curve. The best-fitting parameters are included in Table 1. For intracellular Ca2+ recording, the fiber-holding potential was −80 mV, and the duration of the command pulses was 40 ms to better display the steady component of the SR release function. The pipette solution contained 20 mM Cs2EGTA and 500 μM Oregon Green Bapta (OGB)-5N (Invitrogen). OGB-5N transients were recorded by using a laser scanning confocal microscope (Radiance 2100; Bio-Rad/Zeiss) in linescan mode. Images were converted into fluorescence intensity. SR Ca2+ release flux was calculated by using a single-compartment model as described (42). The software for these calculations was kindly provided by J. Vergara (University of California, Los Angeles). Resting Ca2+ concentration was measured by using fura-2AM as the Ca2+ probe in enzymatically dissociated FDB fibers. Ratios of the fluorescence recorded at 380- and 340-nm excitation wavelengths were converted into Ca2+ concentration following published procedures (43). Force recordings in single, intact FDB muscle fibers were as previously described (44, 45).
Statistical Analysis.
Statistical analysis was performed by using Student's unpaired t test and the Mann–Whitney U test when values were not normally distributed. P < 0.05 was considered significant.
Supplementary Material
Acknowledgments
We thank Dr. Werner Melzer for critically reading the manuscript. We gratefully acknowledge Anne-Sylvie Monnet's technical support. This work was supported by the Department of Anesthesia, Basel University Hospital; the Swiss Muscle Foundation; the Japanese Society for the Promotion of Science; grants from Programmi di Ricerca Scientifica di Rilevante Interesse Nazionale 2005, Fondo per gli Investimenti della Ricerca di Base 2001, and Consiglio Nazionale delle Ricerche (to F.Z.); grants from the National Institutes of Health/National Institute on Aging (AG13934 and AG15820) and the Muscular Dystrophy Association (to O.D.); the Wake Forest University Claude D. Pepper Older Americans Independence Center (Grant P30-AG21332); and Association Francaise contres les Myopathies.
Footnotes
The authors declare no conflict of interest.
This article is a PNAS Direct Submission.
This article contains supporting information online at www.pnas.org/cgi/content/full/0707389104/DC1.
References
- 1.Ríos E, Pizarro G. Physiol Rev. 1991;71:849–908. doi: 10.1152/physrev.1991.71.3.849. [DOI] [PubMed] [Google Scholar]
- 2.Melzer W, Herrmann-Frank A, Lüttgau H C. Biochim Biophys Acta. 1995;1241:59–116. doi: 10.1016/0304-4157(94)00014-5. [DOI] [PubMed] [Google Scholar]
- 3.Schneider EL, Guralnik JM. J Am Med Assoc. 1990;263:2335–2340. [PubMed] [Google Scholar]
- 4.Nakai J, Dirksen RT, Nguyen HT, Pessah IN, Beam KG, Allen PD. Nature. 1996;380:72–75. doi: 10.1038/380072a0. [DOI] [PubMed] [Google Scholar]
- 5.Nakai J, Sekiguchi N, Rando TA, Allen PD, Beam KG. J Biol Chem. 1998;273:13403–13406. doi: 10.1074/jbc.273.22.13403. [DOI] [PubMed] [Google Scholar]
- 6.Grabner M, Dirksen RT, Suda N, Beam KG. J Biol Chem. 1999;274:21913–21919. doi: 10.1074/jbc.274.31.21913. [DOI] [PubMed] [Google Scholar]
- 7.Franzini-Armstrong CA, Jorgensen AO. Annu Rev Physiol. 1994;56:509–534. doi: 10.1146/annurev.ph.56.030194.002453. [DOI] [PubMed] [Google Scholar]
- 8.Adams BA, Tanabe T, Mikami A, Numa S, Beam KG. Nature. 1990;346:569–572. doi: 10.1038/346569a0. [DOI] [PubMed] [Google Scholar]
- 9.Hamilton SL. Cell Calcium. 2005;38:253–260. doi: 10.1016/j.ceca.2005.06.037. [DOI] [PubMed] [Google Scholar]
- 10.Kovacs L, Rios E, Schneider MF. Nature. 1979;279:391–396. doi: 10.1038/279391a0. [DOI] [PubMed] [Google Scholar]
- 11.Birnbaumer L, Qin N, Olcese R, Tareilus E, Platano D, Costantin J, Stefani E. J Bionenerg Biomembr. 1998;30:357–375. doi: 10.1023/a:1021989622656. [DOI] [PubMed] [Google Scholar]
- 12.Catterall WA. Annu Rev Biochem. 1995;64:493–531. doi: 10.1146/annurev.bi.64.070195.002425. [DOI] [PubMed] [Google Scholar]
- 13.Lacerda AE, Kim HS, Ruth P, Perez-Reyes E, Flockerzi V, Hofmann F, Birnbaumer L, Brown AM. Nature. 1991;352:527–530. doi: 10.1038/352527a0. [DOI] [PubMed] [Google Scholar]
- 14.Leung AT, Imagawa T, Campbell KP. J Biol Chem. 1987;262:7943–7946. [PubMed] [Google Scholar]
- 15.Snutch TP, Reiner PB. Curr Opin Neurobiol. 1992;2:247–253. doi: 10.1016/0959-4388(92)90111-w. [DOI] [PubMed] [Google Scholar]
- 16.Tsien RW, Ellinor PT, Horne WA. Trends Pharmacol Sci. 1991;12:349–354. doi: 10.1016/0165-6147(91)90595-j. [DOI] [PubMed] [Google Scholar]
- 17.Pragnell M, De Waard M, Mori Y, Tanabe T, Snutch TP, Campbell KP. Nature. 1994;368:67–70. doi: 10.1038/368067a0. [DOI] [PubMed] [Google Scholar]
- 18.Chien AJ, Zhao X, Shirokov RE, Puri TS, Chang CF, Sun D, Rios E, Hosey MM. J Biol Chem. 1995;270:30036–30044. doi: 10.1074/jbc.270.50.30036. [DOI] [PubMed] [Google Scholar]
- 19.Flucher BE, Kasielk N, Grabner M. J Cell Biol. 2000;151:467–478. doi: 10.1083/jcb.151.2.467. [DOI] [PMC free article] [PubMed] [Google Scholar]
- 20.Flucher BE, Weiss RG, Grabner M. Proc Natl Acad Sci USA. 2002;99:10167–10172. doi: 10.1073/pnas.122345799. [DOI] [PMC free article] [PubMed] [Google Scholar]
- 21.Schneider MF, Chandler WK. Nature. 1973;242:244–246. doi: 10.1038/242244a0. [DOI] [PubMed] [Google Scholar]
- 22.Marx SO, Ondrias K, Marks AR. Science. 1998;281:818–821. doi: 10.1126/science.281.5378.818. [DOI] [PubMed] [Google Scholar]
- 23.Zhang L, Kelley J, Schmeisser G, Kobayashi YM, Jones LR. J Biol Chem. 1997;272:23389–23397. doi: 10.1074/jbc.272.37.23389. [DOI] [PubMed] [Google Scholar]
- 24.Zorzato F, Anderson AA, Ohlendieck K, Froemming G, Guerrini R, Treves S. Biochem J. 2000;351:537–543. [PMC free article] [PubMed] [Google Scholar]
- 25.MacLennan DH, Wong PT. Proc Natl Acad Sci USA. 1971;68:1231–1235. doi: 10.1073/pnas.68.6.1231. [DOI] [PMC free article] [PubMed] [Google Scholar]
- 26.Kim KC, Caswell AH, Talvenheimo JA, Brandt NR. Biochemistry. 1990;29:9281–9289. doi: 10.1021/bi00491a025. [DOI] [PubMed] [Google Scholar]
- 27.Nishi M, Komazaki S, Kurebayashi N, Ogawa Y, Noda T, Iino M, Takeshima H. J Cell Biol. 1999;147:1473–1480. doi: 10.1083/jcb.147.7.1473. [DOI] [PMC free article] [PubMed] [Google Scholar]
- 28.Bers DM. Nature. 2002;415:198–205. doi: 10.1038/415198a. [DOI] [PubMed] [Google Scholar]
- 29.Takeshima H, Komazaki S, Nishi M, Iino M, Kangawa K. Mol Cell. 2002;6:11–22. doi: 10.1016/s1097-2765(00)00003-4. [DOI] [PubMed] [Google Scholar]
- 30.Anderson AA, Treves S, Biral D, Betto R, Sandonà D, Ronjat R, Zorzato F. J Biol Chem. 2003;278:39987–39992. doi: 10.1074/jbc.M305016200. [DOI] [PubMed] [Google Scholar]
- 31.Anderson AA, Altafaj X, Zheng Z, Wang Z-M, Delbono O, Ronjat M, Treves S, Zorzato F. J Cell Sci. 2006;119:2145–2155. doi: 10.1242/jcs.02935. [DOI] [PMC free article] [PubMed] [Google Scholar]
- 32.Wang Z-M, Messi ML, Delbono O. Biophys J. 2000;78:1947–1954. doi: 10.1016/S0006-3495(00)76742-7. [DOI] [PMC free article] [PubMed] [Google Scholar]
- 33.Brooks SV, Faulkner JA. Med Sci Sports Exercise. 1994;26:432–439. [PubMed] [Google Scholar]
- 34.Gouadon E, Schuhmeier RP, Ursu D, Anderson AA, Treves S, Zorzato F, Lehmann-Horn F, Melzer W. J Physiol. 2006;572:269–280. doi: 10.1113/jphysiol.2005.104406. [DOI] [PMC free article] [PubMed] [Google Scholar]
- 35.Kabbara AA, Allen DG. Cell Calcium. 1999;25:227–235. doi: 10.1054/ceca.1999.0023. [DOI] [PubMed] [Google Scholar]
- 36.Treves S, Franzini-Armstrong C, Moccagatta L, Arnoult C, Grasso C, Schrum A, Ducreux S, Zhu MX, Mikoshiba K, Girard T, et al. J Cell Biol. 2004;166:537–548. doi: 10.1083/jcb.200404079. [DOI] [PMC free article] [PubMed] [Google Scholar]
- 37.Saito A, Seiler S, Chu A, Fleischer S. J Cell Biol. 1984;99:875–885. doi: 10.1083/jcb.99.3.875. [DOI] [PMC free article] [PubMed] [Google Scholar]
- 38.Anderson K, Cohn AH, Meissner G. Am J Physiol. 1994;266:C462–C466. doi: 10.1152/ajpcell.1994.266.2.C462. [DOI] [PubMed] [Google Scholar]
- 39.Talmadge RJ, Roy RR. J Appl Physiol. 1993;75:2337–2340. doi: 10.1152/jappl.1993.75.5.2337. [DOI] [PubMed] [Google Scholar]
- 40.Brooks SV, Faulkner JA. J Physiol. 1998;404:71–82. doi: 10.1113/jphysiol.1988.sp017279. [DOI] [PMC free article] [PubMed] [Google Scholar]
- 41.Wang Z-M, Messi ML, Delbono O. Biophys J. 1999;77:2709–2716. doi: 10.1016/s0006-3495(99)77104-3. [DOI] [PMC free article] [PubMed] [Google Scholar]
- 42.Woods CE, Novo D, DiFranco M, Capote J, Vergara JL. J Physiol. 2005;568:867–880. doi: 10.1113/jphysiol.2005.089318. [DOI] [PMC free article] [PubMed] [Google Scholar]
- 43.Grynkiewics G, Poenie M, Tsien RY. J Biol Chem. 1985;260:3440–3450. [PubMed] [Google Scholar]
- 44.Lannergren J, Westerblad H. J Physiol. 1987;390:285–293. doi: 10.1113/jphysiol.1987.sp016700. [DOI] [PMC free article] [PubMed] [Google Scholar]
- 45.González E, Messi ML, Delbono O. J Membr Biol. 2002;178:175–118. doi: 10.1007/s002320010025. [DOI] [PubMed] [Google Scholar]
Associated Data
This section collects any data citations, data availability statements, or supplementary materials included in this article.


