

Abstract
A systematic account of neuron cell types is a basic prerequisite for determining the vertebrate nervous system global wiring diagram. With comprehensive lineage and phylogenetic information unavailable, a general ontology based on structure-function taxonomy is proposed and implemented in a knowledge management system, and a prototype analysis of select regions (including retina, cerebellum, and hypothalamus) presented. The supporting Brain Architecture Knowledge Management System (BAMS) Neuron ontology is online and its user interface allows queries about terms and their definitions, classification criteria based on the original literature and “Petilla Convention” guidelines, hierarchies, and relations—with annotations documenting each ontology entry. Combined with three BAMS modules for neural regions, connections between regions and neuron types, and molecules, the Neuron ontology provides a general framework for physical descriptions and computational modeling of neural systems. The knowledge management system interacts with other web resources, is accessible in both XML and RDF/OWL, is extendible to the whole body, and awaits large-scale data population requiring community participation for timely implementation.
Keywords: neurons classification, ontology
1. Introduction
The first requirement for understanding how a machine or system works is a list of parts and account of how they are connected. Systematic classification of animals, and their parts and relationships, is a cornerstone of biology pioneered by Aristotle 2,300 years ago. General approaches today emphasize organizing principles of time and lineage elaborated by Darwin for species evolution and Baer for embryonic development in the 19th century (Rusell, 1916). Histology and cell type classification have benefited especially from lineage analysis, as exemplified by differentiation of the embryonic trilaminar plate or adult hematopoietic stem cells (Standring, 2005).
One glaring exception is the vertebrate nervous system, a uniquely intricate biological network coordinating and controlling fundamental bodily mechanisms assuring survival of individuals and their species through integrated reflex and voluntary responses. Here lineage analysis has contributed relatively little beyond identifying two daughter cell types (neurons and glia) generated from embryonic neuroepithelial stem cells and their regionalization patterns in neural plate, tube, and crest (Brown et al., 2001). Qualitative estimates suggest the adult mammalian nervous system is constructed ontogenetically from 2,500−5,000 classes of neurons generating 25,000−100,000 stereotyped axonal macroconnections between them (Bota et al., 2003). Compared to the relatively simple invertebrate, C. elegans, where the lineage and structure of all 302 adult neurons is established (Sulston et al., 1983; White et al., 1986), only relatively crude lineage data will be available any time soon for the mammalian nervous system. Instead, there is not even a satisfactory definition of neuron cell type, with terms like “class”, “subclass”, “type”, and “subtype” often used interchangeably without proper definition (Cook, 1998; Masland, 2004). Obviously, a systematic account of neuron cell types is a prerequisite for establishing the nervous system's basic wiring diagram and determining the functional significance of molecular mechanisms in specific circuit elements.
1.1 A general solution
Research extending back to Aristotle indicates the vertebrate nervous system is an elongated bilateral structure parceled into distinct gray matter regions interconnected by fiber (“white matter”) tracts (Swanson, 2003) (Fig. 1a, left)—a necessary macroscopic level of description equivalent to using maps for geographic localization or discussing the heart physically in terms of four contractile chambers and a series of valves. At the cellular level, each region contains a) one or more neuron types that connect the region to one or more neuron types in other regions (Fig. 1a, right), and b) usually one or more neuron types that only generate intraregional, local connections. A systematic account of nervous system gray matter is thus provided by a hierarchy of gray matter regions with a complementary hierarchy of neuron types, the lowest level of each hierarchy meeting at the set of neuron types forming each of the smallest gray matter regions (Fig. 1c). Finally, the nervous system global wiring diagram could be represented in a connection matrix of all neuron types defined in the gray matter hierarchy (Fig. 1d). Neither complete hierarchy exists yet, but advanced examples include systematic hierarchical descriptions of rat central nervous system (CNS) regions and fiber tracts (Swanson, 2004) and a systematic, massive description of neuronal cell types by region for vertebrates as understood at the beginning of the 20th century (Cajal, 1909−1911).
Fig. 1. A systematic account of nervous system parts and connections.
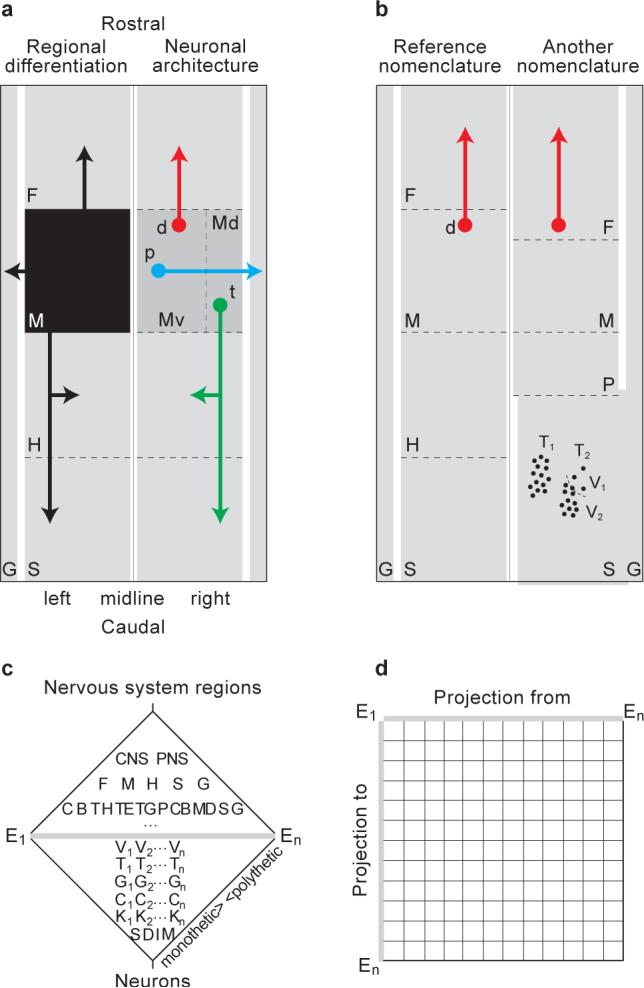
(a) Schematically the vertebrate nervous system has right and left halves with rostral and caudal ends, divided into gray matter regions (G,F,M,H,S) interconnected by fiber tracts (black arrows from black box region M, left half). Each region is actually characterized by a set of neuron types (d, p, t for region M, right half) with a stereotyped pattern of axonal projections forming the tracts, and typically also a neuron-type set generating strictly intraregional axon connections (local interneurons, not shown; see Fig. 1b right half). Mathematically, the number of projection possibilities is given by the combinations of axons and axon collaterals between pairs of neuron types from different regions. Let X = {Ai ,..., Ak } the set of gray matter regions, each having nj; neuron types. The number of neuron type pairs connected by axons or axon collaterals is and the number of possible combinations is . Experimentally, physical connections are established currently with anterograde and retrograde tracer methods, which may help subdivide regions (Md, Mv). (b) Historically, disagreement is common about region boundaries, profoundly affecting description and interpretation of experimental results; here in a reference nomenclature neuron type d projects from region M to F, whereas in another nomenclature the same neuron type is described as having local connections in region F. (c) A complete ontology of nervous system regions and neuron types could be represented as two reference hierarchies meeting at the lowest level of each (see text and example in Fig. 3). (d) Finally, the global nervous system connection matrix is defined by data for each neuron type (or region) in a complete reference nomenclature (entities E1-En) taken from (c).
1.2 Formal classification strategies
All classification schemas parcel a set into distinguishable subsets, and are either monothetic or polythetic. Monothetic taxonomy identifies most important characters or “essences” of classified objects (Rowe and Stone, 1977), whereas the polythetic approach emerged from numerical taxonomy and classifies objects by overall degree of similarity/difference calculated over many properties (Bailey, 1994). Polythetic classes are determined statistically with multiparametric methods like principal component (Yelnik et al., 1991; Sultan and Bower, 1998) and cluster (Bailey, 1994) analysis, all variables not necessarily being equal. Basically, polythetic classifications are empirical whereas monothetic approaches are deductive (Bailey, 1994).
Until recently, monothetic approaches were used exclusively to classify neurons (Rowe and Stone, 1977; Tyner, 1985; Rodieck and Brenning, 1983). The first classification scheme was based on nerve cell body size, shape, and spatial distribution (Purkinje, 1883), and the next on axon length—for a combination of structural and functional reasons: because the axon was considered either the sole impulse conductor(Golgi, 1873) or the neuron's output/effector channel (Cajal, 1995). Popular classification criteria now also include physiological properties and molecular composition (Table 1)—and these monothetic, deductive taxonomies can include multiple criteria (Migliore and Shepherd, 2005).
Recent polythetic approaches to neuron classification typically emphasize morphological features (Table 1). Because experimental data are used to discover polythetic classes, they are often considered “natural”, assuming they exist in nature, independent of investigator deductive bias (Rodieck and Brenning, 1983). Cell types are “discovered” using multiparametric methods applied to cell populations, over many characters (Cook, 1998; Rodieck and Brenning, 1983). By definition, then, neuron types are distinguishable clusters formed in parametric space (Fig. 1b, lower right)—and cell population cluster analysis provides a formal way to construct neuron taxonomies or hierarchies of types as well (Rodieck and Brenning, 1983).
Polythetic clustering does, however, have limitations. First, it may change with new variables or alternate clustering methods. Second, biases in choosing a set of variables for comparison are problematic because the number of variables is theoretically infinite (Rowe and Stone, 1977; Kong et al., 2005). The latest strategy to minimize this problem involves comparing comprehensive gene expression profiles across neurons (Rodieck and Brenning, 1983; Mott and Dingledine, 2003; Markram et al., 2004; Sugino et al., 2006). And third, polythetic clustering in practice is best for “discovering” statistical regularities that distinguish populations of individuals in the bottom two or three levels of a hierarchy (Rodieck and Brenning, 1983) (Fig. 1c).
Thus, polythetic neuron classification schemas are best regarded not as cell type definitions, but instead as hypotheses that cell taxa fulfill distinct functional roles (Rowe and Stone, 1977). Viewing neuron classifications as hypotheses is advantageous because they can be tested with more data or new methods, then changed accordingly or discarded (Cook, 1998; Rowe and Stone, 1977).
In deeper hierarchies the polythetic, “bottom-up” approach is complemented by a monothetic, “top-down” classification or typology based on features considered most important. For example, systems neuroscientists may prefer a neuron taxonomy based on axonal connections (Fig. 1c), whereas pharmacologists and developmental neuroscientists may prefer one based on gene expression patterns (Swanson, 2004; Rodieck and Brenning, 1983). Furthermore, alternate classification schemas for neurons (and regions, Fig. 1b) may coexist and be compared provided relationships between all terms are defined. In short, proper definition of all terms in a set, and relations between terms, are fundamental to domain knowledge representation in any ontology (Gruber, 1993), and classification criteria, considered next, are basic to classification. Although ontology has many definitions, they necessarily include a vocabulary of terms and their definitions, and an indication of how concepts are interrelated (Uschold and Jasper, 1999).
2. Prototype Neuron ontology architecture
Under development since 2001 (Bota et al, 2003; Bota et al., 2005; Bota and Swanson, 2006; Bota and Swanson, 2007), the Brain Architecture Knowledge Management System (BAMS; http:/brancusi.usc.edu/bkms) is an information repository for vertebrate nervous system parts and includes inference engines for processing data and metadata. It is designed primarily to answer queries about, and model the organization of, network organization and molecular biology. For this, BAMS has four interoperable modules: Brain parts (macroscopic gray matter regions, fiber tracts, and ventricles), Cell types (microscopic composition of gray matter regions), Neuroanatomical projections (axonal connections between regions and/or cell types), and Molecules (detected in brain parts and cell types).
The newest feature, described here, is a BAMS Neuron ontology that allows inserting—and online querying about—vertebrate neuron names, definitions, classification criteria, and hierarchies, and about relations between terms defined within and between nomenclatures—all as collated and annotated from the literature. As with other BAMS modules (Bota et al., 2005; Bota and Swanson, 2006), the Neuron ontology was implemented in MySQL using an entity-relationship (ER) approach that models ontology classes as entities, relations as ER relations between entities, and attributes as ER attributes (Gómez-Pérez et al., 2003).
The first two steps in developing an ontology of neurons involve building the set of terms used to define neuron populations in various parts of the nervous system, and then defining relationships between the terms, which must be species specific because they may refer to different entities in different species. The approach used to construct our Neuron ontology is oriented to gray matter regions: a set of terms and relations that describes neuron populations associated with a nervous system part is collated from the literature from an historical perspective—ensuring a rigorous description of each nervous system part (see example for the retina in Section 3). We do not favor specific nomenclatures or authors, but instead attempt to insert all terms ever used for a region because this is the only way to construct a comprehensive “knowledge map” of neuron terms for a gray matter region. It is obvious that the ontology being built first as a set of terms and relationships between them must be open, so that new terms or nomenclatures can be added. All of these methodological constraints for constructing neuron ontologies have been proposed before, and were articulated most recently in the “Petilla Convention” (http://www.columbia.edu/cu/biology/faculty/yuste/petilla/petillawebpages/Nomenclature/PetillaNomenclaturefinal.pdf).
First and foremost, terms are uniquely identified in BAMS's Neuron ontology by name, species, and nomenclature. BAMS Neuron nomenclatures (as attributes of terms) in the ontology are similar to earlier BAMS Brain parts nomenclatures (Bota et al., 2005): Neuron nomenclatures allow unique identification of different neuron types with identical names, or the same neuron type with different names, as referenced in the literature. Specifically, Neuron nomenclatures refer to terms or internally consistent sets of terms defined by an author or group of authors, and are associated with a set of references in the literature. Thus, all terms and relations in BAMS's Neuron ontology are fully referenced and each term is associated with a definition. Information about species is especially important though not always possible, especially for general neuron classes like retinal photoreceptors. Here it is necessary and preferable to insert definitions from the most authoritative literature (see below).
Two types of relations between terms are available so far in BAMS's Neuron ontology: “is-a” and semantic. The former allow hierarchical organization of neuron nomenclatures, and the latter establish mapping or indexing between neuron names across BAMS Nomenclatures (i.e., defined by different authors).
BAMS neuron hierarchy construction fulfills the principle of mutual exclusion; that is, any two classes at the same hierarchy level are disjoint (Gómez-Pérez et al., 2003). Construction is also based on information collated from references associated with any nomenclature, with one basic exception—the top three levels. To provide symmetry with the regional hierarchy (Fig. 1c), these most general monothetic neuron taxa reflect the organization of vertebrate nervous system connections underlying its basic functional subsystems. The hierarchy's root is the concept “cell type”, which has as ontogenetic lineage, the children “neuron” and “glial cell” (Standring, 2005; Brown and Keynes, 2001, Slack, 2001). Children of “neuron” are the divisions “sensory”, “motor”, “sensory-motor”, and “internuncial (interneuron)”, defined by fundamental connectional input-output relationships (Swanson, 2003). And finally, the neuron divisions are parceled into neuron categories, depending on sensory modality, type of motor output, and length of interneuron axon projection—local, or projection between regions (Swanson, 2003).
The next hierarchy level, neuron classes occupies a transitional place in terms of monothetic and polythetic classification—neuron classes in this scheme are found in highly differentiated regions and are established across species (e.g., all vertebrates, or all mammals). They are usually determined monothetically, although polythetic analyses also refer to them (Kong et al., 2005; Badea and Nathans, 2004). As discussed above, the lowest hierarchy levels ideally are determined polythetically, and at the heart of these levels is the neuron type, a distinct cluster in parametric space (Tn in Fig. 1b, c). Below, neuron varieties (none to multiple levels) may be distinguished, and above this, neuron groups (none to multiple levels) may also be distinguished.
To capture monothetic and polythetic classification approaches a comprehensive representation of criteria used to characterize neurons was developed (Fig. 2). This schema is implemented as a set of relational tables in BAMS's backend database, and contains 7 major criteria with subcriteria. The schema indexes criteria explicitly used by authors in a particular paper to classify neurons. Thus, each parameter used for classification is documented by textual annotations, references, and authors. Parameters included in each criterion and subcriterion were derived from the original literature, as well as various attempts to classify neurons, such as the guidelines of the “Pettila Convention” (see Markram, 2006). The Morphology and Physiological properties criteria are subdivided and associated with published parameters. Additional information—like names of input sources and target regions, major fiber tracts, references, collators, and collator annotations—is associated with BAMS's Neuron ontology classification criteria. Each “is-a” relationship can be associated with any number of parameters and criteria, which are used as stated by the authors of collated references. Thus, taxonomic relations established between terms in BAMS's Neuron ontology can be documented already by any combination of more than 100 criteria and parameters, which are readily extensible.
Fig. 2. Conceptual schema of classification criteria associated with “is-a” relations in BAMS's Neuron ontology.

It already represents >100 variables used in the literature to classify neurons in Neuron nomenclatures.
A particular BAMS Neuron nomenclature is defined as a BAMS Reference neuron nomenclature when it best describes, based on published data and collator knowledge, the internally consistent set of distinguishable neuron populations in a particular region or set of regions. Criteria for choosing a Reference neuron nomenclature from the set of schemas associated with a nervous system region include: a) the construction mode (polythetic favored over monothetic); b) the number of classification parameters, a classification schema being preferred when more parameters are used; c) parameter types (quantitative favored over qualitative); d) relationships with alternate nomenclatures established and discussed by its authors, and finally e) independent nomenclature confirmation.
Present BAMS design allows only one Reference neuron nomenclature for a nervous system region or set of regions. The advantage of defining a BAMS Reference neuron nomenclature is the great reduction of computational load needed to run inferences about related terms. Without a reference or standard nomenclature, the number of mappings between N terms is proportional to N2, whereas the number with a reference nomenclature is proportional to N (Dashti et al., 1997). Furthermore, Reference neuron nomenclatures are required to construct unitary and internally consistent cell taxonomies from the best available data.
Strategically, BAMS Reference neuron nomenclatures are replaced by more complete versions as available, evolving iteratively. Furthermore, constructing a global BAMS Reference neuron nomenclature—the ultimate goal of a complete Neuron ontology for, say, mammals—depends on defining specific nomenclatures for specific regions and aggregating them iteratively (Fig. 1b,c). Importantly, however, individual researchers need not adopt BAMS Reference nomenclatures. Alternate nomenclatures tagged BAMS Reference private may be constructed from several sources by collators, altered based on other criteria or unpublished observations, and used and compared with other nomenclatures in a private BAMS domain.
The second relation type supported by BAMS's Neuron ontology is semantic, and deals with relations between neuron populations across nomenclatures, public and private. Four semantic relations are currently supported: “identical”, which is equivalent to “synonym” in other ontologies, “includes” (and complementary “is included”), “partially corresponds”, and “different”. This set of relations permits alignment of terms defined in different nomenclatures, each entry being documented with annotations, collated references, and collator name.
Neuron information is integrated by BAMS's structure and user interface with data and metadata in the Brain regions, Neuroanatomical projections, and Molecules modules. Important examples include qualitative and quantitative architectonic data: spatial distribution and appearance within specific nervous system regions, assessment of staining intensity, and cell counts (Bota et al., 2005). BAMS's web interface allows users to view brain region descriptions, connections, and gene expression reports that include BAMS Neuron nomenclatures. The interface also allows dynamic reconstruction of neuron taxonomies, displayed at variable levels of depth.
3. Strategy for populating the Neuron ontology: case study—rat retina
The critical effort to populate BAMS's Neuron ontology began with the rat CNS, where the most complete set of vertebrate neuroanatomical data is available, and with two well understood regions: retina and cerebellum. For comparison, parallel starts have been made in two more difficult but functionally critical forebrain regions, the hypothalamus and rostrally adjacent bed nuclei of the stria terminalis (BST), a cerebral nuclear region connecting medial temporal lobe and prefrontal cortex with hypothalamus (Fig. 3).
Fig. 3. Neuron type hierarchies for seven rat gray matter regions.
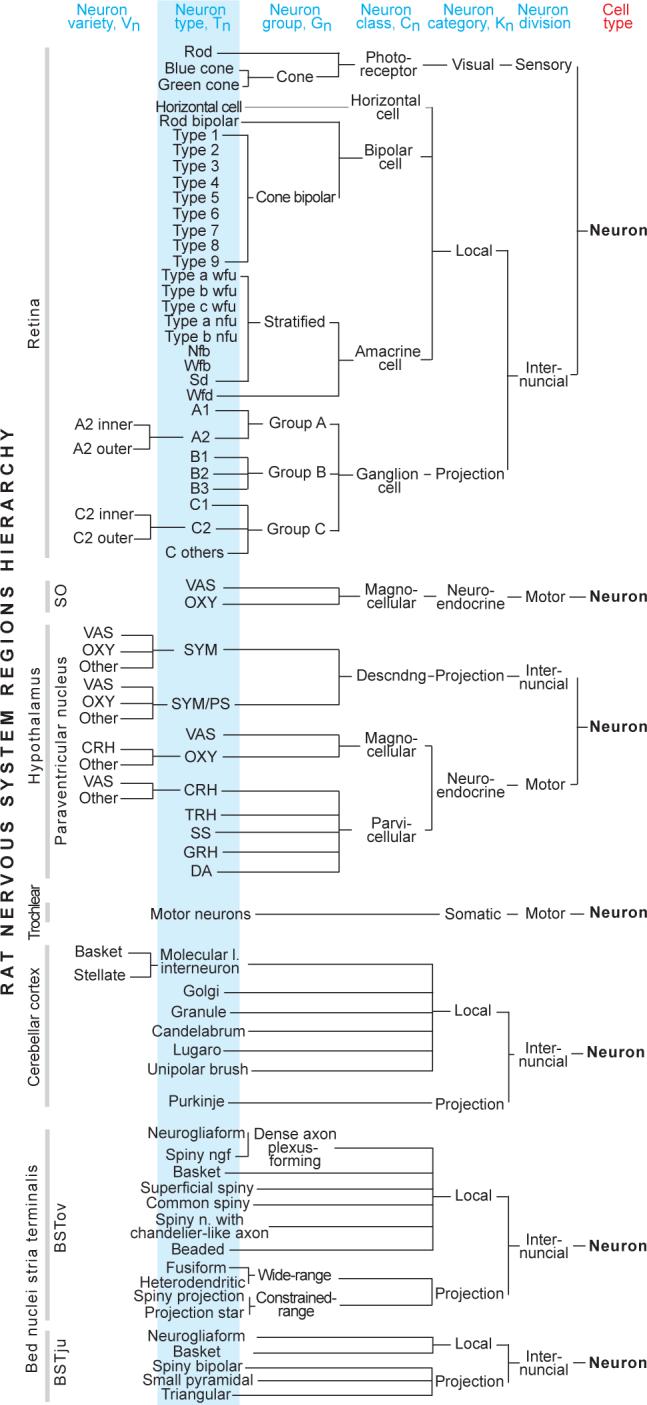
Simple to complex examples all fit easily into the general schema provided in Figure 1c.
Although difficult to analyze histologically because of its thin, delicate sheet-like arrangement (Sefton et al., 2005), the retina provides a good test bed for neuron ontology development. On one hand, it is universally agreed that the vertebrate retina contains 5 general neuron classes: photoreceptors (sensory neurons); horizontal, bipolar, and amacrine cells (local interneurons); and ganglion cells (projection interneurons)—yet on the other hand a large number of terms have been used to name various neuron populations in many species including rat (Masland, 2001b). A long-term goal is to establish relationships between all terms, first in one species then ultimately between all vertebrate species—and to determine their most parsimonious hierarchical organization.
A prototype complete mapping of neuron nomenclatures (terminologies) used for the rat retina in BAMS's Neuron ontology terms involved collating definitions and relations from the primary literature, starting with the first significant one in 1932 (39 references total). The resulting terms associated with major rat retina neuron taxa (153 names) represent in BAMS's Neuron ontology the complete published set, to the best of our knowledge (Table 2).
Interestingly, all rat retinal ganglion cell classification schemas so far are monothetic, although polythetic classifications have been introduced recently for other species (Kong et al., 2005; Badea and Nathans, 2004; Cohen and Sterling, 1992). In rat, most are based on morphological characters, but some use axonal projections, physiological properties, or gene expression patterns—or combinations of morphological characters and expressed molecules. Based on this inclusive data set, BAMS's rat retina Neuron ontology and associated Reference nomenclatures (see Table 2) includes three photoreceptor types (one rod, two cone), one horizontal cell type, 10 bipolar cell types, 9 amacrine cell types, and 10 ganglion cell types, arranged hierarchically (Fig. 3) in the schema considered above (Fig. 1c).
The entire rat retina Neuron Ontology is necessarily constructed from monothetic nomenclatures. Therefore, terms included in neuron type and neuron group levels may change when polythetic analyses are performed. However, polythetic retinal neuron analysis in other species (Badea and Nathans, 2004) preserves neuron group as an intermediary level between neuron type and neuron class. Upper hierarchy levels are invariant in different classification schemas because, as discussed above, they were deduced from general retinal (neuron class level [Masland, 2001a]) and vertebrate CNS (category and division levels [Swanson, 2003; Swanson, 2004]) organization principles.
Whereas authors of different morphological classification schemas relate their nomenclatures, less alignment is found between rat morphological and gene expression nomenclatures. For example, only two terms defined chemoarchitectonically (glycinergic type 4 amacrine cells (MacNeil et al., 1999) and cholinergic amacrine cells (Voigt, 1986) are related to terms defined morphologically (stratified diffuse amacrine cells [MacNeil et al., 1999] and type-a narrow-field unistratified amacrine cells [Voigt, 1986], respectively). Furthermore, only retinal bipolar cell nomenclatures include mappings between physiologically and morphologically defined terms (Hartveit, 1997). Some terms common to many mammalian species, like blue cone bipolar cells or blue-ON ganglion cells (Masland, 2001a, b), are not found in any rat nomenclature.
Retinal ganglion cells show the greatest diversity of terms, relationships, and nomenclatures. The classification schema defined in Huxlin and Goodchild (Huxlin and Goodchild, 1997) is BAMS's Reference nomenclature for rat retinal ganglion cells because it uses the most morphological parameters and includes a comparison with previous nomenclatures. Most criteria in the literature for rat retinal ganglion cell classification are morphological although connections, physiological properties, and gene expression patterns have been used. General agreement emerges that they form three morphologically distinct, major types, groups A-C. The nomenclature proposed by Sun and colleagues (Sun et al., 2004) is identical to Huxlin and Goodchild (Huxlin and Goodchild, 1997) except a fourth morphologically defined group is included. It is not a BAMS Reference nomenclature because the classification was based on a smaller set of morphological parameters, included in the set used by Huxlin and Goodchild, and there is no independent confirmation of their fourth group.
Using Huxlin and Goodchild (Huxlin and Goodchild, 1997) as a BAMS Reference nomenclature, differences between rat retinal ganglion cell groups A-C with respect to relationships between terms across all other rat classifications can be displayed graphically using BAMS's Neuron ontology (Fig. 4). Group A neuron populations are most studied and Group B least. Unfortunately, morphological and physiological classifications cannot be related directly, unlike other species (Masland, 2001a, b; Amthor et al., 1989).
Fig. 4. Graphical display of rat retinal ganglion cell terms and relationships between terms (“the knowledge map”) in BAMS Neuron ontology.

The graph was obtained from Graph Viz's Neato tool, which constructs graphs based on the Kawada-Kamai virtual physical model. It places an ideal spring between any pair of nodes such that its length is set to the shortest path distance between endpoints (Gansner and North, 1999). Thus, nodes with more edges tend to cluster. For full reference citations see BAMS.
Morphological “type C others”, or C3 (Sun et al., 2004), exemplifies how ontologies can be used for nomenclature alignment and knowledge extraction. In BAMS's Neuron ontology this neuron population is a child of group C, which is the most diverse hodologically (from data in BAMS). From relations in the ontology (Fig. 4) it is inferred that “cell population C other” projects to various hypothalamic and pretectal target regions and includes melanopsin-expressing retinal ganglion cells, which are synonymous with neurons coexpressing glutamate and PACAP (Hannibal et al., 2002). The morphological heterogeneity of rat retinal ganglion cell group C (Huxlin and Goodchild, 1997; Sun et al., 2004) is likely correlated with the diversity of brain region targets (Cajal, 1995). From relations between terms in the ontology, group A includes retinal ganglion cell populations projecting to superior colliculus and dorsal lateral geniculate nucleus, lateral posterior thalamic nucleus, and ventral lateral geniculate nucleus. There is no information about projections of group B rat retinal ganglion cells, except toward the superior colliculus (Linden and Perry, 1983).
The rat cerebellar cortex is associated with 15 neuron names defined in 6 nomenclatures (9 references), and is the second example of complete mapping in BAMS's Neuron ontology (Fig. 3). The rat cerebellar cortex analysis also includes a polythetic classification of cerebellar interneurons (Sultan & Bower, 1998; see also Table 1). In addition, the ontology includes 9 names defined in 2 nomenclatures (5 references) for neurons of the rat deep cerebellar nuclei. For comparison, the trochlear nucleus simply has one type of somatic motoneuron and the supraoptic nucleus (SO) has two types of magnocellular neuroendocrine motoneuron. The rat paraventricular nucleus is associated in BAMS with 18 neuron names defined in 4 morphological and physiological nomenclatures (8 references). Note that oxytocin and vasopressin magnocellular neuroendocrine motoneurons exemplify neuron types found in multiple regions. The Neuron ontology also includes 27 names defined in 4 nomenclatures (5 references) for the BST; note that local interneurons with the same name are found in different BST regions.
Overall, BAMS' Neuron ontology is currently populated with 250 terms and more than 300 relationships between them. All regions collated to date fit easily in the hierarchical scheme of Figure 1c.
4. Discussion
Complexities of the neuron classification problem, combined with the existence of alternate neuron nomenclatures for the same neural region or subsystem, make ontologies necessary tools for the explicit specification of concepts (Gruber, 1993) and for mapping or indexing between terms. Cell ontologies have been developed as components of larger bioinformatics (Gene Ontology Database [Ashburner and Lewis, 2002; Bard et al., 2005], DopaNet [Le Novère et al., 2004]) and anatomy ontologies (Rosse and Mejino, 2003), and other cell ontologies are available as well online (Cell Type: http://www.sanbi.ac.za/evoc/ontologies_html/latest/celltype.html; TissueDB: http://tissuedb.ontology.ims.u-tokyo.ac.jp:8082/tissuedb/), but none are designed specifically for the nervous system. BAMS Neuron ontology helps fill this void and has the additional advantage of rigorously and comprehensively indexing terms and relations with primary literature references and support annotations, as well as with structural and physiological classification criteria. The Ontology for the Subcellular Anatomy of the Nervous System [SAO; Fong et al., 2006] is also designed to describe neurons and their structural and molecular properties. SAO was developed as a stand-alone applications and its web-based version is under development. The Senselab databases (Marenco et al.,1999) also have other systems that include neuron classification schemas.
BAMS's Neuron ontology is an ontology designed specifically for representing domain knowledge in neurobiology. It is classed lightweight— it contains terms and relationships between them, but not yet axioms and formal constraints (Gómez-Pérez et al., 2003)—and relies on database technology. The ontology includes a growing thesaurus, “is-a” relations for establishing hierarchies, and additional semantic relations. BAMS's Neuron ontology is also the first to address problems of multiple cell nomenclatures in the vertebrate nervous system, allowing insertion of terms uniquely identified by species and nomenclature from the primary research literature.
In BAMS's Neuron ontology, established “is-a” relations are associated already with >100 classification criteria or variables in the form of annotations. This approach of representing neuron classification criteria and of annotating each term with both species and nomenclature is consistent with the most recent attempts at neuron classification (Markram, 2006)—and such a classification criteria set is necessary for constructing any ontology including attributes and their values associated with instances.
Semantic relations defined in BAMS's Neuron ontology allow mapping between terms defined in different nomenclatures and thus alignment of alternate classification schemas. BAMS treatments of retina and cerebellar cortex are examples of domain knowledge representations, and of making inferences based on inserted semantic relations. BAMS is the first online neuroinformatics system to include complete mapping of terminology used to describe the rat retina and cerebellar cortex.
BAMS now provides a formal set of terms and hierarchical structure for classifying neurons in a gray matter region (Fig. 3) and the nervous system as a whole (Fig. 1c). In practice, BAMS's Neuron ontology provides tools to identify and improve a BAMS Reference nomenclature for neurons in any region, and to display relationships between it and any other nomenclature applied to the region. As regional Reference nomenclatures accumulate, the challenge is to aggregate them into a global Reference nomenclature, but the underlying approach is similar to that for individual regions, using BAMS's Neuron ontology (Fig. 4). A global Reference nomenclature of a given mammalian species can be constructed from a complete and non-overlapping set of regional Reference nomenclatures that describe the 10 basic parts of the vertebrate CNS (Swanson, 2000) (Fig. 1c).
As demonstrated, a global, all-inclusive Reference nomenclature may be constructed using a combined approach, with polythetically determined lower levels of the taxonomy, and monothetic higher order levels. The global neuron Reference nomenclature may then be combined with BAMS's Neuroanatomical projections module to produce as complete a connection matrix for the nervous system wiring diagram as the extant data permit (Bota and Swanson, 2007) (Fig. 1d). The functional significance of the wiring diagram depends importantly, of course, on cell types in the body innervated by motor neurons and on stimuli sources for sensory neurons. Because of BAMS's general architecture, extension to non-neuronal cell types throughout the body is in principle trivial (Fig. 3, Cell type).
BAMS already links with other relevant web resources (Bota and Swanson, 2006) and it is accessible both in XML format, as part of the Swanson-98 brain nomenclature (http://brancusi.usc.edu/bkms/xml/swanson-98.xml) and RDF/OWL format, which can be used for automated reasoning (http://esw.w3.org/topic/HCLS/HCLSIG_DemoHomePage_HCLSIG_Demo). Its basic Neuron ontology will expand in three important ways. First, conversion of classification criteria to relations between terms (“part-of” relations), and attributes and their values, will allow the ontology to include experimental data and to store information about individual neurons. Second, new algorithms will allow automated inferences about relations between terms and detecting incomplete, inconsistent, and/or contradictory data. And third, as much data about the rat nervous system as possible needs to be entered in the system, an exercise that cannot be approached without major community involvement; and of course this can proceed in parallel with data from other species.
Acknowledgements
This work was supported by NIH Grants MH61223, NS16668, and NS050792. We especially thank Drs. Michael A. Arbib, Joel D. Hahn, and Edward G. Jones for suggestions and feedback.
Footnotes
Publisher's Disclaimer: This is a PDF file of an unedited manuscript that has been accepted for publication. As a service to our customers we are providing this early version of the manuscript. The manuscript will undergo copyediting, typesetting, and review of the resulting proof before it is published in its final citable form. Please note that during the production process errors may be discovered which could affect the content, and all legal disclaimers that apply to the journal pertain.
References
- Amthor FR, Takahashi ES, Oyster CW. Morphologies of rabbit retinal ganglion cells with concentric receptive fields. J. Comp. Neurol. 1989;280:72–96. doi: 10.1002/cne.902800107. [DOI] [PubMed] [Google Scholar]
- Ashburner M, Lewis S. On ontologies for biologists: the Gene Ontology-untangling the web. Novartis Found. Symp. 2002;247:66–80. [PubMed] [Google Scholar]
- Bard J, Rhee SY, Ashburner M. An ontology for cell types. Genome Biol. 2005;6:R21. doi: 10.1186/gb-2005-6-2-r21. [DOI] [PMC free article] [PubMed] [Google Scholar]
- Badea TM, Nathans J. Quantitative analysis of neuronal morphologies in the mouse retina visualized by a using a genetically directed reporter. J. Comp. Neurol. 2004;480:331–351. doi: 10.1002/cne.20304. [DOI] [PubMed] [Google Scholar]
- Bailey KD. Typologies and Taxonomies: An Introduction to Classification Techniques. In Sage University Paper series on Quantitative Applications in the Social Sciences. Thousand Oaks; CA: 1994. pp. 7–102. [Google Scholar]
- Bota M, Dong H-W, Swanson LW. From gene networks to brain networks. Nature Neurosci. 2003;6:795–799. doi: 10.1038/nn1096. [DOI] [PubMed] [Google Scholar]
- Bota M, Dong H-W, Swanson LW. Brain architecture management system. Neuroinformatics. 2005;3:15–48. doi: 10.1385/NI:3:1:015. [DOI] [PubMed] [Google Scholar]
- Bota M, Swanson LW. A new module for manipulation and display and manipulations of molecular information in the Brain Architecture Management System. Neuroinformatics. 2006;4:275–298. doi: 10.1385/NI:4:4:275. [DOI] [PubMed] [Google Scholar]
- Bota M, Swanson LW. Online workbenches for neural network connections. J. Comp. Neurol. 2007;500:807–814. doi: 10.1002/cne.21209. [DOI] [PubMed] [Google Scholar]
- Brown M, Keynes R, Lumsden A. The Developing Brain. Oxford University Press; Oxford: 2001. [Google Scholar]
- Cajal SR. Histologie du Système Nerveux de l'Homme et des Vertébrés (Maloine, Paris, 1909−1911). In: Swanson N, Swanson LW, editors. Santiago Ramón y Cajal: Histology of the Nervous System in Man and Vertebrates. Oxford University Press; New York: 1995. For translation see. [Google Scholar]
- Cohen E, Sterling P. Demonstration of cell types among cone bipolar neurons of cat retina. Phil. Trans. R. Soc. Lond. B Biol. Sci. 1992;330:305–21. doi: 10.1098/rstb.1990.0201. [DOI] [PubMed] [Google Scholar]
- Cook JE. Getting to grips with neuronal diversity: what is a neuronal type? In: Chalupa LM, Finlay BM, editors. Development and Organization of the Retina, NATO ASI series. Plenum Press; New York: 1998. pp. 91–120. [Google Scholar]
- Dashti AE, Ghandeharizadeh S, Stone J, Swanson LW, Thompson RH. Database challenges and solutions in neuroscientific applications. Neuroimage. 1997;5:97–115. doi: 10.1006/nimg.1996.0253. [DOI] [PubMed] [Google Scholar]
- Gansner ER, North SC. An open graph visualization system an its applications to software engineering. Softw. Pract. Exper. 1999;00(S1):1–5. [Google Scholar]
- Golgi C. Sulla struttura della grigia del cervello. Gaz. med. ital. Lomb. 1873;6:244–246. [Google Scholar]
- Gómez-Pérez A, Corcho O, Fernandez-Lopez M. Ontological Engineering: With Examples from the Areas of Knowledge Management, E-commerce and the Semantic Web. Springer; New York: 2003. [Google Scholar]
- Gruber TM. Toward principles for the design of ontologies used for knowledge sharing. Internat. J. Human-Computer Studies. 1993;43:907–928. [Google Scholar]
- Hannibal J, Hindersson P, Knudsen SM, Georg B, Fahrenkrug J. The photopigment melanopsin is exclusively present in pituitary adenylate cyclase-activating polypeptide-containing retinal ganglion cells of the retinohypothalamic tract. J. Neurophysiol. 2002;22:RC191. doi: 10.1523/JNEUROSCI.22-01-j0002.2002. [DOI] [PMC free article] [PubMed] [Google Scholar]
- Hartveit E. Functional organization of cone bipolar cells in the rat retina. J. Neurophysiol. 1997;77:1716–1730. doi: 10.1152/jn.1997.77.4.1716. [DOI] [PubMed] [Google Scholar]
- Huxlin KR, Goodchild AK. Retinal ganglion cells in the albino rat: revised morphological classification. J. Comp. Neurol. 1997;385:309–323. [PubMed] [Google Scholar]
- Kong JH, Fish DR, Rockhill RL, Masland RH. Diversity of ganglion cells in the mouse retina: unsupervised morphological classification and its limits. J. Comp. Neurol. 2005;489:283–310. doi: 10.1002/cne.20631. [DOI] [PubMed] [Google Scholar]
- Le Novère N, Donizelli M. The molecular pages of the mesotelencephalic dopamine consortium (DopaNet). BMC Bioinformatics. 2004;5:174. doi: 10.1186/1471-2105-5-174. [DOI] [PMC free article] [PubMed] [Google Scholar]
- Linden R, Perry VH. Massive retinotectal projections in rats. Brain Res. 1983;272:145–149. doi: 10.1016/0006-8993(83)90371-2. [DOI] [PubMed] [Google Scholar]
- MacNeil MA, Heussy JK, Dacheux RF, Raviola E, Masland RH. The shapes and numbers of amacrine cells: matching of photofilled with Golgi-stained cells in the rabbit retina and comparison with other mammalian species. J. Comp. Neurol. 1999;413:305–326. [PubMed] [Google Scholar]
- Markram H, Toledo-Rodriguez M, Wang Y, Gupta A, Silberberg G, Wu C. Interneurons of the neocortical inhibitory system. Nat. Rev. Neurosci. 2004;5:793–807. doi: 10.1038/nrn1519. [DOI] [PubMed] [Google Scholar]
- Markram H. The blue brain project. Nat. Rev. Neurosci. 2006;7:153–160. doi: 10.1038/nrn1848. [DOI] [PubMed] [Google Scholar]
- Marenco L, Nadkarni P, Skoufos E, Shepherd G, Miller P. Neuronal database integration: the Senselab EAV data model. Proc AMIA Symp. 1999;1999:102–106. [PMC free article] [PubMed] [Google Scholar]
- Masland RH. The fundamental plan of the retina. Nat. Neurosci. 2001a;4:877–886. doi: 10.1038/nn0901-877. [DOI] [PubMed] [Google Scholar]
- Masland RH. Neuronal diversity in the retina. Curr. Opin. Neurobiol. 2001b;11:431–436. doi: 10.1016/s0959-4388(00)00230-0. [DOI] [PubMed] [Google Scholar]
- Masland RH. Neuronal cell types. Curr. Biology. 2004;14:R497–500. doi: 10.1016/j.cub.2004.06.035. [DOI] [PubMed] [Google Scholar]
- Migliore M, Shepherd GM. An integrated approach to classifying neuronal phenotype. Nat. Rev. Neurosci. 2005;6:810–818. doi: 10.1038/nrn1769. [DOI] [PubMed] [Google Scholar]
- Mott DD, Dingledine R. Interneuron research – challenges and strategies. Trends Neurosci. 2003;26:484–488. doi: 10.1016/S0166-2236(03)00200-5. [DOI] [PubMed] [Google Scholar]
- Perry VH, Walker M. Amacrine cells, displaced amacrine cells and interplexiform cells in the retina of the rat. Proc. Roy. Soc. Lond. B Biol. Sci. 1980;208:415–431. doi: 10.1098/rspb.1980.0060. [DOI] [PubMed] [Google Scholar]
- Purkinje JE. Neueste Untersuchungen aus der Nerven- und Hirn-anatomie. Bericht über die Versammlung deutscher Naturforscher und Aerzte in Prag im September 1837. 1883:177–180. [Google Scholar]
- Rodieck RW, Brening RK. Retinal ganglion cells: properties, types, genera, pathways and trans-species comparisons. Brain Behav. Evol. 1983;23:121–164. doi: 10.1159/000121492. [DOI] [PubMed] [Google Scholar]
- Rosse C, Mejino JL., Jr. A reference ontology for biomedical informatics: the Foundational Model of Anatomy. J. Biomed. Inform. 2003;36:478–500. doi: 10.1016/j.jbi.2003.11.007. [DOI] [PubMed] [Google Scholar]
- Rowe MH, Stone J. Naming of neurons. Brain Behav. Evol. 1977;14:185–216. doi: 10.1159/000125660. [DOI] [PubMed] [Google Scholar]
- Russell ES. Form and Function: A Contribution to the History of Animal Morphology. Murray; London: 1916. [Google Scholar]
- Sefton AJ, Dreher B, Harvey . A.Visual system. In: Paxinos G, editor. The Rat Nervous System. Elsevier; San Diego: 2005. pp. 1083–1165. [Google Scholar]
- Slack JMW. From Egg to Embryo: Regional Specification in Early Development, Second edition. Cambridge University Press; Cambridge: 1991. [Google Scholar]
- Standring S, editor. Gray's Anatomy: The Anatomical Basis of Clinical Practice. 39th Edition Elsevier Churchill Livingstone; Edinburgh: 2005. [Google Scholar]
- Sugino K, Hempel CM, Miller MN, Hattox AM, Shapiro P, Wu C, Huang ZJ, Nelson SB. Molecular taxonomy of major neuronal classes in the adult mouse forebrain. Nat. Neurosci. 2006;9:99–107. doi: 10.1038/nn1618. [DOI] [PubMed] [Google Scholar]
- Sulston JE, Schierenberg E, White JG, Thompson JN. The embryonic cell lineage of the nematode Caenorhabditis elegans. Dev. Biol. 1983;100:64–119. doi: 10.1016/0012-1606(83)90201-4. [DOI] [PubMed] [Google Scholar]
- Sultan F, Bower JM. Quantitative Golgi study of the rat cerebellar molecular layer interneurons using principal component analysis. J. Comp. Neurol. 1998;393:353–373. [PubMed] [Google Scholar]
- Sun W, Li N, He S. Large morphological analysis of rat retinal ganglion cells. Vis. Neurosci. 2004;19:483–493. doi: 10.1017/s0952523802194107. [DOI] [PubMed] [Google Scholar]
- Swanson LW. What is the brain? Trends in Neurosci. 2000;23:519–527. doi: 10.1016/s0166-2236(00)01639-8. [DOI] [PubMed] [Google Scholar]
- Swanson LW. Brain Architecture: Understanding the Basic Plan. Oxford University Press; Oxford: 2003. [Google Scholar]
- Swanson LW. Brain Maps: Structure of the Rat Brain. A Laboratory Guide with Printed and Electronic Templates for Data, Models and Schematics. Third edition Elsevier; Amsterdam: 2004. [Google Scholar]
- Tyner CF. The naming of neurons: applications of taxonomic theory to the study of cellular populations. Brain Behav. Evol. 1975;12:75–96. doi: 10.1159/000124141. [DOI] [PubMed] [Google Scholar]
- Uschold M, Jasper R. A framework for understanding and classifying ontology applications. In: Benjamins VR, editor. IJCAI '99 Workshop on Ontology and Problem Solving Methods: Lessons Learned and Future Trends; Stockholm, Sweden. CEUR Workshop Proceedings; Amsterdam: 1999. [Google Scholar]
- Voigt T. Cholinergic amacrine cells in the rat retina. J. Comp. Neurol. 1986;248:19–35. doi: 10.1002/cne.902480103. [DOI] [PubMed] [Google Scholar]
- White JG, Southgate E, Thompson JN, Brenner S. The structure of the nervous system of the nematode Caenorhabditis elegans. Phil. Trans. Roy. Soc. Lond. B. 1986;314:1–340. doi: 10.1098/rstb.1986.0056. [DOI] [PubMed] [Google Scholar]
- Yelnik J, François C, Percheron G, Tandé D. Morphological taxonomy of the neurons of the primate striatum. J. Comp. Neurol. 1991;313:273–294. doi: 10.1002/cne.903130207. [DOI] [PubMed] [Google Scholar]