

Abstract
Histones H2A and H2B form part of the same nucleosomal structure as H3 and H4. Stable HeLa cell lines expressing histones H2B, H3, and H4 tagged with green fluorescent protein (GFP) were established; the tagged molecules were assembled into nucleosomes. Although H2B-GFP was distributed like DNA, H3-GFP and H4-GFP were concentrated in euchromatin during interphase and in R-bands in mitotic chromosomes. These differences probably result from an unregulated production of tagged histones and differences in exchange. In both single cells and heterokaryons, photobleaching revealed that H2B-GFP exchanged more rapidly than H3-GFP and H4-GFP. About 3% of H2B exchanged within minutes, whereas ∼40% did so slowly (t 1/2 ∼ 130 min). The rapidly exchanging fraction disappeared in 5,6-dichloro-1-β-d-ribofuranosylbenzimidazole and so may represent H2B in transcriptionally active chromatin. The slowly exchanging fraction was probably associated with chromatin domains surrounding active units. H3-GFP and H4-GFP were assembled into chromatin when DNA was replicated, and then >80% remained bound permanently. These results reveal that the inner core of the nucleosome is very stable, whereas H2B on the surface of active nucleosomes exchanges continually.
Keywords: cell fusion, FRAP, histone actetylation, nucleosome, transcription
Introduction
DNA is packaged in eukaryotic cells into nucleosomes; ∼146 base pairs are wrapped around an octamer containing two copies of each of the four core histones, H2A, H2B, H3, and H4 (Luger et al. 1997). Nucleosomes are assembled with the assistance of chaperones like chromatin assembly factor 1 soon after DNA is made; DNA is first wrapped around H3-H4 tetramer before two H2A-H2B dimers are added (Ridgway and Almouzni 2000; Verreault 2000). In vitro studies show that the core histones are bound tightly to DNA in the nucleosome, and these interactions are probably “loosened” to allow other proteins such as polymerases access to the template (Workman and Kingston 1998; Wolffe and Hayes 1999). Current work focuses on how transcriptional activators, histone acetyltransferases and deacetylases, and chromatin remodelling complexes alter chromatin structure both locally at the nucleosome and more globally at the level of a chromatin domain (Belmont et al. 1999; Peterson and Workman 2000; Wolffe and Hayes 1999).
Various approaches have been used to assess how stably histones are bound. In a seminal series of studies, cells were incubated in radioactive amino acids, and exchange of newly made (that is, radiolabeled) histones with preexisting ones was monitored; H2A and H2B exchanged more rapidly than H3 and H4, and some of this exchange appeared to depend on continuing transcription (Jackson 1990). Other indirect approaches illustrate how complex the interactions are. For example, RNA polymerases usually transcribe nucleosomal templates in vitro less efficiently than naked ones (Wolffe and Hayes 1999), often without nucleosomal dissociation (Bednar et al. 1999). Transcription also seems to disrupt nucleosome structure in vivo (Orphanides and Reinberg 2000), but this need not necessarily be a direct consequence; for example, elongation by RNA polymerase II disrupts nucleosomes on the yeast hsp82 gene, but elongation by T7 RNA polymerase does not (Sathyanarayana et al. 1999). Depleting histone H4 in yeast might also be expected to “loosen” template–nucleosome interactions and improve polymerase access; whereas 15% of the genes were transcribed more rapidly, 10% became less active (Wyrick et al. 1999). Given the central role that histone DNA binding plays in gene expression, we reinvestigated the problem using an alternative technique.
The localization and kinetics of molecules within living cells can be monitored using the green fluorescent protein (GFP). A hybrid gene encoding the protein of interest fused with GFP is expressed in a cell so that the hybrid protein can be localized by its autofluorescence. This approach has been used with H2A, H2B, and the linker histone H1 (Kanda et al. 1998; Dey et al. 2000, Lever et al. 2000, Misteli et al. 2000; Perche et al. 2000; Phair and Misteli 2000). Photobleaching techniques such as FRAP then permit analysis of diffusion coefficients, rates of exchange of tagged proteins between different cellular compartments, and the proportions of mobile and immobile fractions (Ellenberg and Lippincott-Schwartz 1999; White and Stelzer 1999; Misteli 2001). After bleaching a small area in the nuclei, little H2A-GFP and H2B-GFP entered the bleached area over a period of several tens of seconds, suggesting that they were immobilized in nucleosomes; in contrast, H1 enters rapidly to restore fluorescence (Dey et al. 2000; Lever et al. 2000, Misteli et al. 2000; Perche et al. 2000; Phair and Misteli 2000).
We assessed how tightly histones were bound to DNA using three of the four core histones tagged with an “enhanced” version of GFP. Expression plasmids encoding histones H2B, H3, and H4 were constructed and transfected into HeLa cells, and clones expressing the tagged histones were derived. The cells progressed around the cell cycle with unchanged kinetics, and biochemical analyses showed that the tagged histones behaved much like their natural counterparts. Importantly, the tagged histones were incorporated into chromatin when it was replicated. However, although the three histones are found in equimolar amounts in most nucleosomes, H3-GFP and H4-GFP proved to be distributed differently from H2B-GFP. Kinetic analysis over several hours then showed that these differences resulted partly from differences in rates of incorporation into chromatin. H3-GFP and H4-GFP were assembled into chromatin when DNA was replicated, and then >80% remained bound permanently. In contrast, a significant fraction (∼40%) of H2B-GFP exchanged slowly, whereas ∼3% did so very rapidly (that is, within minutes). This rapidly exchanging fraction disappeared when transcription was inhibited by 5,6-dichloro-1-β-d-ribofuranosylbenzimidazole (DRB). These results reveal that the inner core of the nucleosome is very stable, whereas H2B on the surface of active nucleosomes is continually exchanging.
Materials and Methods
Plasmid Construction, Transfection, and Cell Fusion
Human H3 and H4 genes (sequence data available from GenBank/EMBL/DDBJ under accession nos. X0900, X60483) and the H2B-GFP expression vector were gifts from Y. Ishimi, T. Kanda, and G. Wahl (The Salk Institute, La Jolla, CA) (Ishimi et al. 1998; Kanda et al. 1998). The H3-GFP expression vector (pBOS-H3-N-GFP) was made in two steps. First, the H3-coding region was amplified (primers CCCGGTACCCATGGCTCGTACTAAAC, GCGGGATCCGCTCTTTCTCCGCGAATGC), and the PCR fragment and pBOS-H2BGFP-N1 were cut (KpnI, BamHI) and ligated; the resulting plasmid is similar to the H2B-GFP vector. Next, the BamHI-NotI fragment was replaced with the BglII-NotI fragment of pEGFP-N1 (CLONTECH Laboratories, Inc.) to generate pBOS-H3-N-GFP, which encodes the H3-GFP gene with a 23-residue linker driven by the elongation factor (EF)1α promoter and a blasticidin S resistance gene (Mizushima and Nagata 1990; Izumi et al. 1991). pBOS-H4-N-GFP was made similarly using primers CCCGGTACCCATGTCTGGCCGCGGCAA and GCGGGATCCCCACCGAAACCGTAGAGGGC; it encodes the H4-GFP gene with a 23-residue linker. HeLa cells were transfected (GenePorter; Gene Therapy Systems), 2 μg/ml blasticidin S (Invitrogen) was added after 24 h, and bright autofluorescent drug-resistant clones were selected for further analysis. Patterns of fluorescence were similar in different cell lines, regardless of average intensity. Different clones had unchanged cell cycles measured using a FACS® (Kimura et al. 1995), and typical populations contained the following fractions of G1, S, and G2/M cells, respectively: HeLa, 52, 24, and 24%; HeLa:H2B-GFP, 47, 27, and 26%; HeLa:H3-GFP, 47, 28, and 25%; and HeLa:H4-GFP, 45, 25, and 30%. Cells were fused using polyethylene glycol (Schmidt-Zachmann et al. 1993) after prelabeling DNA in “recipients” by “bead loading” (Manders et al. 1999) with Cy3-dUTP (Amersham Pharmacia Biotech) or growth for 24 h in 50 μM BrdU.
Gel Electrophoresis and Immunoblotting
Proteins were resolved in polyacrylamide gels and immunodetected (Kimura et al. 1999) using rabbit anti-GFP (8367-1; CLONTECH Laboratories, Inc.), anti-H2B, anti-H3 COOH-terminal peptide and anti-H4 (Stemmer et al. 1997), anti-acetylated or phosphorylated H3 (Upstate Biotechnology), and anti-acetylated H4 (Serotec). For Fig. 2 B, cells in physiological buffer (PB) (Kimura et al. 1999) were divided into five 100-μl aliquots. One (“total”) was mixed with 100 μl PB. Others were mixed with 100 μl PB plus 0.2% Triton X-100 and NaCl to give a final concentration of 0–2 M. After incubation (10 min at 0°C) and pelleting (20,000 g for 1 h at 4°C), the supernatant (180 μl) was collected and mixed with an equal volume of loading buffer. The pellet was resuspended in 180 μl PB and 200 μl 2× loading buffer added. For Fig. 2C and Fig. D, permeabilized cells were digested with HaeIII (Kimura et al. 1999); the supernatant was spun on a 10–30% glycerol gradient at 40,000 rpm for 1.5 h using SW55Ti, and 20 fractions were collected. After denaturation in 1% SDS, every other fraction was analyzed using gels (only fractions 1–11 are shown). For Fig. 2 E, 100 μl nucleosome core particles (Kanda et al. 1998) were immunoprecipitated using 10 μl anti-GFP antibody (8372-2; CLONTECH Laboratories, Inc.) and 500 μl protein A Dynabeads (Dynal). After washing (five times at 4°C) in a buffer (10 mM Tris, 10 mM EDTA, 250 mM NaCl, pH 8.0) with 0.1% Tween 20 and once in the buffer without Tween 20, the beads and the original nucleosome sample were incubated in 1% SDS. DNA was purified by phenol/chloroform extraction and ethanol precipitation and separated in 1.2% agarose gel. The nucleosomal proteins were also resolved in a 15% polyacrylamide gel stained with Coomassie, and band intensities were measured.
Figure 2.
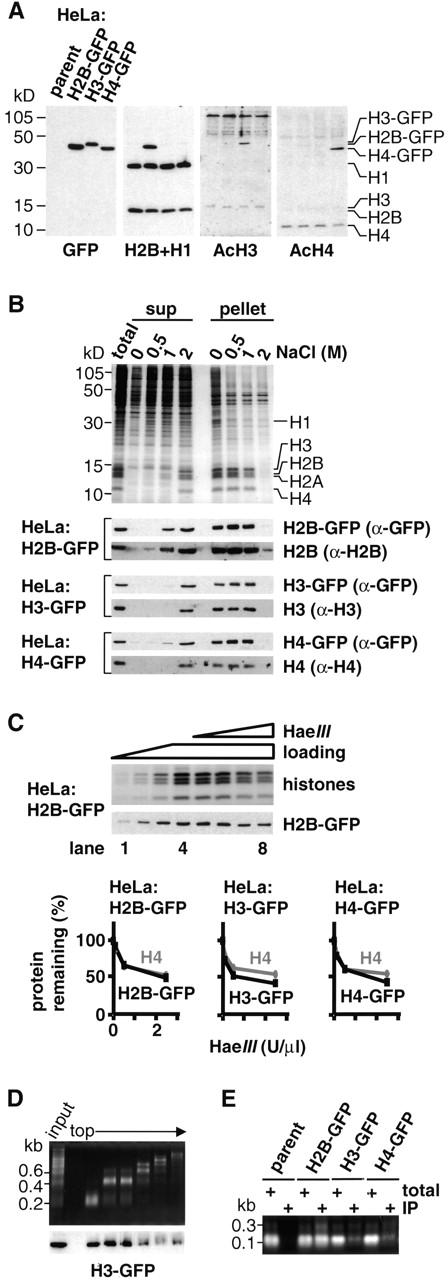
GFP-tagged histones behave like their endogenous counterparts. (A) Expression and acetylation. GFP, H2B, acetylated H3, and acetylated H4 are detected in immunoblots of the total proteins in parental cells and the three clones. Band intensities do not directly reflect expression levels because differences in charge and size affect transfer during blotting; thus, the H2B-GFP band in the second lane is more intense than the H2B band because it is transferred more efficiently and not because its expression level is higher (see also Kanda et al. 1998). (B) Solubility in NaCl. Cells were lysed in PB plus 0.1% Triton X-100 and 0–2 M NaCl and pelleted. Proteins from whole cells (total), the supernatant (sup), and pellet were resolved in gels and stained with Coomassie blue (top panel shows line expressing H2B-GFP) or blotted and probed with the antibodies indicated on the right (cell line shown on the left). (C) Sensitivity to HaeIII. (Top panel) Cells expressing H2B-GFP were lysed, incubated with or without HaeIII, and pelleted; then, proteins in the pellet were resolved by electrophoresis, stained with Coomassie (top), or immunoblotted using anti-GFP (bottom). (Lanes 1–4) All without HaeIII (loadings of 1/8×, 1/4×, 1/2×, and 1×, respectively). (Lanes 5–8) Treated with 0, 0.1, 0.5, or 2.5 U/μl HaeIII (all loadings 1×). (Bottom panels) The amounts of H4 and tagged histones remaining in pellets from the three clones after nuclease treatment and pelleting (from band intensities in stained gels and blots). (D) Cosedimentation with nucleosomal “ladder.” Cells expressing H3-GFP were permeabilized, incubated with HaeIII, and pelleted; after spinning released chromatin fragments in the supernatant through a glycerol gradient, DNA and proteins in the different fractions were analyzed by gel electrophoresis (“input” refers to material applied to the gradient). (Top) Nucleosomal “ladders” revealed after staining DNA with ethidium. (Bottom) H3-GFP detected by immunoblotting using anti-GFP; it is present in all fractions except the topmost. (E) Immunoprecipitation with DNA. Nucleosome core particles were prepared using micrococcal nuclease from four lines and immunoprecipitated using anti-GFP. Then, DNA in the starting material (total; 1/5× loading) and immunoprecipitated pellet (IP) was resolved by electrophoresis and stained with ethidium; core DNA fragments are immunoprecipitated from all lines except the parent.
Immunofluorescence and Microscopy
General procedures for fixation, immunolabeling, and image collection using an MRC1000 confocal microscope have been described (Kimura et al. 1999; Manders et al. 1999). Cells grown on glass-bottomed dishes (Mat-Tek) in 100 ng/ml Hoechst 33342 (Haraguchi et al. 1997) were imaged using a ZEISS Axiovert. Metaphase spreads were prepared using methanol-acetic acid or by cytospin, stained with 20 ng/ml Hoechst 33342, and images were collected; both methods gave similar distributions of histone-GFP, but fluorescence was weaker with methanol-acetic acid. For Fig. 3, an image was collected using the MRC1000 (closed pinhole of 0.7 mm, 1% laser power, slow scan mode, Kalman filtration of five to six images), an area covering parts of donor and recipient was nuclei scanned (10× zoom; 100% power) several times (20–30 s) until most signal disappeared from the bleached area, and images were collected subsequently using the original settings.
Figure 3.

Different behavior of histone-GFPs in heterokaryons. (A) Assays. Donor cells expressing histone-GFP are fused with recipient HeLa; the recipient nucleus in the resulting heterokaryon gains histone-GFP. (A, left, B–E) A rectangular area is photobleached. If histone-GFP is mobile, molecules from outside repopulate the bleached area, reducing fluorescence throughout nuclei; if immobile, the bleached area persists. (A, right, F–T) Heterokaryons are loaded with Cy3-dUTP, and any S phase nuclei incorporate Cy3-dUTP into characteristic foci. Heterokaryons may then pass through mitosis, and chromosomes originally from different nuclei segregate and assemble into chimeric daughter nuclei. The stages when confocal images are collected are indicated. (B and C) 5:45 h after fusion, this trikaryon contains one bright donor (arrow) and two recipients that have gained H2B-GFP (arrowheads). Now, the rectangular area is bleached. Approximately 1 min later, the bleached area in all three nuclei still persists, showing that H2B-GFP is immobile over this time scale. (D and E) 5:33 h after fusion, this trikaryon contains one bright donor (arrow), one recipient with some H4-GFP distributed in a pattern reminiscent of late-replicating DNA (filled arrowhead), and one recipient with diffusely spread H4-GFP (open arrowhead). After bleaching, most fluorescence is lost from the latter, showing that the H4-GFP within it is mobile. In contrast, bleached areas in the other two persist, indicating that their H4-GFP is immobile. (F–H) Tetrakaryon with one donor and three recipients; Cy3 labeling shows that no nuclei are in S phase, and all recipients possess diffuse distributions of H2B-GFP. (I–K) Trikaryon with two donors and one recipient. The recipient has a Cy3 pattern characteristic of mid–S phase. Some H2B-GFP is distributed diffusely, and some is concentrated in replication foci (yellow in the merge). (L–N) Dikaryon. Only the donor is labeled with Cy3 and so was in S phase; H3-GFP is spread homogeneously throughout the nucleoplasm in the non–S phase recipient. (O–Q) Tetrakaryon with one donor and three recipients. All recipients incorporated Cy3 into a mid–S phase pattern, and H3-GFP is distributed similarly; this suggests that the two were incorporated together. (R–T) Chimeric nucleus containing H4-GFP concentrated at the bottom derived from donor chromosomes and Cy3 at the top derived from recipients. The perinucleolar H4-GFP foci originally in the recipient retain their characteristic organization through mitosis, showing that some H4-GFP remains bound stably. Bars, 10 μm.
FRAP was performed using a Bio-Rad Laboratories μ Radiance confocal microscope (25 mW Ar laser; ZEISS Axiovert; 63× PlanApo, objective 1.4 NA). Cells on a glass-bottomed dish were grown at 37°C on a heated stage (Manders et al. 1999). One equatorial image (with maximal nuclear area) was collected (0.3% power; pinhole aperture of 4; fast scan mode; 7× zoom; Kalman filtration of three images), and 1.9 × 1.9 μm2 was bleached by scanning twice (∼0.2 s) with 100% power. After 15–30 s, second and subsequent images were collected using the original settings. The net intensity (after background subtraction) of the bleached area relative to that of the whole nucleus in each frame was measured using ImageJ version 1.16f (provided by W. Rasband, National Institutes of Health; http://rsb.info.nih.gov/ij/), and the intensity relative to the prebleached image was determined (Phair and Misteli 2000). Cells fixed with 4% paraformaldehyde (30 min) were used to provide “immobile” proteins, and after photobleaching they were used for determining “baseline” levels of autofluorescence (see Fig. 6 H). Nuclei moved during the long periods used in Fig. 6, and images of single equatorial sections (with maximal nuclear area) were collected subsequently. As most nuclear movements were rotations about the z axis, the bleached area could be identified easily (see Fig. 6 A); data from the few nuclei that rotated about the xy axis were discarded. In Fig. 6, association/dissociation kinetics were analyzed, assuming that tagged histones diffuse throughout nuclei in seconds. If there were one exchanging (“slow”) and one nonexchanging (“very slow”) population of histone-GFP, recovery should occur exponentially and be governed by R = C+P(1−exp−kt), where R = relative intensity, C = constant value at time zero, P = plateau value, k = association constant, and t = time. Then, the t 1/2 = −ln(1/2)/k. Curves were analyzed using GraphPad Prism version 3.02 (http://www.graphpad.com). If there were two exchanging populations (“rapid” and “slow”), recovery is governed by R = C+P(1−exp−kt) + P 2(1−exp−k2t), where P 1 and k1 refer to population 1 and P 2 and k2 to population 2.
Figure 6.
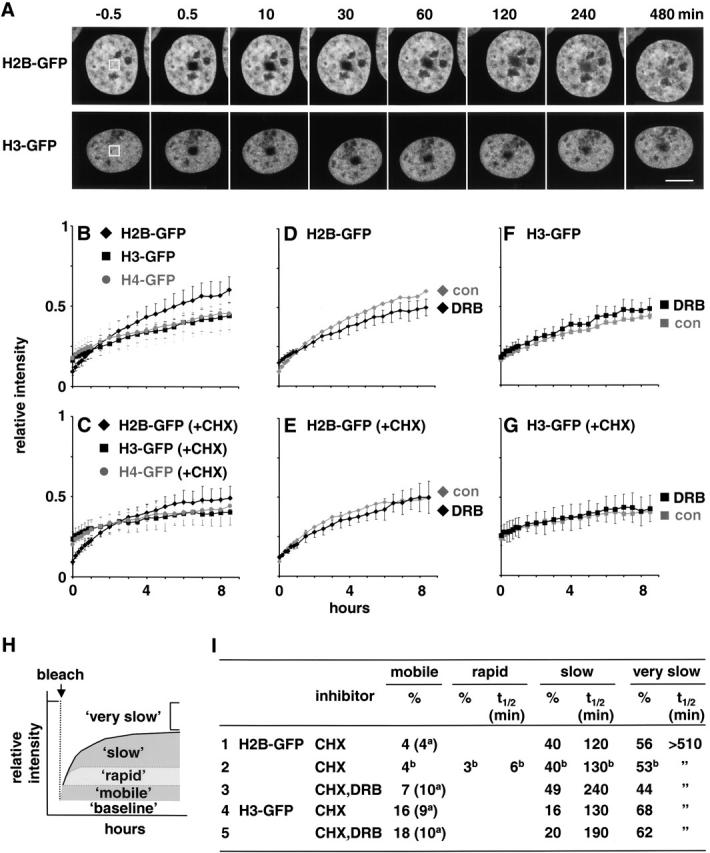
Different kinetic populations of histone-GFPs revealed by FRAP. (A) A small area within the nucleus of a cell expressing histone-GFP was bleached, and confocal images were collected every 10 min for 1 h and every 30 min thereafter. Typical images are shown. (B–G) Relative intensities (± SD; n = 9–22) within bleached areas were measured using images like those in A. In some cases, 20 μg/ml cycloheximide (CHX; C, E, and G) or 100 nM DRB (D–G) was added 30–60 min before bleaching. Grey lines (con) in D–G are reproduced from those in B and C. (H) Interpretation. The intensity is reduced by bleaching to a “baseline” (determined using fixed cells), and it then recovers as unbleached molecules enter. The rate and extent of recovery depend on the contribution of different kinetic fractions. Here, a “mobile” fraction diffuses in before the first image can be collected after bleaching. Then, a “rapid” fraction is initially dominant before a “slow” fraction becomes progressively more important; a “very slow” fraction enters too slowly to be monitored during the experiment. (I) Percentage of the population and association t 1/2 of different fractions (determined using data from C, E, and G). The percentage of the “mobile” fraction was generally increased in CHX so the value without CHX is also shown in brackets (a). With H2B-GFP in CHX (row 2), the curve was best fitted assuming there was also a “rapid” population (b).
Results
Cell Lines Expressing Histone-GFPs
HeLa cells were transfected with an expression plasmid encoding histone H2B-GFP, H3-GFP, or H4-GFP under the control of the EF1α promoter (Kanda et al. 1998). 20–40% colonies growing in the antibiotic were autofluorescent, and three of the brightest clones, named HeLa:H2B-GFP, HeLa:H3-GFP, and HeLa:H4-GFP, were selected for further analysis. All three progressed around the cell cycle with the same kinetics as parental cells (as described in Materials and Methods). As found previously (Kanda et al. 1998), H2B-GFP in living cells was concentrated in heterochromatin at the nuclear and nucleolar periphery (Fig. 1 A), which was brightly stained with Hoechst 33342 (Fig. 1 C; colocalization is indicated by yellow in the merge in Fig. 1 D). In mitotic cells, H2B-GFP was found exclusively in condensed chromosomes (Fig. 1, A–D), and in spreads it was again distributed like the dye (Fig. 1E and Fig. F).
Figure 1.

GFP-tagged histones in HeLa cells imaged by confocal and conventional microscopy. (A, G, and N) Single optical sections show H2B-GFP is more concentrated in heterochromatin than H3-GFP and H4-GFP. (Insets) High power views. (B–D, H–J, and O–Q) In each case, three views of the same field of live cells stained with Hoechst 33342 are shown (GFP and Hoechst are green and red in merges). (E–F, K–L, and R–S) Metaphase spreads were prepared, DNA was stained with Hoechst, and two views of the same field were collected. (Inset) Chromosome 1 (merge in middle). Bars, 10 μm.
Surprisingly, H3-GFP was distributed differently. It was more diffusely spread than H2B-GFP (Fig. 1G compared with A), and comparison with Hoechst staining (Fig. 1 I) showed it was more concentrated in euchromatin, giving tinges of green and red in the merge (Fig. 1 J). In mitotic chromosomes, it gave an R-band–like pattern complementary to the Hoechst pattern (Fig. 1 K and L; insets show chromosome 1, and the red and green in the merge highlight complementarity). H4-GFP was distributed like H3-GFP (Fig. 1, N–S).
H3-GFP and H4-GFP might behave differently from endogenous histones because the bulky tag prevents their incorporation into dense heterochromatin or promotes their dissociation. As we shall see, both are incorporated if present late in S phase when heterochromatin is replicated (see Fig. 3 O), and then they remain bound through mitosis (see Fig. 3 R). Since synthesis of native histones is tightly coupled to DNA synthesis (Osley 1991) and since these tagged histones are under the control of an unregulated promoter, the different distributions probably result from an unregulated accumulation of unincorporated pools during G1 phase coupled with an inevitable incorporation of those pools when euchromatin is replicated early during S phase; as a result, little H3-GFP or H4-GFP remain to be incorporated later into heterochromatin (see Fig. 7A and Fig. B). Although H2B-GFP synthesis is also uncoupled from replication, its continuous exchange ensures that its distribution reflects that of DNA.
Figure 7.
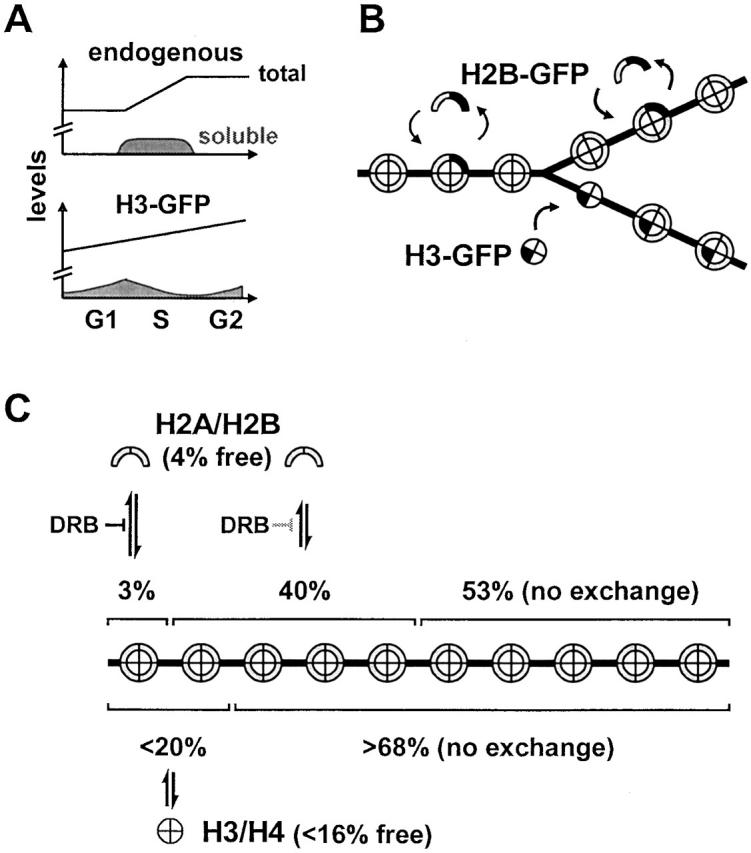
Models for histone exchange. (A) Changes in histone levels during the cell cycle. Endogenous histones are made mainly during S phase when a soluble pool is seen. Tagged histones are made continuously; the soluble pool that accumulates by the end of G1 phase is depleted in S phase (as histones are incorporated) and then replenished in G2 phase. (B) Incorporation of tagged histones (black areas) into chromatin. Nucleosomes are represented as circles with eight sectors, DNA as a forked line. H2B-GFP exchanges with H2B before, during (not shown), and after replication. H3-GFP is mainly incorporated into nucleosome cores near the replication fork; subsequently, it does not exchange. (C) Different kinetic populations. H2B is found in four populations: 4% diffuses freely, 3% in active transcription units exchanges rapidly (t 1/2 ∼ 6 min), 40% in the surrounding domains exchanges slowly (t 1/2 ∼ 130 min), and 53% in heterochromatin is essentially immobile (t 1/2 > 510 min). Although H2A was not studied, it is assumed to behave like H2B. H3 is found in three populations: <16% diffuses freely, <16% in and around active transcription units exchanges slowly (t 1/2 ∼ 130 min), and >68% is essentially immobile (this constitutes >80% of the incorporated fraction). H4 behaved similarly to H3. The diffusing and slowly exchanging fractions of H3-GFP and H4-GFP are overestimated because expression of the tagged histones is unregulated. DRB affects exchange as indicated.
Histone-GFPs Are Incorporated into Chromatin
We confirmed by immunoblotting that each line expressed the appropriate set of histones. Thus, an antibody directed against GFP detected one band of expected size in all three lines, but it did not detect the parent (Fig. 2 A, first lane). In addition, an antibody detecting both H2B and H1 gave two bands due to endogenous forms in all of the lines plus H2B-GFP in the expected line (Fig. 2 A, second lane). Quantitative analysis of Coomassie-stained bands from nucleosomal preparations (Fig. 2 E) showed that tagged histone represented 4–10% of the total histone and that there were roughly 1 × 10⁷, 0.4 × 10⁷, and 0.5 × 10⁷ molecules of H2B-GFP, H3-GFP, and H4-GFP, respectively (not shown).
Six criteria were used to assess whether the tagged histones were incorporated into chromatin. First, they were phosphorylated (not shown) and acetylated like their untagged counterparts; antibodies against acetylated H3 and H4 detected endogenous forms in all of the lines plus the expected forms in transfectants (Fig. 2 A, third and fourth lanes). Second, pools of soluble (unincorporated) histones were small, and the majority resisted extraction with NaCl, indicating that most are tightly bound. Thus, each line was lysed in an isotonic buffer supplemented with 0–2 M NaCl (Fig. 2 B, top panel). In the absence of NaCl, few histones were detected in the supernatant. 0.5 M NaCl extracted many proteins including H1, but core histones remained in the pellet. 1 M NaCl removed some H2A and H2B, and 2 M NaCl removed all of the core histones. Immunoblotting showed that tagged and untagged histones had similar extraction profiles (Fig. 2 B, bottom panels). Third, the histone-GFPs had the expected sensitivity to nucleases. Cells were lysed and treated with increasing concentrations of HaeIII to release chromatin into the supernatant; then, progressively fewer histones were recovered in the pellet (Fig. 2 C, top panel). Quantitative immunoblotting showed the tagged forms behaved much like the natural ones, although H3-GFP and H4-GFP appeared slightly more sensitive to detachment (Fig. 2 C, bottom panels). Fourth, histone-GFPs sedimented down a glycerol gradient with oligonucleosomes released by HaeIII digestion (Fig. 2 D; not shown). Fifth, mononucleosomal core particles released by micrococcal nuclease and then immunoprecipitated with anti-GFP contained DNA fragments of the appropriate size (Fig. 2 E). Sixth, H3-GFP and H4-GFP are incorporated into the appropriate replication foci with newly made DNA (even replication foci in heterochromatin) (see below). These results suggest that the histone-GFPs are incorporated into chromatin much like endogenous histones.
Several details seen in Fig. 2 B (and in overexposures; not shown) are consistent with previous work, and interpretations are discussed later. (a) Tagged H2B represents ∼10% of all H2B (as described above), and it should be detected easily if produced in addition to the normal amount. Since no H2B is seen, production of the natural histone must be reduced in compensation (Osley 1991). (b) Unlike H2B-GFP or native H3 and H4, small amounts of H3-GFP and H4-GFP are detected in the supernatant after extraction with 0 or 0.5 M NaCl. This is consistent with the presence of a small soluble pool (see below). (c) In addition to H2B and H2B-GFP, slightly more H3-GFP and H4-GFP are detected in the supernatant after extraction with 1 M NaCl; these are probably highly acetylated forms present in early replicating euchromatin. As a result, these forms contain high concentrations of H3-GFP and H4-GFP (see also Perry and Chalkley 1982; Li et al. 1993).
Different Populations of Histone-GFPs Detected in Heterokaryons
Incorporation of histone-GFPs into chromatin was examined using living heterokaryons; this enables us to monitor their localization and mobility just after they had entered nuclei. HeLa cells expressing histone-GFP were fused with their nonexpressing counterparts to give heterokaryons containing autofluorescent “donor” and nonfluorescing “recipient” nuclei; over the next few hours, recipient nuclei gradually gained fluorescence (Fig. 3 A). This increase is due to the slow import of both newly made and preexisting histone-GFP. Preliminary experiments revealed striking differences in the patterns of incorporation of the different tagged histones (not shown); therefore, their mobility was also investigated by photobleaching a rectangular area in the cell (Fig. 3 A). If molecules of histone-GFP outside the bleached area are mobile, many will repopulate the bleached area to give a uniform but reduced fluorescence throughout the nucleus. But if proteins are immobile, the bleached area persists.
One trikaryon containing H2B-GFP that gave typical results is illustrated in Fig. 3 B. 5:45 h after fusion, the two recipient nuclei (arrowheads) had gained some H2B-GFP to give a weak and diffusely spread fluorescence. This fluorescence was not concentrated in heterochromatin as in the donor nucleus (arrow). (This donor is overexposed. [Fig. 1 A, inset].) Rather, the diffuse pattern was reminiscent of that seen in cells expressing H3-GFP or H4-GFP (that is, enriched in euchromatin as in Fig. 1G and Fig. N). Then, the rectangular region was bleached, and an image was collected immediately. The bleached region in donor and recipient nuclei remained (Fig. 3 C), indicating that H2B-GFP was so immobile that little was able to enter the rectangular area during and/or after bleaching.
Analogous experiments with H4-GFP gave different results. Thus, the trikaryon illustrated in Fig. 3 D contains two recipient nuclei with different patterns: one homogeneous (open arrowhead) and the other (filled arrowhead) with foci reminiscent of the replication sites seen in mid–S phase (O'Keefe et al. 1992). Photobleaching then reduces fluorescence throughout one recipient nucleus but not the other (Fig. 3 E). In one (open arrowhead), H4-GFP is so mobile it repopulates the bleached area, whereas in the other (filled arrowhead) it is essentially immobile. Many such experiments confirmed this general conclusion: when H4-GFP (and H3-GFP; not shown) is distributed homogeneously, it is mobile (and so unincorporated), and when focally concentrated it is immobile (and so incorporated). When replication after cell fusion is inhibited by aphidicolin, no recipient nucleus showing the focal concentration was observed (not shown). This suggests that H3-GFP and H4-GFP, unlike H2B-GFP, might be incorporated into nucleosomes only when chromatin is replicated during S phase.
Incorporation of H3-GFP and H4-GFP during S Phase
We confirmed this replication-dependent incorporation of H3-GFP and H4-GFP using the strategy outlined on the right of Fig. 3 A. Cells expressing histone-GFP were fused with nonexpressors (as before), and the resulting heterokaryons were loaded with Cy3-dUTP. Cy3-dUTP quickly diffuses throughout the cell and often becomes concentrated in cytoplasmic vesicles; however, if any nuclei are in S phase they are incorporated into DNA to give characteristic fluorescent foci (Manders et al. 1999). When the heterokaryon progresses through mitosis and nuclei reform in daughters, chromosomes originally from donor and recipient nuclei may end up in one (chimeric) nucleus.
Fig. 3F–H, illustrates three views of a living tetrakaryon with one donor nucleus expressing H2B-GFP and three recipients. No nuclei are in S phase, since none are labeled with Cy3 (Fig. 3 G). All of the recipients have acquired roughly similar distributions of H2B-GFP, although with differing intensities (Fig. 3 F). Molecules seem first to pass from the donor to the nearest recipient, probably because nuclear import is relatively rapid compared with diffusion through the cytoplasm. In Fig. 3I–K, the heterokaryon contains one recipient nucleus that has incorporated Cy3 into the pattern characteristic of mid–S phase (Fig. 3 J). Some H2B-GFP is diffusely spread, and some is concentrated in replication foci (Fig. 3 I), giving yellow in the merge (Fig. 3 K). This suggests that some H2B-GFP is incorporated without replication and some coincidentally with DNA synthesis.
Although patterns of H2B-GFP in non–S and S phase recipients are similar, those of H3-GFP and H4-GFP (not shown) are not. Thus, H3-GFP is spread homogeneously throughout the nucleoplasm in non–S phase recipients (Fig. 3, L–N) but concentrated in replication foci in S phase recipients (Fig. 3, O–Q; note yellow in the merge). This is again consistent with preferential incorporation of H3-GFP into chromatin during DNA synthesis. If the nucleus is not in S phase, these tagged histones can enter to give a homogeneous distribution (Fig. 3 D, open arrowhead; Fig. 3, L–N); however, they are not incorporated into chromatin, and they remain mobile (Fig. 3 E, open arrowhead).
These focal concentrations of histone-GFP can be maintained stably through mitosis. Thus, the nucleus illustrated in Fig. 3R–T, contains two regions. The lower half is rich in nucleoplasmic H4-GFP but contains little Cy3; it is derived from a donor nucleus in a heterokaryon. The top half is rich in Cy3 with local concentrations of H4-GFP around nucleoli; it is derived from a recipient nucleus that was in S phase just after fusion. This heterokaryon passed through mitosis during the next ∼20 h, and focal concentrations of H4-GFP persisted as chromosomes from the two nuclei were incorporated into one (chimeric) daughter. Similar results were obtained with H3-GFP (not shown).
The slow equilibration of H3-GFP and H4-GFP was confirmed using a different strategy. In this strategy, cells were pulse-labeled with Cy3-dUTP before fusion, and chimeric nuclei were generated as before (Fig. 4 A). Three views of two living daughters each with a chimeric nucleus are illustrated in Fig. 4B–D. 16 h after fusion, H3-GFP and Cy3-DNA are still concentrated in separate parts of the nuclei; H3-GFP is bound so stably it fails to equilibrate. Recipient cells were also prelabeled with BrdU so that DNA in chimeric nuclei could be immunolabeled (Fig. 4, E–G). Then, GFP fluorescence in donor and recipient (that is, Br-containing) parts was measured and expressed as a ratio. Quantitative analysis of many such chimeric nuclei (and of dikaryons in the same population) revealed that H2B-GFP spread more rapidly than H3-GFP and H4-GFP into a recipient region; for example, H2B-GFP had completely equilibrated within 48 h (that is, the ratio reached unity), but the other two had not equilibrated after 96 h (Fig. 4 H). This faster H2B-GFP equilibration could be due to its faster synthesis. Then, it should equilibrate between different regions of chimeric nuclei and between the different nuclei in dikaryon at the same rate. Unlike H3-GFP and H4-GFP, it equilibrated faster between the different regions in chimeric nuclei (Fig. 4 H), suggesting that the differences seen arise from differences in exchange rate.
Figure 4.
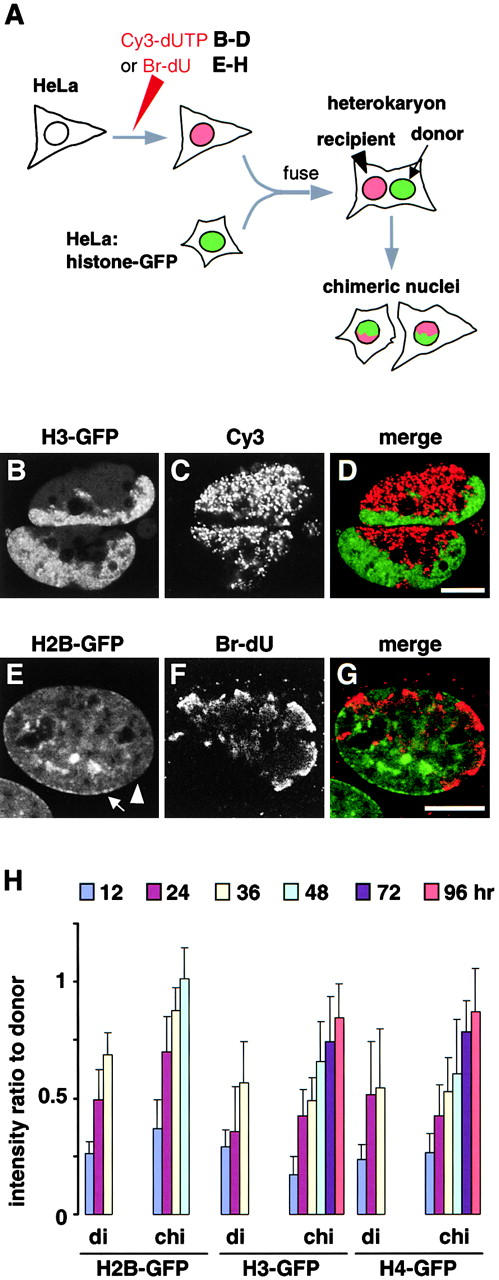
Slow equilibration of histone-GFP in chimeric nuclei. (A) Assays. HeLa cells were labeled with Cy3-dUTP or BrdU, fused with cells expressing histone-GFP, and the resulting heterokaryons were allowed to pass through mitosis so that chromosomes from different nuclei assembled into one chimeric daughter. Recipient chromosomes are identified in living cells or indirectly by immunolabeling fixed cells. (B–D) HeLa cells were loaded with Cy3-dUTP, grown for 20 h, fused with cells expressing H3-GFP, and regrown for ∼16 h. Three views of one confocal section through two living chimeric daughters are shown; H3-GFP in each daughter is concentrated in one part, and Cy3-DNA is concentrated in the other. (E–G) HeLa cells were grown in BrdU for 24 h, fused, fixed 36 h later, Br-DNA immunolabeled, and three views of one confocal section of a chimeric nucleus were collected. H2B-GFP remains concentrated in donor heterochromatin (arrow), but has not yet equilibrated with recipient heterochromatin (arrowhead). (H) The intensity of histone-GFP autofluorescence in recipient regions (containing Br-DNA) relative to that in donor regions (lacking Br-DNA) was measured using images of chimeric nuclei (chi; n > 29) like those in E–G and of nuclei in dikaryons (di; n > 19) in the same population. Bars, 10 μm.
FRAP: Analysis over Seconds Reveals Different Soluble Pools
We next examined the striking differences in histone mobility seen in Fig. 3B–E, using the strategy illustrated in Fig. 5 A. A small area in a recipient nucleus was bleached (at t 0) and the intensity within it monitored every 15 s for 2 min (between t 15 and t 120). If all of the molecules are “mobile” (that is, freely diffusible or able to dissociate and rebind within 15 s), the intensity in the bleached area relative to that in the whole nucleus will rise within 15 s to the maximum and will not change thereafter (scenario 1). If all are “immobile” (that is, bound for >15 s), sampling after 15 s will reveal a slow (s) or rapid (r) recovery depending on rates of dissociation and reassociation (scenario 2). If a fraction is “mobile,” that fraction will recover by t 15, and any subsequent increase will also depend on dissociation and association rates (scenario 3). Images from a typical experiment are shown in Fig. 5 B, and results from several are presented in Fig. 5 C.
Figure 5.
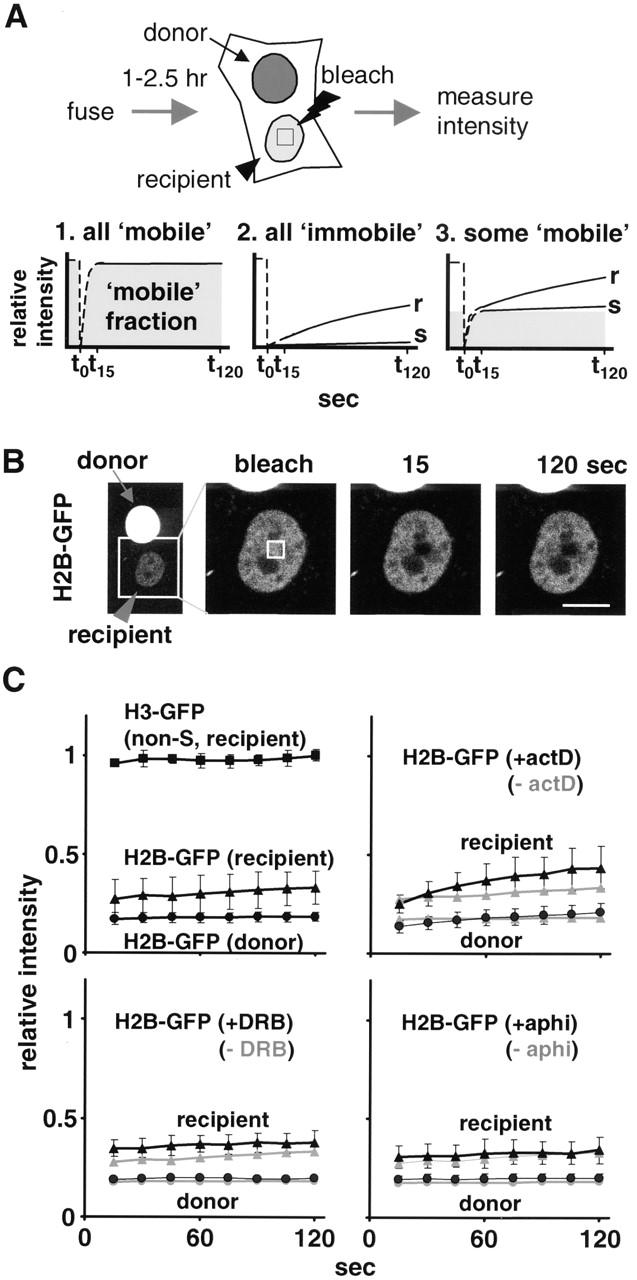
Soluble pools measured using FRAP. (A) Strategy and different scenarios illustrating how the mobile fraction affects recovery (as described in Results). (B) 2:26 h after fusion, images were collected shortly before and after bleaching part of a recipient nucleus in a dikaryon. (C) Relative intensities (± SDs; n = 10–16) of bleached areas. In some cases, actD (5 μg/ml), DRB (100 nM), or aphidicolin (aphi; 5 μg/ml) was added 1 h before fusion. Results for H2B-GFP in S phase and non–S phase nuclei are pooled, since they differed little. Curves for H2B-GFP without inhibitor (left, top and bottom) are presented in the other panels in grey.
Data from H3-GFP and H4-GFP in non–S phase recipient nuclei fit scenario 1; fluorescence recovers within 15 s and remains constant thereafter (Fig. 5 C, top left; not shown). Although these two enter recipient nuclei in 1 or 2 h after fusion, they are not assembled into chromatin. In S phase recipients, some H3-GFP is immobilized during the same period (not shown). In contrast, H2B-GFP in recipients behaves quite differently, with results fitting scenario 3, curve s (Fig. 5 C, top left). This suggests that H2B-GFP enters recipients and is incorporated into chromatin (and therefore immobilized). These results confirm that H2B-GFP is incorporated quickly and that unincorporated pools of H3-GFP and H4-GFP accumulate in non–S phase cells.
This strategy was now used to investigate how different inhibitors affected incorporation of H2B-GFP. Actinomycin D (actD) increased the slope of the curve in recipients (Fig. 5 C, top right, +actD); this increase in exchange rate could be due to competition for binding sites or alterations in supercoiling rather than through a general inhibition of transcription (Hendzel and Davie 1990; Jackson 1990). DRB, an inhibitor of RNA polymerase II (Sehgal et al. 1976), increased the mobile fraction (Fig. 5 C, bottom left, +DRB). (We also used the specific inhibitor of pol II, α-amanitin, but found that high concentrations and long exposures were needed to ensure substantial inhibition, and these complicated interpretation.) In contrast, aphidicolin, an inhibitor of DNA polymerases involved in both replication and repair (Wang 1991), had little effect (Fig. 5 C, bottom right, +aphi). These measurements over periods of tens of seconds suggest transcription by RNA polymerase II promotes exchange of some H2B-GFP.
FRAP: Analysis over Hours Reveals Different Bound Populations
A small area in the nucleus of a single (unfused) cell was bleached, and images were collected for 8.5 h (Fig. 6 A); some cells entered mitosis during this period and most divided subsequently, suggesting that bleaching and imaging did not affect viability (see also Kruhlak et al. 2000). H2B-GFP fluorescence fell on bleaching further than H3-GFP and H4-GFP fluorescence (Fig. 6 B), indicating that more H3-GFP and H4-GFP (∼9 versus ∼4% H2B-GFP) are mobile and able to diffuse back into the bleached area before collection of the first image. Subsequently, H2B-GFP fluorescence recovered more rapidly (Fig. 6 B). Unfortunately, interpretation is complicated by synthesis of new protein. Therefore, protein synthesis was inhibited with cycloheximide, which also inhibits replication (Bonner et al. 1988). Then, the same general patterns were found, suggesting that most recovery depends on exchange of preexisting histone-GFPs. However, the “mobile” fraction of H3-GFP and H4-GFP increased slightly, and the recovery of all of the histones was slower (Fig. 6 C).
These recovery curves are simply explained if there are at least two exchanging populations: a “slow” one responsible for the partial recovery during the first 8.5 h and a “very slow” population that was so immobile that it never exchanged during this period (Fig. 6 H). (Both populations exchange too slowly to be detected during the 120 s used with heterokaryons and therefore constitute the “immobile” fraction seen in Fig. 5.) About 40% of H2B-GFP exchanged slowly (Fig. 6 I, row 1), but only 16% H3-GFP and 22% H4-GFP (Fig. 6 I, row 4; not shown). Although all of the data in Fig. 6B–G, can be fitted assuming there are two exchanging populations, the data for H2B-GFP are fitted even better if there is an additional “rapid” population that dominates initial recovery (Fig. 6 H); then, 3% H2B-GFP would exchanged rapidly and 40% would exchange slowly with the remainder being immobile (Fig. 6 I, row 2). (Analysis of the kinetics yields the minimum number of populations required to fit the data, and more populations may actually exist.)
DRB slowed recovery of H2B-GFP (Fig. 6 D), suggesting that some exchange depended on transcription, and the kinetics in cycloheximide were best fitted if DRB-induced complete loss of the “rapid” fraction (Fig. 6 I, row 3). These results and those on heterokaryons (Fig. 5) suggest that the “rapid” and “slow” populations are transcription dependent and independent, respectively. In contrast, DRB alone and in cycloheximide had little effect on H3-GFP or H4-GFP (Fig. 6F and Fig. G; not shown), consistent with transcription-independent exchange of their “slow” fractions.
Discussion
Various interrelated factors probably promote histone exchange, including the direct action of polymerases and remodelling complexes, acetylation and methylation of nucleosomal components, and the supercoiling and compaction of templates. For example, an elongating polymerase might temporarily displace H2A and H2B or even a whole nucleosome; alternatively, it might transfer a newly encountered octamer from one side to another without release (van-Holde et al. 1992; Bednar et al. 1999). Histone acetylation reduces the positive charge on a histone and could therefore weaken binding to negatively charged DNA; indeed, it has subtle effects on nucleosome stability in vitro (Turner 1991; Ito et al. 2000). Since chromatin in active transcription units is hyper-acetylated and may be depleted of H2A/H2B and since histone acetylases are associated with transcriptional activators and polymerases, nucleosomes at promoters or next to an engaged polymerase might be destabilized (Perry et al. 1993; Wolffe and Hayes 1999; Orphanides and Reinberg 2000). Alternatively, acetylation of nucleosomes throughout active domains (Hebbes et al. 1994) suggests that exchange may be more widespread.
Since we still know little about the stability of nucleosomal histones in vivo, we analyzed the dynamics of three histones tagged with GFP in living cells. Expression plasmids encoding histones H2B, H3, and H4 connected through COOH-terminal linkers of six residues to GFP were constructed. The COOH terminus of H2B lies on the nucleosomal surface (Luger et al. 1997) and brightly fluorescing cell lines expressing H2B-GFP were obtained readily (see also Kanda et al. 1998). However, the COOH termini of H3 and H4 lie internally, and only a few lines expressing low levels of H3-GFP or H4-GFP were obtained (not shown); presumably, the bulky GFP moiety is not easily accommodated in a nucleosome. In contrast, many brightly fluorescing lines were derived using linkers of 23 residues, which could extend to the exterior. Three clones were selected for further study; they expressed H2B-GFP with a short linker and H3-GFP or H4-GFP with the longer linker. All progressed around the cell cycle with unchanged kinetics (as described in Materials and Methods), and all three tagged molecules were incorporated into chromatin: little soluble form could be detected (Fig. 2 B) and all resisted extraction by NaCl but could be detached by nucleases (Fig. 2B and Fig. C), cosedimented with oligonucleosomes released by HaeIII (Fig. 2 D), and could be immunoprecipitated with appropriately sized DNA fragments from mononucleosomes prepared using micrococcal nuclease (Fig. 2 E). In addition, they were appropriately acetylated and phosphorylated (Fig. 2 A; not shown), and most importantly they were incorporated with a DNA precursor, Cy3-dUTP, into the appropriate replication foci during S phase (for example, Fig. 3K, Fig. Q, and Fig. T). These results suggest they are all assembled into nucleosomes much like their untagged counterparts.
Different Distributions Explained by Unregulated Expression
H2B-GFP was distributed in the cell line much like DNA (Fig. 1, A–F), but H3-GFP and H4-GFP were concentrated in euchromatin during interphase (Fig. 1, G–S) and in R-bands in mitotic chromosomes (Fig. 1K, Fig. L, Fig. R). The latter distribution could arise if there were large soluble pools or if the bulky tag decreased incorporation into (or increased dissociation from) heterochromatin. However, bleaching a small area in nuclei expressing H3-GFP and H4-GFP did not change the general pattern (not shown), making it unlikely that a large soluble pool existed. In addition, both H3-GFP and H4-GFP are incorporated into heterochromatin late during S phase when it is replicated (Fig. 3D and O–Q), and once incorporated both are stably maintained through mitosis (Fig. 3 R). Since these possibilities can be eliminated, the differences probably result from an unregulated production of histone message (Fig. 7 A). Thus, levels of messages encoding the natural histones rise and fall 35-fold during entry and exit from S phase due to increases in message production and stability (Osley 1991). However, the tagged histones are under the (unregulated) control of the EF1α promoter, and the resulting messages are probably polyadenylated inappropriately. Then, H3-GFP and H4-GFP will accumulate during G1 phase to form a soluble pool and will inevitably be incorporated into euchromatin as soon as replication begins (Fig. 7 B). Various observations support this interpretation: the appropriate pools are detected biochemically (Fig. 2) and by photobleaching (Fig. 3, Fig. 5, and Fig. 6), and few molecules are incorporated except during S phase (Fig. 3 Fig. 4 Fig. 5 Fig. 6). Although synthesis of H2B-GFP is also uncoupled from replication, its continuous exchange ensures that its distribution reflects that of DNA. Later in S phase, H2B-GFP released from active chromatin is still available for assembly into heterochromatin; however, several cell generations are needed for full equilibration (for example, Fig. 4, E–H).
Some Exchange of H2B-GFP but Little of H3-GFP or H4-GFP
FRAP studies over periods of several minutes show that H2A-GFP and H2B-GFP are stably incorporated into chromatin, whereas H1-GFP exchanges rapidly (Dey et al. 2000; Lever et al. 2000; Misteli et al. 2000; Perche et al. 2000; Phair and Misteli 2000). Using four different approaches, we show that some H3-GFP and H4-GFP and even more H2B-GFP exchange over longer periods. After photobleaching part of a “recipient” nucleus in a heterokaryon, most newly acquired H3-GFP and H4-GFP but not H2B-GFP can reenter the bleached area over the next few minutes (Fig. 3, B–E, and Fig. 5); the first two remain unincorporated and can diffuse freely, but H2B-GFP has been immobilized by incorporation in euchromatin (Fig. 3 B). Second, quantitative analysis with both heterokaryons and chimeric nuclei show that H3-GFP and H4-GFP take twice as long as H2B-GFP to equilibrate between donor and recipient chromatin (Fig. 4 H). Third, after photobleaching a small area in single cells they enter the bleached area more slowly (Fig. 6B and Fig. C). Fourth, once incorporated into replication foci during S phase (Fig. 3, O–Q) they are stably maintained and can even persist through mitosis (for example, Fig. 3, R–T). These results are consistent with those obtained previously (Jackson and Chalkley 1985; Louters and Chalkley 1985; Hendzel and Davie 1990).
Transcriptional Activity of the Different Populations
Quantitative analysis of data obtained using FRAP over 8 h enabled rough estimates of how much and how rapidly the histones exchanged (Fig. 6). All contained at least two kinetic populations: a “slow” one responsible for partial recovery and a “very slow” one that appeared essentially immobile (Fig. 6H and Fig. I). However, data for H2B-GFP could be fitted even better if there was an additional “rapid” fraction (Fig. 6 I, row 2). What underlies such differences in exchange?
The “rapid” fraction (apparent association t 1/2 ∼ 6 min) of H2B-GFP represents ∼3% of the total (Fig. 6 I, row 2). It is probably derived from active transcription units, since an equivalent fraction of the genome is transcribed and addition of the transcriptional inhibitor, DRB, eliminates it (Fig. 6 I, rows 2 and 3). Moreover, DRB prevents immobilization of the mobile fraction in heterokaryons (Fig. 5 C). These results are consistent with transcription by RNA polymerase II either directly or through the agency of associated factors such as facilitating chromatin transcription (Orphanides and Reinberg 2000), driving H2A and H2B off the template. Unfortunately, DRB is a protein kinase inhibitor that could act in other ways (for example, through histone phosphorylation). Therefore, we tested other inhibitors of transcription. ActD has been used previously to study exchange (Hendzel and Davie 1990; Jackson 1990), and it increased H2B-GFP exchange (Fig. 5 C; not shown). However, it could also act indirectly by loosening interactions between H2B and DNA either by competing with histones for binding sites or by altering DNA supercoiling. Indeed, H2A and H2B are extracted more easily with NaCl after incubating permeabilized cells with actD or ethidium, another intercalator (not shown). α-Amanitin, a specific inhibitor of RNA polymerase II, also proved unsuitable because such long incubations were required to obtain substantial inhibition of transcription (not shown; Nguyen et al. 1996). Therefore, results obtained with these other inhibitors were difficult to interpret.
The “slow” population of H2B-GFP (t1/2 ∼ 130 min) constitutes ∼40% of the total (Fig. 6 I, row 2, and Fig. 7 C). As this fraction is 10-fold larger than that occupied by active transcription units, it may be derived from the nuclease-sensitive domains of equivalent size that flank such units (Bell and Felsenfeld 1999). Then, DRB would be expected to have little effect on it (Fig. 6 I, row 3). Since these domains also contain acetylated H3 and H4 (Hebbes et al. 1994; O'Neill et al. 1999), perhaps acetylation drives exchange by altering nucleosomal structure, recruiting other factors, or “opening” chromatin. The remaining ∼53%, which was essentially immobile (t 1/2 > 510 min), probably represents heterochromatin (see also Fig. 4 E, arrow). As analysis of the kinetics yields the minimum number of populations required to fit the data, further subpopulations (for example, centromeric heterochromatin) may be contained within this immobile fraction.
Only ∼20% of H3-GFP and H4-GFP exchanged (Fig. 6 and Fig. 7). This exchange was not stimulated by transcription or replication; DRB had little effect (Fig. 6D, Fig. E, and Fig. I), and these histones remained through S phase (Fig. 4 and Fig. 6); therefore, it is probably driven by other factors that remodel or by acetylate euchromatin. (Even less H3 and H4 may exchange, since they are more concentrated in heterochromatin than their tagged counterparts, and they will do so more slowly since their soluble pools are lower [Fig. 1 and Fig. 2 B].)
Any data obtained using FRAP should be treated cautiously because photobleaching could damage DNA and activate repair pathways, and in turn these could indirectly affect histone exchange (Ridgway and Almouzni 2000). However, the main conclusions concerning the different behavior of H2B-GFP and H3/H4-GFP were supported by others obtained using unbleached heterokaryons (Fig. 3 and Fig. 4).
Concluding Remarks
Although H3 and H4 form part of the same nucleosomal structure as H2A and H2B, their stabilities in chromatin are clearly very different. Most H3 and H4 are incorporated into chromatin as DNA is replicated (Fig. 7 B), and thereafter >80% remains bound permanently (Fig. 7 C). In contrast, ∼3% H2B exchanges very rapidly (t 1/2 ∼ 6 min), ∼40% slowly (t 1/2 ∼ 130 min), and ∼53% does not exchange (Fig. 7 C). The sizes of the exchanging populations suggest that they might be associated with active transcription units, their surrounding chromatin domains, and heterochromatin, respectively. The stability of the central H3 and H4 coupled with the lability of the outer H2A and H2B suggest simple ways of maintaining epigenetic marks (Turner 2000); modification of H3 and H4 could provide a long term “memory,” whereas modifying the latter would provide a more transient “signal.”
Acknowledgments
We thank Y. Ishimi, S. Muller, and T. Kanda and G. Wahl for kindly supplying the histone H3 and H4 genes, antihistone antibodies, and H2B-GFP expression vectors, respectively. We also thank S. Cobbold, P. Lewis, C.-Y. Lin, D. Mason, and N. Takagi for their help.
This work was supported by the Wellcome Trust.
Footnotes
Abbreviations used in this paper: actD, actinomycin D; DRB, 5,6-dichloro-1-β-d-ribofuranosylbenzimidazole; EF, elongation factor; GFP, green fluorescent protein; PB, physiological buffer.
References
- Bednar J., Studitsky V.M., Grigoryev S.A., Felsenfeld G., Woodcock C.L. The nature of the nucleosomal barrier to transcriptiondirect observation of paused intermediates by electron cryomicroscopy. Mol. Cell. 1999;4:377–386. doi: 10.1016/s1097-2765(00)80339-1. [DOI] [PubMed] [Google Scholar]
- Bell A.C., Felsenfeld G. Stopped at the borderboundaries and insulators. Curr. Opin. Genet. Dev. 1999;9:191–198. doi: 10.1016/S0959-437X(99)80029-X. [DOI] [PubMed] [Google Scholar]
- Belmont A.S., Dietzel S., Nye A.C., Strukov Y.G., Tumbar T. Large-scale chromatin structure and function. Curr. Opin. Cell Biol. 1999;11:307–311. doi: 10.1016/S0955-0674(99)80041-6. [DOI] [PubMed] [Google Scholar]
- Bonner W.M., Wu R.S., Panusz H.T., Muneses C. Kinetics of accumulation and depletion of soluble newly synthesized histone in the reciprocal regulation of histone and DNA synthesis. Biochemistry. 1988;27:6542–6550. doi: 10.1021/bi00417a052. [DOI] [PubMed] [Google Scholar]
- Dey A., Ellenberg J., Farina A., Coleman A.E., Maruyama T., Sciortino S., Lippincott-Schwartz J., Ozato K. A bromodomain protein, MCAP, associates with mitotic chromosomes and affects G(2)-to-M transition. Mol. Cell. Biol. 2000;20:6537–6549. doi: 10.1128/mcb.20.17.6537-6549.2000. [DOI] [PMC free article] [PubMed] [Google Scholar]
- Ellenberg J., Lippincott-Schwartz J. Dynamics and mobility of nuclear envelope proteins in interphase and mitotic cells revealed by green fluorescent protein chimeras. Methods. 1999;19:362–372. doi: 10.1006/meth.1999.0872. [DOI] [PubMed] [Google Scholar]
- Haraguchi T., Kaneda T., Hiraoka Y. Dynamics of chromosomes and microtubules visualized by multiple-wavelength fluorescence imaging in living mammalian cellseffects of mitotic inhibitors on cell cycle progression. Genes Cells. 1997;2:369–380. doi: 10.1046/j.1365-2443.1997.1280326.x. [DOI] [PubMed] [Google Scholar]
- Hebbes T.R., Clayton A.L., Thorne A.W., Crane-Robinson C. Core histone hyperacetylation co-maps with generalized DNase I sensitivity in the chicken b-globin chromosomal domain. EMBO J. 1994;13:1823–1830. doi: 10.1002/j.1460-2075.1994.tb06451.x. [DOI] [PMC free article] [PubMed] [Google Scholar]
- Hendzel M.J., Davie J.R. Nucleosomal histones of transcriptionally active/competent chromatin preferentially exchange with newly synthesized histones in quiescent chicken erythrocytes. Biochem. J. 1990;271:67–73. doi: 10.1042/bj2710067. [DOI] [PMC free article] [PubMed] [Google Scholar]
- Ishimi Y., Komamura Y., You Z., Kimura H. Biochemical function of mouse minichromosome maintenance 2 protein. J. Biol. Chem. 1998;273:8369–8375. doi: 10.1074/jbc.273.14.8369. [DOI] [PubMed] [Google Scholar]
- Ito T., Ikehara T., Nakagawa T., Kraus W.L., Muramatsu M. p300-mediated acetylation facilitates the transfer of histone H2A-H2B dimers from nucleosomes to a histone chaperone. Genes Dev. 2000;14:1899–1907. [PMC free article] [PubMed] [Google Scholar]
- Izumi M., Miyazawa H., Kamakura T., Yamaguchi I., Endo T., Hanaoka F. Blasticidin S-resistance gene (bsr)a novel selectable marker for mammalian cells. Exp. Cell Res. 1991;197:229–233. doi: 10.1016/0014-4827(91)90427-v. [DOI] [PubMed] [Google Scholar]
- Jackson V., Chalkley R. Histone synthesis and deposition in the G1 and S phases of hepatoma tissue culture cells. Biochemistry. 1985;24:6921–6930. doi: 10.1021/bi00345a026. [DOI] [PubMed] [Google Scholar]
- Jackson V. In vivo studies on the dynamics of histone-DNA interactionevidence for nucleosome dissolution during replication and transcription and a low level of dissolution independent of both. Biochemistry. 1990;29:719–731. doi: 10.1021/bi00455a019. [DOI] [PubMed] [Google Scholar]
- Kanda T., Sullivan K.F., Wahl G.M. Histone-GFP fusion protein enables sensitive analysis of chromosome dynamics in living mammalian cells. Curr. Biol. 1998;8:377–385. doi: 10.1016/s0960-9822(98)70156-3. [DOI] [PubMed] [Google Scholar]
- Kimura H., Takizawa N., Nozaki N., Sugimoto K. Molecular cloning of cDNA encoding mouse Cdc21 and CDC46 homologs and characterization of the productsphysical interaction between P1(MCM3) and CDC46 proteins. Nucl. Acids Res. 1995;23:2097–2104. doi: 10.1093/nar/23.12.2097. [DOI] [PMC free article] [PubMed] [Google Scholar]
- Kimura H., Tao Y., Roeder R.G., Cook P.R. Quantitation of RNA polymerase II and its transcription factors in an HeLa cellslittle soluble holoenzyme but significant amounts of polymerases attached to the nuclear substructure. Mol. Cell. Biol. 1999;19:5383–5392. doi: 10.1128/mcb.19.8.5383. [DOI] [PMC free article] [PubMed] [Google Scholar]
- Kruhlak M.J., Lever M.A., Fischle W., Verdin E., Bazett-Jones D.P., Hendzel M.J. Reduced mobility of the alternate splicing factor (ASF) through the nucleoplasm and steady state speckle compartments. J. Cell Biol. 2000;150:41–51. doi: 10.1083/jcb.150.1.41. [DOI] [PMC free article] [PubMed] [Google Scholar]
- Lever M.A., Th'ng J.P.H., Sun X., Hendzel M.J. Rapid exchange of histone H1.1 on chromatin in living human cells. Nature. 2000;408:873–876. doi: 10.1038/35048603. [DOI] [PubMed] [Google Scholar]
- Li W., Nagaraja S., Delcuve G.P., Hendzel M.J., Davie J.R. Effects of histone acetylation, ubiquitination and variants on nucleosome stability. Biochem. J. 1993;296:737–744. doi: 10.1042/bj2960737. [DOI] [PMC free article] [PubMed] [Google Scholar]
- Louters L., Chalkley R. Exchange of histones H1, H2A, and H2B in vivo. Biochemistry. 1985;4:3080–3085. doi: 10.1021/bi00334a002. [DOI] [PubMed] [Google Scholar]
- Luger K., Mäder A.W., Richmond R.K., Sargent D.F., Richmond T.J. Crystal structure of the nucleosome core particle at 2.8 Å resolution. Nature. 1997;389:251–260. doi: 10.1038/38444. [DOI] [PubMed] [Google Scholar]
- Manders E.M.M., Kimura H., Cook P.R. Direct imaging of DNA in living cells reveals the dynamics of chromosome formation. J. Cell Biol. 1999;144:813–821. doi: 10.1083/jcb.144.5.813. [DOI] [PMC free article] [PubMed] [Google Scholar]
- Misteli T. Protein dynamicsimplications for nuclear architecture and gene expression. Science. 2001;291:843–847. doi: 10.1126/science.291.5505.843. [DOI] [PubMed] [Google Scholar]
- Misteli T., Gunjan A., Hock R., Bustin M., Brown D.T. Dynamic binding of histone H1 to chromatin in living cells. Nature. 2000;408:877–881. doi: 10.1038/35048610. [DOI] [PubMed] [Google Scholar]
- Mizushima S., Nagata S. pEF-BOS, a powerful mammalian expression vector. Nucleic Acids Res. 1990;18:5322. doi: 10.1093/nar/18.17.5322. [DOI] [PMC free article] [PubMed] [Google Scholar]
- Nguyen V.T., Giannoni F., Dubois M.F., Seo S.J., Vigneron M., Kedinger C., Bensaude O. In vivo degradation of RNA polymerase II largest subunit triggered by alpha-amanitin. Nucl. Acids Res. 1996;24:2924–2929. doi: 10.1093/nar/24.15.2924. [DOI] [PMC free article] [PubMed] [Google Scholar]
- O'Keefe R.T., Henderson S.C., Spector D.L. Dynamic organization of DNA replication in mammalian cell nucleispatially and temporally defined replication of chromosome-specific alpha-satellite DNA sequences. J. Cell Biol. 1992;116:1095–1110. doi: 10.1083/jcb.116.5.1095. [DOI] [PMC free article] [PubMed] [Google Scholar]
- O'Neill L.P., Keohane A.M., Lavender J.S., McCabe V., Heard E., Avner P., Brockdorff N., Turner B.M. A developmental switch in H4 acetylation upstream of Xist plays a role in X chromosome inactivation. EMBO J. 1999;18:2897–2907. doi: 10.1093/emboj/18.10.2897. [DOI] [PMC free article] [PubMed] [Google Scholar]
- Orphanides G., Reinberg D. RNA polymerase II elongation through chromatin. Nature. 2000;407:471–475. doi: 10.1038/35035000. [DOI] [PubMed] [Google Scholar]
- Osley M.A. The regulation of histone synthesis in the cell cycle. Annu. Rev. Biochem. 1991;60:827–861. doi: 10.1146/annurev.bi.60.070191.004143. [DOI] [PubMed] [Google Scholar]
- Perche P.-Y., Vourc'h C., Konecny L., Souchier C., Robert-Nicoud M., Dimitrov S., Khochbin S. Higher concentrations of histone macroH2A in the Barr body are correlated with higher nucleosome density. Curr. Biol. 2000;10:1531–1534. doi: 10.1016/s0960-9822(00)00832-0. [DOI] [PubMed] [Google Scholar]
- Perry M., Chalkley R. Histone acetylation increases the solubility of chromatin and occurs sequentially over most of the chromatin. A novel model for the biological role of histone acetylation. J. Biol. Chem. 1982;257:7336–7347. [PubMed] [Google Scholar]
- Perry C.A., Dadd C.A., Allis C.D., Annunziato A.T. Analysis of nucleosome assembly and histone exchange using antibodies specific for acetylated H4. Biochemistry. 1993;32:13605–13614. doi: 10.1021/bi00212a028. [DOI] [PubMed] [Google Scholar]
- Peterson C.L., Workman J.L. Promoter targeting and chromatin remodeling by the SWI/SNF complex. Curr. Opin. Genet. Dev. 2000;10:187–192. doi: 10.1016/s0959-437x(00)00068-x. [DOI] [PubMed] [Google Scholar]
- Phair R.D., Misteli T. High mobility of proteins in the mammalian cell nucleus. Nature. 2000;404:604–609. doi: 10.1038/35007077. [DOI] [PubMed] [Google Scholar]
- Ridgway P., Almouzni G. CAF-1 and the inheritance of chromatin statesat the crossroads of DNA replication and repair. J. Cell Sci. 2000;133:2647–2658. doi: 10.1242/jcs.113.15.2647. [DOI] [PubMed] [Google Scholar]
- Sathyanarayana U.G., Freeman L.A., Lee M.-S., Garrard W.T. RNA polymerase-specific nucleosome disruption by transcription in vivo. J. Biol. Chem. 1999;274:16431–16436. doi: 10.1074/jbc.274.23.16431. [DOI] [PubMed] [Google Scholar]
- Schmidt-Zachmann M.S., Dargemont C., Kuhn L.C., Nigg E.A. Nuclear export of proteinsthe role of nuclear retention. Cell. 1993;74:493–504. doi: 10.1016/0092-8674(93)80051-f. [DOI] [PubMed] [Google Scholar]
- Sehgal P.B., Darnell J.E., Tamm I. The inhibition by DRB (5,6-dichloro-1-beta-D-ribofuranosylbenzimidazole) of hnRNA and mRNA production in HeLa cells. Cell. 1976;9:473–480. doi: 10.1016/0092-8674(76)90092-1. [DOI] [PubMed] [Google Scholar]
- Stemmer C., Briand J.-P., Muller S. Mapping of linear histone regions exposed at the surface of the nucleosome in solution. J. Mol. Biol. 1997;273:52–60. doi: 10.1006/jmbi.1997.1270. [DOI] [PubMed] [Google Scholar]
- Turner B.M. Histone acetylation and control of gene expression. J. Cell Sci. 1991;99:13–20. doi: 10.1242/jcs.99.1.13. [DOI] [PubMed] [Google Scholar]
- Turner B.M. Histone acetylation and epigenetic code. BioEssays. 2000;22:836–845. doi: 10.1002/1521-1878(200009)22:9<836::AID-BIES9>3.0.CO;2-X. [DOI] [PubMed] [Google Scholar]
- van-Holde K.E., Lohr D.E., Robert C. What happens to nucleosomes during transcription? J. Biol. Chem. 1992;267:2837–2840. [PubMed] [Google Scholar]
- Verreault A. De novo nucleosome assemblynew pieces in old puzzle. Genes Dev. 2000;14:1430–1438. [PubMed] [Google Scholar]
- Wang T.S. Eukaryotic DNA polymerases. Annu. Rev. Biochem. 1991;60:513–552. doi: 10.1146/annurev.bi.60.070191.002501. [DOI] [PubMed] [Google Scholar]
- White J., Stelzer E. Photobleaching GFP reveals protein dynamics inside live cells. Trends Cell Biol. 1999;9:61–65. doi: 10.1016/s0962-8924(98)01433-0. [DOI] [PubMed] [Google Scholar]
- Wolffe A.P., Hayes J.J. Chromatin disruption and modification. Nucl. Acids Res. 1999;27:711–720. doi: 10.1093/nar/27.3.711. [DOI] [PMC free article] [PubMed] [Google Scholar]
- Workman J.L., Kingston R.E. Alteration of nucleosome structure as a mechanism of transcriptional regulation. Ann. Rev. Biochem. 1998;67:545–579. doi: 10.1146/annurev.biochem.67.1.545. [DOI] [PubMed] [Google Scholar]
- Wyrick J.J., Hostege F.C.P., Jennings E.G., Causton H.C., Shore D., Grunstein M., Lander E.S., Young R.A. Chromosomal landscape of nucleosome-dependent gene expression and silencing in yeast. Nature. 1999;402:418–421. doi: 10.1038/46567. [DOI] [PubMed] [Google Scholar]