Abstract
We have examined the fate of Golgi membranes during mitotic inheritance in animal cells using four-dimensional fluorescence microscopy, serial section reconstruction of electron micrographs, and peroxidase cytochemistry to track the fate of a Golgi enzyme fused to horseradish peroxidase. All three approaches show that partitioning of Golgi membranes is mediated by Golgi clusters that persist throughout mitosis, together with shed vesicles that are often found associated with spindle microtubules. We have been unable to find evidence that Golgi membranes fuse during the later phases of mitosis with the endoplasmic reticulum (ER) as a strategy for Golgi partitioning (Zaal, K.J., C.L. Smith, R.S. Polishchuk, N. Altan, N.B. Cole, J. Ellenberg, K. Hirschberg, J.F. Presley, T.H. Roberts, E. Siggia, et al. 1999. Cell. 99:589–601) and suggest that these results, in part, are the consequence of slow or abortive folding of GFP–Golgi chimeras in the ER. Furthermore, we show that accurate partitioning is accomplished early in mitosis, by a process of cytoplasmic redistribution of Golgi fragments and vesicles yielding a balance of Golgi membranes on either side of the metaphase plate before cell division.
Keywords: Golgi apparatus; mitosis; endoplasmic reticulum; organelle inheritance; vesicle
Introduction
During each cell cycle, the Golgi apparatus and other membranous organelles must grow, divide, and be partitioned between the two daughter cells (Warren and Wickner, 1996). Little is known about growth and division of the Golgi complex beyond the occasional images suggesting lateral extension of Golgi stacks followed by medial fission (Troyer and Cameron, 1980). More is known about the partitioning process that ensures equal amounts of Golgi apparatus are inherited by each daughter cell (Cabrera-Poch et al., 1998; Shima and Warren, 1998).
Most partitioning studies have been carried out using animal cells that locate their Golgi apparatus near to the centrosomes and, often, the nucleus. Typically, several hundred Golgi stacks are stitched together into a ribbon-like structure so that there is often only one or, at most, a few copies of the organelle in the cell (Farquhar and Palade, 1981; Lucocq and Warren, 1987; Rambourg et al., 1987).
At the onset of mitosis, this ribbon breaks down, yielding multiple dispersed Golgi stacks, the cisternae of which become more tubulated (Warren, 1993). This breakdown of the Golgi ribbon is thought by some (Colanzi et al., 2000; Kano et al., 2000), but not all workers (Draviam et al., 2001), to be mediated by a mitotic form of the MAP kinase, MEK1, one target of which is the Golgi stacking protein, GRASP55 (Shorter et al., 1999; Jesch et al., 2001). Ribbon fragmentation is followed by extensive vesiculation converting each Golgi stack into clusters of Golgi vesicles and tubules. This process is mediated, at least in part, by the mitotic kinase, cdc2, most likely in association with cyclin B (Lowe et al., 1998b). Downstream targets include GM130, a vesicle tethering protein (Lowe et al., 2000), and GRASP proteins that have been implicated in cisternal stacking (Barr et al., 1997; Shorter et al., 1999). Phosphorylation is thought to disrupt tethering and stacking so that continued budding of COPI vesicles in the absence of fusion largely converts Golgi stacks into clusters of vesicles (Lowe et al., 1998a). The rest is converted into tubules by a COPI-independent pathway (Misteli and Warren, 1995).
What happens next is the subject of current debate. We have argued that mitotic Golgi clusters persist throughout mitosis, until midtelophase when they nucleate the reformation of Golgi stacks (Souter et al., 1993). Clusters may become smaller through the shedding of vesicles into the surrounding cytoplasm, but this process does not go to completion. Since clusters are organized by the spindle, their numbers are fixed for a particular cell type and size, and they seed Golgi regrowth, we have argued that they are the partitioning units of the Golgi apparatus (Shima et al., 1997, 1998).
An alternative view has recently been put forward by Lippincott-Schwartz and colleagues based on the hypothesis that the Golgi apparatus is in dynamic equilibrium with the ER (Storrie et al., 1998; Zaal et al., 1999; Glick, 2000). During interphase, they have argued that perturbations in this equilibrium are responsible for moving the Golgi complex, via the ER, to the peripheral cytoplasm (Cole et al., 1996). During mitosis, they suggest that these perturbations partition the Golgi membranes by fusing it with the ER. They present evidence showing that almost all the mitotic Golgi fragments fuse with the ER during prometaphase/metaphase and reemerge during telophase to rebuild the Golgi apparatus (Zaal et al., 1999). In this view, the partitioning of the Golgi apparatus is subordinated to the partitioning of the ER.
The presence of Golgi enzymes in the ER during mitosis has long been the subject of conflicting reports. Immunogold labeling has been used to localize several Golgi enzymes to mitotic clusters and also free vesicles, but not to the ER (Lucocq et al., 1987, 1989; Pypaert et al., 1993). Immunocytochemical studies, however, have localized at least a portion of one of these enzymes (β1,4-galactosyltransferase [GalT]*), as well as another (mannosidase II), to the ER during mitosis (Thyberg and Moskalewski, 1992; Zaal et al., 1999). Biochemical studies support the idea that the Golgi apparatus and the ER remain separate during mitosis. Fractionation of mitotic cells shows that Golgi and ER membranes can be almost completely separated from each other (Jesch and Linstedt, 1998). Pulse–chase experiments suggest that Golgi-specific oligosaccharide modifications to ER-located proteins in mitotic cells are the consequence of newly synthesized enzymes rather than fusion of Golgi membranes with the ER (Farmaki et al., 1999).
Fluorescence microscopy techniques have provided perhaps the biggest discrepancies. Mitotic Golgi clusters are seen in many but not all cells, though the latter has previously been attributed to vesicle shedding rather than fusion with the ER (Jesch and Linstedt, 1998; Lowe et al., 2000). This is supported by the fact that the staining patterns for Golgi and ER markers are very different, irrespective of the number and intensity of observable Golgi clusters (Jesch and Linstedt, 1998). To date, the only Golgi enzymes that have been reliably observed in the ER by fluorescence techniques are those that have been modified using GFP tags (Zaal et al., 1999; Kano et al., 2000; Terasaki, 2000).
Since the status of Golgi identity rests on whether the cluster or the ER is the partitioning unit during mitosis, we have exploited recent technological advances and reagents to localize Golgi resident proteins with high resolution in living and fixed mitotic cells. Given the limitations inherent in many of the microscopical procedures used to date, we have carried out a multidisciplinary approach using time-lapse fluorescence microscopy, EM reconstruction of mitotic cells from serial thin sections, and sensitive cytochemical staining using an HRP–Golgi resident chimera. We have been unable to find any evidence for Golgi residents in the ER during mitosis, suggesting that the Golgi apparatus itself is responsible for its own partitioning.
Results
Distinction between Golgi apparatus and ER in mitotic normal rat kidney (NRK) cells
Our earlier studies using a GFP-tagged Golgi resident showed that clusters could be visualized at all stages of mitosis. At no stage were they observed to disappear. These experiments were carried out using a HeLa cell line stably transfected with GFP attached to the Golgi retention signal of N-acetylglucosaminyltransferase I (yielding NAGFP). Clusters were also seen to persist using antibodies to endogenous Golgi enzymes as well as structural proteins such as GM130 and Giantin. Several other cell lines, including keratinocytes, PtK-1 cells, L929 fibroblasts, and normal rat kidney (NRK) cells were also tested with the same results (Shima et al., 1997, 1998; Cabrera-Poch et al., 1998).
As a starting point for the present studies on the fate of Golgi residents in mitosis, we reexamined the distribution of mitotic Golgi and ER residents, focusing on the latter half of mitosis, a period during which it has been reported that Golgi residents could not be distinguished from ER residents using widefield and confocal fluorescence microscopy (Zaal et al., 1999). In NRK cells, which maintain a flattened optically favorable morphology during mitosis, antibodies directed against the Golgi protein GM130 (Fig. 1) , as well as resident enzymes and transmembrane structural proteins (GalT and giantin, respectively; data not shown) gave distinct confocal patterns that were readily distinguished from the staining pattern of the ER resident, Bap31. Mitotic Golgi residents appeared as larger fragments in prometaphase cells, in agreement with previous reports from our group and others (Shima et al., 1998; Zaal et al., 1999). In later staged mitotic cells, Golgi residents were still present in punctate structures, the mitotic clusters, but during this period there was an increase in cytoplasmic staining consistent with the shedding of Golgi vesicles (see below). The ER resident protein (Fig. 1), in contrast, was present in reticular membranes throughout mitosis, though the continuity and cellular distribution of the membranes was altered from the normal interphase ER morphology. Comparison of the Golgi and ER patterns in merged images confirmed their distinctive nature throughout these periods of mitosis, with many of the mitotic Golgi fragments being present in cytoplasmic spaces between reticular ER (Fig. 1, inset). These light microscopic findings are consistent with ultrastructural observations suggesting close proximity of mitotic Golgi membranes with elements of the transitional ER (Lucocq et al., 1989).
Figure 1.
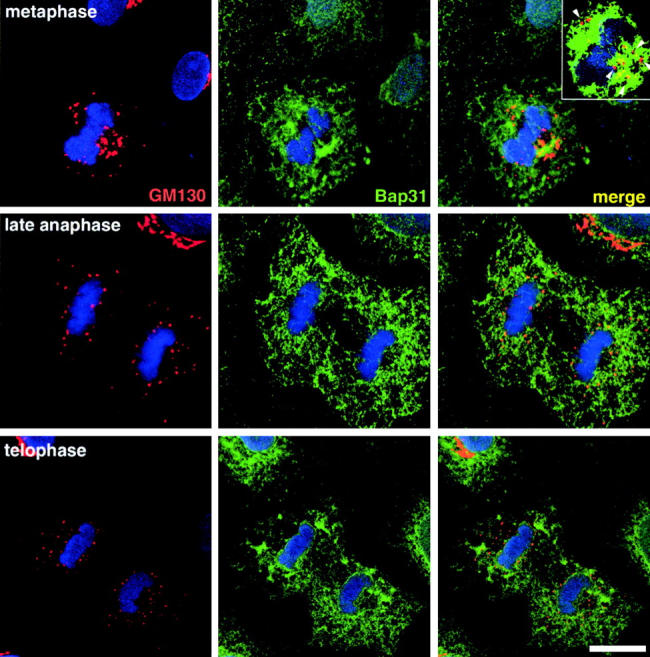
Resident proteins of the ER and Golgi apparatus remain distinct during mitosis. NRK cells were fixed and double labeled with antibodies to the Golgi resident, GM130 (red), and the ER resident, BAP31 (green). TOPRO-3 was used as a fluorescent stain for DNA (blue). Shown are 2D projections of four confocal sections taken from the central region of metaphase, late anaphase, and early telophase cells. Single fluorescence label images (left, Golgi; middle, ER) are shown alongside a merged image in the far right. The inset in the upper right represents a single optical section and demonstrates the presence of mitotic Golgi fragments in cytoplasmic spaces free of ER (arrowheads). Bar, 5 μm.
Mitotic Golgi clusters in the GalT-GFP-CHO cell line
We next applied our experimental procedures to the cell line published and provided by Zaal and colleagues (1999). This CHO cell line is stably transfected with a triple GFP concatamer attached to the retention signal of GalT. We found that interphase cells had similar characteristics to those reported. Substantial amounts of fluorescent GFP–GalT were present in the ER in addition to the Golgi region (Fig. 2 d).
Figure 2.
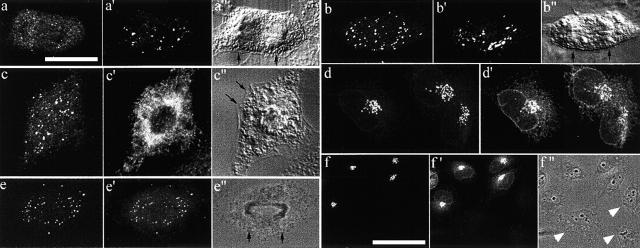
Clusters in mitotic CHO cells expressing GalT-GFP. Cells expressing fluorescent GalT–GFP (a–f) were fixed and labeled with antibodies to GM130 (a′ and b′), BAP31 (c′, an ER marker), or GFP (d′–f′). The DIC (a″–c″) or phase (e″ and f″) images of the anaphase (a″–c″ and e”) and interphase cells (f″) are also shown, and segregating chromosomes are indicated by black arrows. (a and b) Illustrate the two types of endogenous GFP fluorescence seen in these anaphase cells. (a) shows a few clusters but mostly haze, whereas b shows many clusters. GM130-staining clusters were clearly present in both (a′ and b′). The fine punctate structures contributing to the haze were clearly distinguishable from ER markers (compare c with c′). (d–f) Show that there was much more unfolded GFP protein in the ER/intermediate compartment than fluorescent GFP. (f) Shows a control demonstrating that GFP antisera only immunolabels the ER and Golgi apparatus in cells expressing the GFP chimera. Nonexpressing cells are designated by white arrowheads (f″). Bars: (a–f) 5 μm; (e) 8 μm.
Mitotic cells yielded different results in our hands. Multiple GM130-positive mitotic clusters of varying size were present in these cells throughout mitosis, including anaphase, at which point it has been argued that mitotic Golgi clusters have disappeared via fusion with the ER (Zaal et al., 1999) (Fig. 2, a′ and b′; and data not shown). These clusters colocalized with GFP–GalT in about half the mitotic cells examined (Fig. 2, compare b with b′). In the other half of cells, GM130-positive clusters were visible, but GFP–GalT appeared as a fluorescent haze (Fig. 2, compare a with a′), previously interpreted as localization in the ER (Zaal et al., 1999). This haze was present to varying degrees in mitotic cells, but interestingly, did not appear to resemble the staining of the ER as revealed by the ER marker, Bap31 (Fig. 2, compare c with c′).
We also carried out experiments using other endogenous Golgi markers, confirming their presence in punctate mitotic clusters and smaller finer structures, but could find no light microscopic evidence that they were present in the ER during mitosis or interphase. We then wondered whether the presence of the GFP tag on GalT was somehow responsible for the accumulation of this fusion protein in the ER since GFP is known to fold slowly in mammalian cells (Heim and Tsien, 1996; Wacker et al., 1997; Sacchetti and Alberti, 1999). This would generate two pools of GFP, a properly folded fluorescent pool, and an unfolded nonfluorescent pool that could only be detected using antibodies. We had addressed this issue for our own NAGFP cell lines by labeling with antibodies to GFP and showing that the localization of the protein was the same as that for GFP fluorescence (Shima et al., 1997).
We therefore stained the CHO cell line expressing GalT–GFP with polyclonal antisera raised against GFP. As shown in Fig. 2 d′, in the majority of cells, most of the GFP protein was not in the Golgi complex; but rather, the ER. Approximation by image analysis suggested that ≥80% of the total cellular GFP (the sum of the fluorescent and nonfluorescent protein detected with the GFP antisera) was in the ER in contrast to 30% of the fluorescent GFP pool previously reported (Zaal et al., 1999). This ER pool of unfolded protein revealed by anti-GFP immunostaining was only seen in cells expressing GalT–GFP (Fig. 2, compare f′ with 2f″) and was also readily visible in mitotic cells (Fig. 2 e′). These results suggest that most of the GFP chimera resides in the ER, presumably with the GFP in a state of folding, which might help explain some of the discrepancies in published work (see Discussion).
Time-lapse imaging of the Golgi apparatus during mitosis in NAGFP-PtK cells
To obtain a continuous high resolution view of Golgi partitioning, we turned to time-lapse three-dimensional (3D) fluorescence confocal microscopy. The two major aims of this study were to obtain high resolution optical sections spanning the entire depth of living cells to ensure maximum visualization of Golgi membranes, and to acquire these Z-stacks at frequent (≤1-min) intervals.
We chose to use a PtK-1 cell line stably transfected with NAGFP (Shima et al., 1998). PtK-1 cells have often been chosen for mitosis studies since they remain very flat during cell division, so a comprehensive series of confocal sections through the entire cell depth can be obtained relatively rapidly. This minimizes the exposure of highly sensitive mitotic cells to harmful laser excitation (Rieder and Cole, 1998). A Z-stack of fluorescence and phase contrast images was acquired every 40 s to 1 min using high resolution optics, and with pixel sizes in the range of 60–70 nm in the x–y dimension. Acquisition required 30–50 s for each cell at each time point. Each stack of images was conflated yielding a two-dimensional (2D) projection of 9–13 images through the cell depth, acquired at 0.5-μm Z-step intervals. Asynchronous populations of cells were scanned for mitotic figures by phase contrast microscopy, and no drug regimens were used to increase mitotic numbers or GFP expression.
Ordered Golgi fragment partitioning occurs during prometaphase
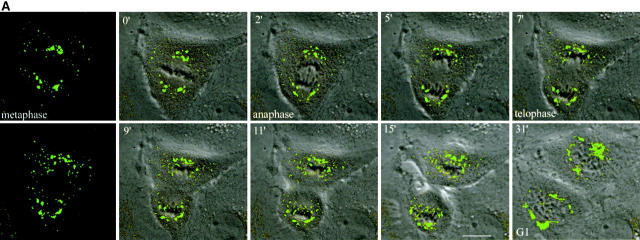
The fragmentation of the Golgi apparatus during the early phases of mitosis is shown in Fig. 3 and the accompanying animation in supplemental Videos 1–3 (available at http://www.jcb.org/cgi/content/full/200104073/DC1). Fig. 3 A shows an interphase cell on the right with a characteristic Golgi ribbon and a cell on the left that has just entered prophase. The Golgi apparatus undergoes rapid and extensive fragmentation, the Golgi membranes associating with the forming spindle poles. By metaphase, two sets of Golgi clusters could be readily visualized, one at each pole. An example of the Golgi membrane distribution is seen at the bottom of Fig. 3 A where a single phase image of the metaphase cell has been superimposed on the fluorescence image.
Figure 3.

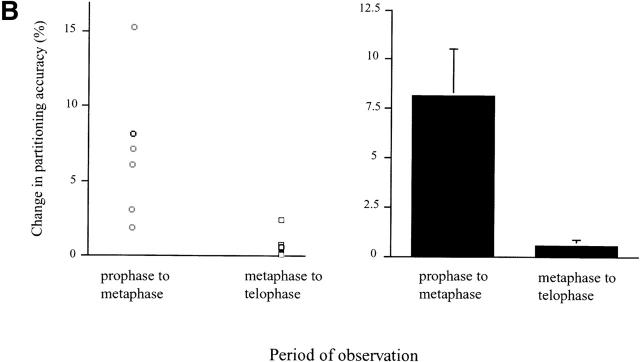
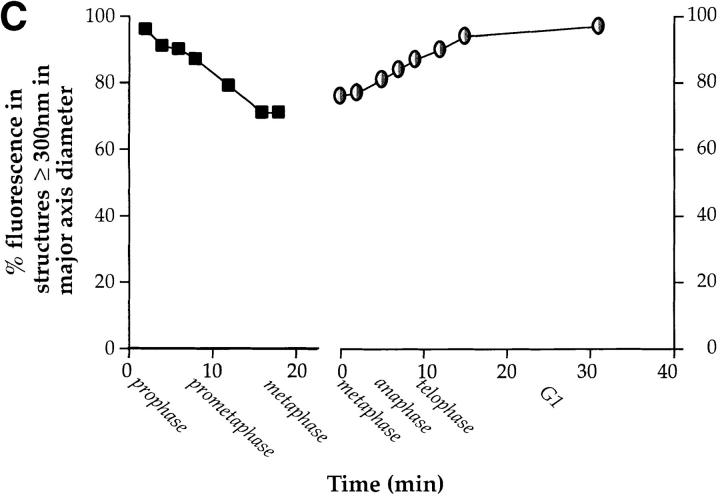
Video microscopy of partitioning Golgi clusters during early mitosis in NAGFP-PtK cells. (A) NAGFP-PtK cells were imaged by serial confocal microscopy at intervals of 30–50 s/Z-stack, and still images from the time-lapse experiments, at the indicated times (′, minutes; ″, seconds) and/or phase of mitosis, are presented together with phase (top and bottom) images. The distribution of Golgi fluorescence on either side of the presumptive midline is shown as a ratio above the cell (0′). The NAGFP in the right hand cell is present in a juxtanuclear reticulum characteristic of the Golgi apparatus in interphase cells with little if any present in the ER. The left-hand cell has entered prophase, and the Golgi apparatus is breaking down into small fragments that become distributed around the disassembling nuclear envelope (3′). As the mitotic spindle is being assembled (6′), more clusters appear to associate with the right-hand spindle pole and this imbalance appears to be corrected by shuttling of clusters (red arrowhead) and smaller Golgi membranes (white arrow) to the left-hand pole (11′15″ to 16′). Bar, 10 μm. Animations (Videos 1–3) are available at http://www.jcb.org/cgi/content/full/200104073/DC1. (B) The bulk of Golgi membrane partitioning occurs during the prophase-to-metaphase period. Individual cells were followed during mitosis, and the amount of membrane on each side of the metaphase plate (or on either side of a line drawn half-way between the spindle poles) was measured using GFP fluorescence (see Materials and methods). The results are presented as the change in partitioning accuracy during the prophase-to-metaphase period and the metaphase-to-telophase period. The values for individual cells are shown on the left; and the mean values for all cells (± SEM, n = 7), on the right. (C) For the cells shown in Figs. 3 A and 4 A, fluorescence intensity was measured as a function of fragment size. The data are displayed graphically as the percentage of cellular fluorescence in structures ≥300 nm in major axis diameter throughout mitosis. A diameter of 300 nm was estimated to be the working limit of x–y resolution under the experimental conditions used for live cell experiments. The results from Fig. 3 A are shown on the left; and from Fig. 4 A, on the right.
During the mitotic disassembly period, Golgi fragments relocalized to give the appearance of a more equal distribution across the metaphase plate (Fig. 3 A, changing distributions indicated above the dividing cell), suggesting that accurate partitioning may be achieved early during mitosis. In support of this possibility, seven individual cells were followed, and the amount of fluorescent Golgi material on either side of the metaphase plate (or the line drawn half-way between the two spindle poles) was quantitated. The partitioning accuracy was then calculated for prophase, metaphase, and telophase, and the change in accuracy was plotted for prophase to metaphase and metaphase to telophase. As shown in Fig. 3 B, changes in the partitioning accuracy of Golgi clusters in these cells occurred primarily during the early phases of mitosis. The extent of change varied greatly from cell to cell. In contrast, little change in the partitioning accuracy occurred from metaphase to telophase. The difference in the means between the early and late phases was significant (P = 0.0023, using the two-tailed Mann Whitney test). Together, these data argue for a partitioning mechanism that operates during prometaphase in animal cells.
Though it was possible to follow the relocalization of larger Golgi membranes by eye, much of the fluorescence that redistributed during prometaphase was in faint fluorescent structures whose small size (and weak fluorescent intensity) prohibited accurate mapping of trajectories as a function of time. To estimate this pool, the fluorescence intensity of Golgi fragments whose trajectories could be followed (i.e., those that were consistently visible over time, for example, those fragments indicated by an arrow and an arrowhead in Fig. 3 A) were summed and found to account for only 40–50% of the Golgi membrane that was eventually redistributed based on quantitative assessment of total cellular fluorescence by image analysis. These findings were corroborated using algorithms to identify fluorescent fragments ≥300 nm in major axis diameter. As shown in Fig. 3 C, these fragments accounted for >95% of the fluorescence in the prophase cell, falling to ∼70% by metaphase. These numbers are higher than those observed by eye because they do not incorporate the added constraint that each fragment can be followed from one time point to the next. Below we present evidence suggesting that the fluorescence in the smaller structures is in Golgi-derived vesicles.
Clusters persist from metaphase to early telophase in NAGFP-PtK cells
Since clusters have been reported to disappear during metaphase to telophase (Zaal et al., 1999), we paid particular attention to these stages of the mitotic cycle. As shown in Fig. 4 A and the accompanying animation (Video 4), clusters are aligned on either side of the metaphase plate, and as reported previously, these metaphase clusters closely associate with the spindle poles and astral microtubules just before anaphase (Shima et al., 1998). In contrast to the prometaphase period, the fluorescent Golgi fragments exhibit little motility relative to one another, but rather move apart as a whole when the chromosomes separate during anaphase and telophase, as previously suggested during late mitosis in HeLa cells (Shima et al., 1997). This finding is consistent with the earlier finding that little effective partitioning is occurring during this period (Fig. 3 B). At no stage did we observe disappearance of the clusters. In the example shown (Fig. 3 C), ∼ 75% of total fluorescent structures are ≥300 nm in long axis diameter from metaphase through anaphase. The ∼25% of structures below 300 nm diameter likely represent the material contributing to the fluorescent haze previously described by us and others and likely represents shed vesicles (see below). As the cell divides, fluorescent Golgi fragments increase in size until >95% of fluorescence is in structures ≥300 nm diameter, and these fragments go on to congregate, fuse, and reform the juxtanuclear ribbon as the cell enters G1.
Figure 4.
Video microscopy of Golgi clusters from metaphase through to G1 in NAGFP-PtK cells. NAGFP-PtK cells were imaged by serial section confocal microscopy as described in the legend to Fig 3. Time is shown in minutes (′). (A) Mitotic Golgi clusters persist throughout the metaphase-to-G1 period. 2D projections from this time-lapse 3D experiment are shown as overlays on a single phase image through the mid–Z-stack region. Fluorescence images without phase overlays are also shown for 0′ and 7′ time points to permit visualization of the unresolved cytoplasmic haze that accompanies the larger mitotic fragments, which accounts for a larger proportion of the total fluorescence in metaphase (0′; 22%) than in telophase (7′; 11%). (B) NAGFP-PtK cells were microinjected with rhodaminated tubulin before mitosis, so as to permit visualization of both Golgi clusters and the mitotic spindle. Clusters are preferentially organized around the pole regions of the dividing cell. Animations (Videos 4 an 5) are available at http://www.jcb.org/cgi/content/full/200104073/DC1. Bar, 10 μm.
Fig. 4 B and the accompanying animation (Video 5) show a similar example, but in this case, rhodamine–tubulin was injected so as to visualize the poles and spindle microtubules during spindle elongation. Using this technique, aster microtubules are poorly labeled. Again, the Golgi clusters were seen to associate with the separating poles and to persist throughout this latter part of the mitotic cycle.
3D reconstruction of Golgi clusters in mitotic PtK cells
Electron microscopy provided independent confirmation of the results obtained using fluorescence microscopy. In earlier studies, we used immunogold labeling to identify the products of Golgi fragmentation in mitotic cells (Lucocq et al., 1987). These studies provided solid criteria for the identification of Golgi clusters in epon sections (Lucocq et al., 1989). These criteria have now been applied to serial sections taken through mitotic PtK-1 cells that have permitted 3D reconstruction of these cells at different phases of mitosis. Reconstruction provides a comprehensive view of a single cell that combines the overview of light microscopy with the resolution of EM.
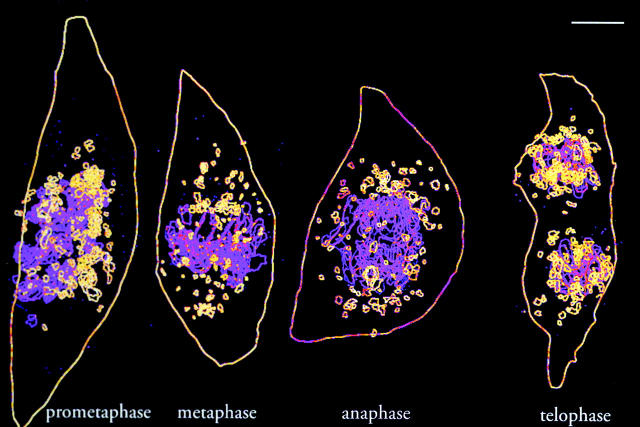
PtK-1 cells were seeded at low density to provide small well-separated colonies. Those containing a suitable mitotic cell were selected by phase contrast microscopy, fixed, and processed for epon embedding. Serial thin sections were cut parallel to the coverslip and sections at approximately equal intervals were photographed. Chromosomes and clusters were identified and traced on overlays that were then assembled using NIH Image. Supplemental data illustrate some of the structures chosen to assemble the final images (Supplemental Fig. S1) and an animation (Video 6) is included that permits rotation of the assembled images for easier appreciation of the individual structures. A 2D image is presented in Fig. 5 .
Figure 5.
3D reconstruction of Golgi clusters in NAGFP-PtK cells at different stages of mitosis. Four mitotic cells were sectioned completely and a series of approximately evenly spaced sections (total in parentheses) chosen to assemble a complete cell: prometaphase (20 sections); metaphase (11); anaphase (10); and telophase (18). Chromosomes (lilac) and Golgi clusters (yellow) were identified morphologically and traced, and the traces were assembled into a 3D stack. Shown is a 2D projection of the reconstructed images. An animated sequence (Video 6) is available at http://www.jcb.org/cgi/content/full/200104073/DC1, allowing the images to be rotated. Note that mitotic Golgi clusters persist throughout mitosis and are organized in the perispindle region of PtK1 cells during the metaphase to telophase period. Bar, 5 μm.
Multiple large clusters were present during prometaphase, were increased in number in metaphase, and during the period of metaphase to telophase, these were preferentially localized near the spindle poles, as suggested from the live cell analysis above (Figs. 3 and 4). The average area of these cluster profiles decreased somewhat from prometaphase (0.36 ± 0.027 μm2, n = 155; n refers to the total number of cluster profiles examined) to metaphase (0.11 ± 0.015 μm2, n = 102) and then increased during anaphase (0.22 ± 0.025 μm2, n = 125) and telophase (0.21 ± 0.014 μm2, n = 184). Golgi clusters did not disappear at any phase. These results are in line with those obtained by fluorescence microscopy (Fig. 3 C), suggesting a reduction in size during the transition from prometaphase to metaphase, consistent with continued division of clusters and shedding of vesicles from these clusters.
Vesicles shed by mitotic Golgi clusters do not fuse with the ER
The variable shedding of vesicles from the tubulovesicular clusters would certainly help explain some of the published discrepancies using fluorescence microscopy. Significant shedding would increase the pool of fluorescent structures in mitotic cells that are below the diffraction-limited spatial resolution of the light microscope (mitotic vesicles are ∼ 60 nm in diameter; Lucocq et al., 1987), creating an ill-defined haze that would also obscure the visualization of bona fide mitotic clusters. In our best efforts to image cells in fluorescence experiments reported above, we still find that ∼20–30% of the detectable fluorescence is in structures below the practical limit of resolution (∼300 nm in long-axis diameter). Shedding could also be confused with fusion of the Golgi apparatus with the ER. It therefore became essential to account for the potential products of mitotic fragmentation, including structures as small as shed vesicles.
To do this, we used a highly sensitive cytochemical technique in combination with the resolving power of TEM. Connolly et al. (1994) and Stinchcombe et al. (1995) reported the use of a chimeric construct comprising HRP coupled to the trans-Golgi enzyme, α2,6-sialyltransferase (SialylT), SialylT–HRP), which localizes to the trans-cisternae and the TGN. They showed that one molecule of this chimeric protein in a vesicle could be detected using DAB/peroxidase cytochemistry; thus, the method is suitably sensitive. A second advantage of SialylT-HRP is that it is a resident of the trans-Golgi, so we can directly compare our analysis of this resident with the published results obtained using the trans-Golgi resident GalT-GFP (Zaal et al., 1999). We also decided to confirm our findings in a different cell line from PtK-1, and chose to generate an NRK cell line stably expressing SialylT-HRP. Zaal and colleagues (1999) have previously documented the disappearance of the Golgi complex by fusion with the ER during mitosis in this cell line.
As shown in Fig. 6 A, the SialylT-HRP construct was located exclusively in the trans-Golgi and the TGN during interphase. None was detected in cis or medial cisternae or in any of the elements of the ER, including the nuclear envelope. Treatment with brefeldin A for 30 min led to intense staining of elements of the ER (Fig. 6 B) and nuclear envelope (data not shown), showing that when the construct is present in the ER, it can be readily detected.
Figure 6.
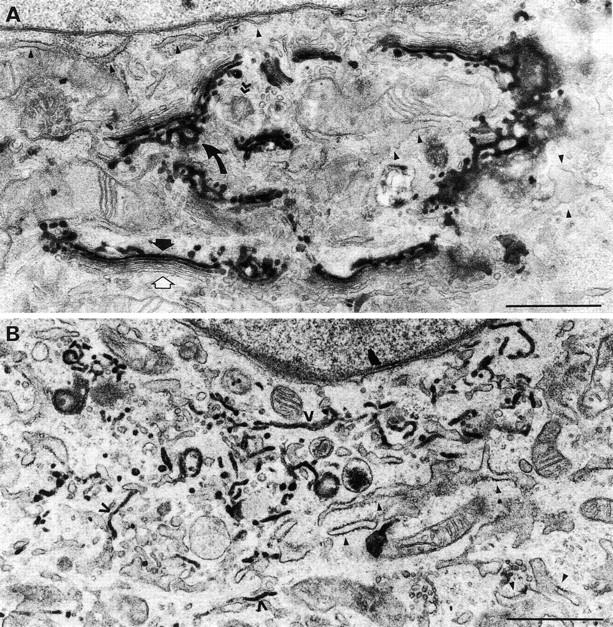
Characterization of the SialylT-HRP-NRK cell line. Cells were fixed before (A) or after (B) treatment with 5 μg/ml brefeldin A for 30 min and then processed using the peroxidase reaction. (A) Untreated cells. Note that the stain was only present in the trans-cisternae (black arrow) and TGN (curved arrow). None was detected in the ER (black arrowheads) or cis- and medial-cisternae (white arrow). Note that the ribbon is adjacent to the centrioles (> >). (B) Brefeldin A–treated cells. The stain was found in most (open arrowheads) though not all (closed arrowheads) elements of the ER. Bars, 1 μm.
Fig. 7 shows a series of low power images of stained cells at different phases of mitosis. Golgi clusters were stained at all stages, and clusters were observed to be larger during late prophase (Fig. 7 A) than during later stages (Fig. 7, B and C). Not all the membranes of the cluster were stained, consistent with the presence of Golgi membranes from cis and medial parts of the stack in each cluster (Shima et al., 1997). Those membranes that were stained comprised tubules as well as large and small vesicles. Interestingly, stained vesicles of the same size as the small cluster vesicles were frequently observed scattered throughout the cytoplasm, mostly in the spindle region of late prophase and metaphase cells (Fig. 7, A and B). In the enlargement shown in the metaphase cell in Fig. 7 B, many of these small vesicles appeared to be associated with spindle microtubules. To determine whether these small vesicles were derived by shedding from mitotic clusters, we focused on their fate during mitosis. Quantitation of images showed that 69.0% ± 2.7% of small stained vesicles were in clusters in prophase, whereas in metaphase and anaphase, the numbers were 34.7 ± 3.8% and 34.7 ± 3.2%, respectively. These data strongly suggest that vesicles are shed as cells progress from prophase to metaphase, consistent with the 3D EM reconstruction data and the fragmentation and shuttling of membranes documented in living cells by video fluorescence microscopy. Note, however, that these numbers are indicative of vesicle redistribution, or shedding, but cannot be compared directly with the extent of formation of small vesicular membranes inferred from fluorescence image analysis. The EM experiments focused only on the fate of the small stained vesicles, both free in the cytoplasm and in the cluster, but most of the staining was found in tubules and larger vesicles, mostly associated with the mitotic cluster.
Figure 7.
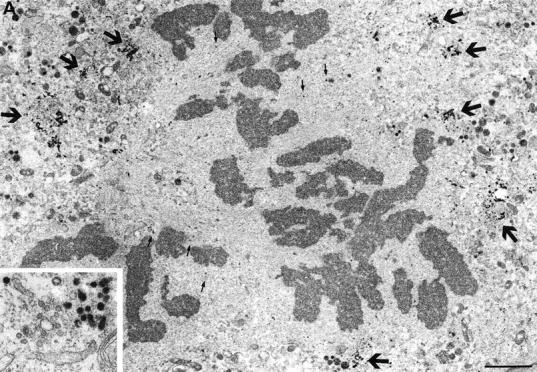
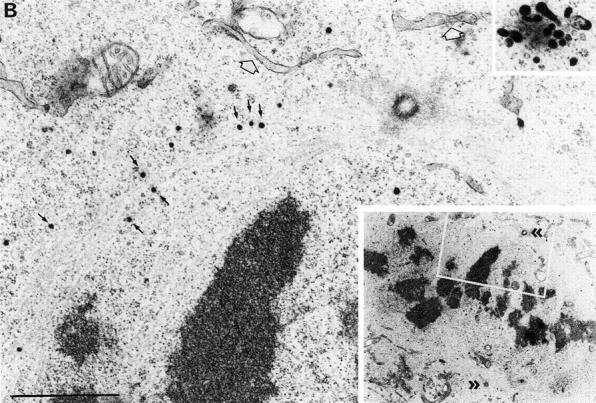
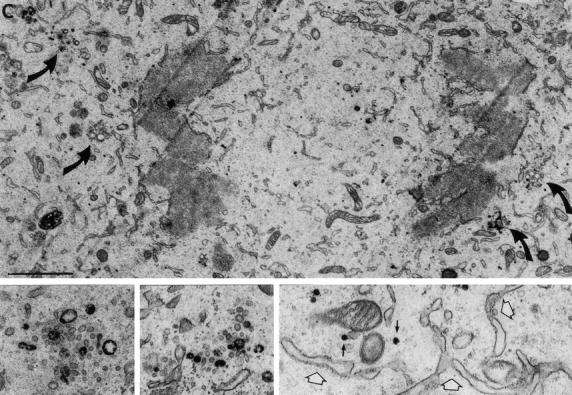
Identification of mitotic Golgi fragments using peroxidase cytochemistry of SialylT-HRP-NRK cells. Mitotic cells were selected by light microscopy, fixed, and processed using the peroxidase reaction. (A) Low power image of a late prophase cell showing large stained Golgi clusters (large arrows and inset) and free stained vesicles (particularly visible in the spindle zone, small arrows). (B) Low power image (bottom right inset) of a metaphase cell showing the spindle poles (> >). The white boxed region is enlarged in the main figure and shows many stained vesicles, some of which (arrows) appear to be associated with spindle microtubules. The ER (white arrow) is not stained. Upper right inset shows a stained Golgi cluster from this section. (C) Low power image of a late anaphase cell showing stained Golgi clusters (large curved arrows, also magnified in the left and middle insets). The bottom right region is magnified and rotated 90° clockwise in the bottom right and shows free vesicles (black arrows) and unstained ER (white arrows). Bars: (A and C) 2 μm; (B) 1 μm.
Most importantly, we could find no evidence for staining of the ER at any stage. The ER present in metaphase cells (Fig. 7 B) and shown enlarged in a late anaphase cell (Fig. 7 C, bottom) was unstained, in contrast to adjacent clusters and free vesicles. For this analysis, cells were systematically sectioned through their depth and all sections examined. Hundreds of sections have been viewed covering more than 20,000 μm2 of cell section area without identifying stained elements of the ER.
These conclusions were corroborated using NRK cells that had been transiently transfected with an HRP construct tagged with the ER salvage signal, KDEL (Fig. 8) (Munro and Pelham, 1987; Connolly et al., 1994). In interphase cells the staining was restricted to the ER, intermediates on the ER to Golgi pathway (ERGIC) and, to a limited extent, cis-Golgi elements, especially when the expression level was high. During mitosis, the ER underwent fragmentation and vesiculation, but at all stages of mitosis, the pattern was very different from that observed using the SialylT-HRP construct (compare Figs. 7 and 8). Golgi clusters were readily visible and unstained, as were those vesicles found in association with the mitotic spindle microtubules, emphasizing the likelihood that these vesicles were Golgi- not ER-derived and likely involved in the equilibration process leading to accurate Golgi partitioning.
Figure 8.
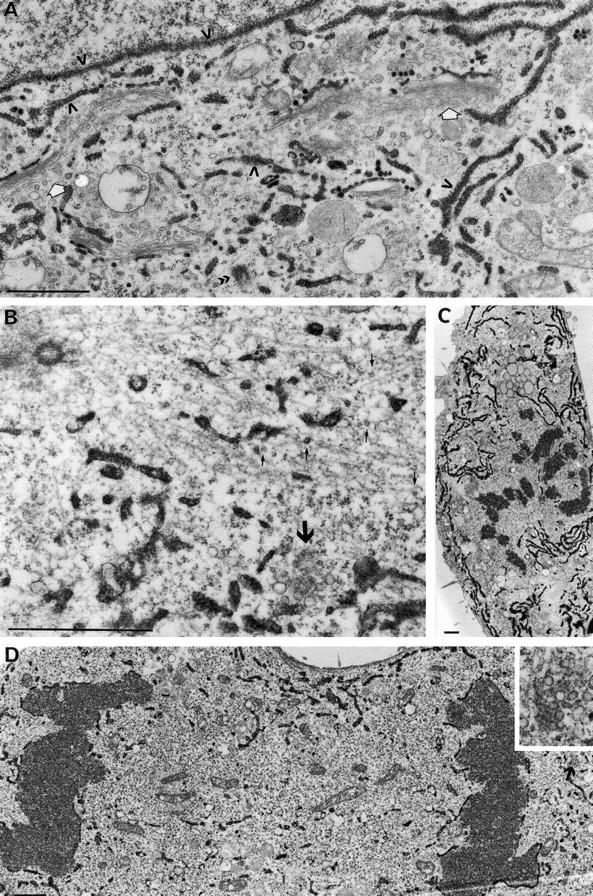
Labeling of ER fragments using peroxidase cytochemistry of HRP-KDEL in NRK cells. (A) An interphase cell showing that HRP-KDEL is restricted to the ER and nuclear envelope (open arrows). The Golgi apparatus is not stained (white arrows). Metaphase cells at high (B) and low (C) magnification show extensive staining of ER fragments but no staining of Golgi clusters (large arrow in B) or vesicles (small arrows in B), some of which appear to be associated with spindle microtubules (note the centrioles upper left). The low magnification view of an anaphase cell (D) also shows extensive staining of ER fragments but no staining of Golgi clusters (arrow, far right and inset). Bars, 1 μm.
Discussion
The idea of Golgi partitioning using the ER has its origins in the earliest experiments using brefeldin A (Lippincott-Schwartz et al., 1989). This fungal metabolite highlighted a retrograde pathway from the Golgi apparatus to the ER that was corroborated by experiments in which exit from the ER was blocked using a dominant-negative form of Sar1p, the GTPase involved in assembling COPII-coated vesicles (Storrie et al., 1998). Golgi enzymes accumulated in the ER when exit was blocked because they were no longer able to recycle. Exit from the ER is also blocked during mitosis (Featherstone et al., 1985), raising the possibility that Golgi residents might then accumulate in the ER. The rate of retrograde transport would need to be increased ∼10–20-fold to satisfy the available time window but such an inhibition of the Golgi resident cycle could explain, mechanistically, partitioning using the ER.
Partitioning of the Golgi apparatus by itself was originally explained as an inhibition of transport within the Golgi stack (Warren, 1985). Continued budding of transport vesicles, in the absence of fusion, would convert cisternae into small vesicles. These were originally thought to diffuse throughout the mitotic cell cytoplasm, effecting partitioning by stochastic means. Later experiments, however, using better live and fixed cell fluorescence methods, showed that clusters of vesicles persisted, and that partitioning was ordered and not stochastic (Shima et al., 1998).
The key difference between these two proposed partitioning mechanisms lies in the location of Golgi residents. If the Golgi apparatus uses the ER for partitioning, then Golgi residents must be present in the ER during at least some stages of mitosis. If the Golgi apparatus partitions itself, then residents should be present in Golgi clusters and/or vesicles, but not the ER. Given the conflicting data in the published literature, we decided to reexamine the fate of Golgi residents during mitosis using more sensitive high-resolution microscopic techniques, both fluorescence and EM.
Our fluorescence approach was to generate a stable cell line expressing a Golgi-localized GFP and to follow the entire cell at frequent intervals, making it less likely that we would miss any period during which the Golgi clusters might disappear.
The results presented here and in the supplemental animations show clearly that Golgi clusters persist throughout mitosis. Zaal and colleagues (1999) reported a critical time window, between metaphase and early telophase, when >98% of the Golgi clusters disappeared; but, despite the fact that Golgi residents appear to reside in a large number of small tubules and vesicles in late mitosis, we have been unable to find any evidence for such a disappearance of puncta. During the same period, we could account for >70–80% of the fluorescence in structures ≥300 nm in long axis diameter (Fig. 3 C).
Our EM approach was two pronged. First, we extended our earlier serial section analysis to generate 3D images of entire mitotic PtK-1 cells. Golgi clusters can be readily identified in EM sections, and serial sections were used to generate a topological map of clusters in cells at different phases of mitosis. One cell from each phase was chosen for the 3D reconstructions presented in Fig. 5 and Video 6. Detailed analysis of these reconstructions and scrutiny of all the sections from the other cells showed that clusters were clearly visible at all mitotic stages.
The other EM approach was to use peroxidase cytochemistry to follow the fate of individual clusters and Golgi-derived vesicles. Earlier data and that presented here show that clusters do shrink during mitosis, most likely through a process of shedding. It was important to show that this decrease in size was not the consequence of loss of Golgi membranes through fusion with the ER. In other words, vesicles may be shed from the clusters, but do they then fuse with the ER?
To study this question, we generated an NRK cell line stably expressing HRP coupled to a portion of SialylT, so as to locate it in the trans-Golgi. Stinchcombe and colleagues (1995) have shown that a single molecule of this construct is sufficient to stain a vesicle providing the most sensitive EM method to date. Two types of staining were observed in mitotic cells. The first was staining of some cluster vesicles and tubules, presumably those originating from breakdown of trans-Golgi membranes. The second was free vesicles, often residing in the spindle region. Most importantly, there was no staining of the ER despite extensive examination of sections. A total of five prometaphase, seven metaphase, six anaphase, and four telophase cells were serially sectioned in their entirety, and most sections were examined. The converse experiment was also carried out, transiently expressing an HRP construct tagged with KDEL. This showed that the ER also maintained its compartmental identity during mitosis, the pattern of staining being distinct from and complementary to that of the Golgi apparatus. Our data, therefore, provide no support for the idea that a substantial portion of Golgi membranes fuse with the ER during mitosis.
The reason put forward by Lippincott-Schwartz and colleagues for the fusion of Golgi membranes with the ER was the need to partition the Golgi apparatus during telophase (Zaal et al., 1999). Interestingly, however, we found that accurate partitioning was largely complete by metaphase, with nearly equal amounts of Golgi apparatus at each spindle pole. This is not the case at earlier times, during prophase when the future spindle poles are separating. Then, the Golgi fragments associate with one or other pole but the distribution varies widely from cell to cell. We noticed that some fragments moved from the pole with more Golgi fragments to the one with fewer, helping to correct the imbalance. We then found that the movement of these readily visualized fragments was insufficient to explain the correction measured by monitoring total fluorescence, suggesting that smaller Golgi fragments were also moving between the poles. The most obvious candidates were the shed vesicles, which increase in number during the prometaphase to metaphase period, and many of which were observed to associate with the spindle microtubules. Movement of clusters and vesicles along these microtubules might even help explain the rapid speed with which Golgi enzymes were observed to move in mitotic cells using FRAP techniques and interpreted as evidence for their presence in the ER (Zaal et al., 1999). Clearly, these Golgi-derived vesicles need to be examined in more detail since they could hold the key to the accuracy of Golgi partitioning.
Given that the present data confirm earlier observations by us and others on the absence of Golgi residents in the ER, how do they provide an explanation for the differences with other workers? There are obvious technical differences since we and others have been able to distinguish between Golgi clusters and the ER throughout mitosis using endogenous and tagged Golgi and ER proteins (Shima et al., 1997, 1998; Cabrera-Poch et al., 1998; Jesch and Linstedt, 1998; Lowe et al., 2000). Mitotic clusters are difficult optical specimens, with a small apparent diameter varying between ∼150 and 700 nm. Also, mitotic cells are often spherical or ovoid, so the image within the region of focus usually represents <5–10% of the total cell depth, and this cell shape leads to increased light scatter and intrinsic high background fluorescence, which lowers the signal-to-noise ratio (Pepperkok and Shima, 1999). It is also likely that mitotic clusters shed to different extents depending on the cell type and growth conditions, which could explain their variable ultrastructural morphology in different cell types (Cabrera-Poch et al., 1998).
Theoretically, the mitotic Golgi cluster could even disappear altogether. This does not, however, mean that they then fuse with the ER or that no remnant of Golgi structure exists. We have recently shown that merger of Golgi membranes with the ER, induced by brefeldin A or expression of dominant-negative Sar1p, leaves behind a structure depleted in Golgi enzymes but enriched in the golgin and GRASP families of structural proteins (Seemann et al., 2000b). These structures could still constitute the Golgi partitioning unit, independent of the ER.
A partial explanation for the different fates of the Golgi apparatus may lie in the use of certain GFP constructs. We and others have characterized GFP-tagged Golgi proteins that localize almost exclusively to the Golgi apparatus (Shima et al., 1997; Storrie et al., 1998). The GFP tracers, described by Zaal et al. (1999) and used by several workers (Kano et al., 2000; Terasaki, 2000), include one containing a triple concatamer of GFP. This is localized mostly to the Golgi apparatus but the rest, ∼30%, was present in the ER. This ER pool was shown to be in equilibrium with the Golgi pool, supporting the suggestion that there is a dynamic equilibrium between these two organelles. However, this ER pool is much larger than that demonstrated for any other Golgi enzyme, whether endogenous or tagged (Paulik et al., 1988; Nilsson et al., 1994; Jesch and Linstedt, 1998; Farmaki et al., 1999). One possible reason is that the fusion protein folds more slowly so that more, at any one time, would be present in the ER, or that the protein adopts a conformation that encourages more rapid recycling from the Golgi apparatus. The net effect would be the same, with more of the GFP chimera in the ER at steady state. This speculation is supported by our analysis of the GalT–GFP cell line using antisera to GFP. As shown in Fig. 2, >80% of the GFP protein was present in the ER compared with ∼30% of the GFP fluorescence. This suggests that most of the GFP is in the ER and is either in the process of folding or is unable to fold. In this way, the behavior of this GFP chimera mimics that of a GFP fusion to a temperature-sensitive folding mutant of the VSV G glycoprotein (Scales et al., 1997), which we have found to accumulate in a nonfluorescent state within the ER at temperatures normally permissive for protein folding and ER exit (unpublished data). The presence of so much folding GalT–GFP protein would provide a reasonable explanation for why it was so readily detected in the ER using immuno-EM techniques in both interphase and mitotic cells (Zaal et al., 1999). It does not, however, explain the immuno-EM results for endogenous GalT or mannosidase II tagged with a single GFP, though the absence of any degree of quantitation makes it difficult to draw a definitive conclusion or comparison. Further EM and mechanistic studies are required to clarify these discrepancies.
In summary, we have been unable to detect Golgi residents in the ER during mitosis and so we continue to favor the idea that the Golgi apparatus partitions itself during mitosis. Moreover, we find that partitioning of Golgi residents appears to be substantially accomplished by metaphase, raising questions about the potential functional relevance of any ER-based Golgi partitioning system. One reasonable thought is based on recent work on Golgi inheritance in budding yeast (Rossanese et al., 2001). This work suggests that the early Golgi complex is inherited via the ER, whereas the late Golgi complex is physically moved into the bud via actin filaments. Perhaps the ER partitions proteins of the ER–Golgi intermediate compartment (ERGIC) that rapidly recycle between these two organelles, leaving the Golgi stack to partition on its own.
Materials and methods
Cell lines and reagents
PtK-1 (American Type Culture Collection number CCL-35) cell lines harboring a chimera consisting of an enhanced GFP fused to the retention domain of N-acetylglucosaminyltransferase I were generated and cultured as previously described (Shima et al., 1998). NRK cells (American Type Culture Collection number CRL-1571) were cultured in F12K media (GIBCO BRL) supplemented with 10% FCS (Hyclone), penicillin/streptomycin (100 μg/ml) and 2 mM glutamine. Stable cell lines expressing the SialylT–HRP fusion protein were created by electroporation (BioRad Laboratories)-mediated transfection of pSR-SialylT-HRP (amino acids 1–45 encoding the cytoplasmic and transmembrane domain of SialylT fused to HRP; Stinchcombe et al., 1995) into NRK cells, and selection in 300 μg/ml Geneticin (GIBCO BRL). Stable cell colonies were propagated, further subcloned, and selected for uniform chimeric HRP expression by examination of DAB reaction product by light microscopy. ∼75% of the cells from the chosen SialylT-HRP line expressed the chimeric protein. NRK cells transiently expressing an ER-localized version of the HRP tag (KDEL-HRP; Stinchcombe et al., 1995) were used in control studies.
Antibodies and fluorescence labeling
Cells on coverslips were directly fixed in −20°C MeOH, washed with Ca2+- and Mg2+-free PBS containing 0.2% fish skin gelatin and 5% normal goat serum (Sigma-Aldrich) as blocking agents, and the appropriate antibodies were added in the same blocking solution. After immunostaining, DNA was labeled for fluorescence visualization using 200 ng/ml of Hoechst 33342 or 1 μM TOPRO-3 (Molecular Probes), and the cells were washed in PBS and mounted in Mowiol.
Antibodies for these experiments include affinity-purified rabbit antisera to rat GM130 (Nakamura et al., 1995) and giantin (Shima et al., 1998); antisera recognizing the ER marker BAP31 (Annaert et al., 1997), a gift from M. Reth (Max-Planck Institute for Immunobiology, Freiberg, Germany); mAb directed against rat GM130 (Transduction Laboratories); and GFP rabbit antisera raised against a recombinant EGFP (Shima et al., 1997; Gillham et al., 1999). Texas red X and Alexa 488-conjugated secondary antibodies were from Molecular Probes.
3D and 4D confocal laser scanning microscopy and quantitation
PtK-1 cells were plated on dishes with ∼0.17 mm thick coverglass bottoms (MatTek Corp) and visualized in phenol red–free low bicarbonate (0.35 g/liter) media supplemented with 20 mM Hepes, pH 7.4, and 2.5% FCS, 30 mM Oxyrase (Oxyrase Inc.) and overlaid with high-grade mineral oil (Sigma-Aldrich). Tetramethylrhodamine–tubulin (5 mg/ml; Molecular Probes) was microinjected 4 h before visualization. A 37°C environment was maintained by enclosing the cells and microscope in a Perspex box and controlling temperature with a heating fan and electronic control unit. 9–15 serial optical sections (at ∼0.45-μm intervals) in the z axis of mitotic cells were collected with an inverted laser scanning confocal microscope (LSM510; ZEISS) using 488-nm laser excitation, a 63× Plan-Apochromatic (either Ph3 or DIC) objective lens, 3–5× zoom, and a pinhole equivalent to one Airy disk diameter. Fixed double label fluorescence images were acquired similarly using 488- and 543-nm laser excitation. All confocal images were analyzed and are presented as a maximum intensity projection of a z-series through the entire cell depth. Where applicable, a single mid–Z-stack phase or DIC image is shown with the fluorescence layer. For all quantitation, images were background subtracted using a cell-free region of the field of view. For assessing partitioning accuracy, a threshold level of analysis was adjusted to specifically highlight Golgi membrane fluorescence in mitotic cells, and the pixel intensity and distribution above the threshold level were assessed on either side of the metaphase plate or cell midline. Size distribution of all significant fluorescent cellular material was estimated using IPLab (Scanalytics, Inc.) software and tabulated using Microsoft® Excel 98. In brief, 2D projected images were used for all analyses and were created from Z-stack images at each time point using the maximum intensity projection method. On several samples, summation of fluorescence algorithms were used to generate 2D projections, and these yielded comparable results in the distribution analysis. From these projections, cell outlines were traced using a region of interest tool, the total fluorescent signal in each cell was determined, and noncellular background in an identically sized sampling area was then subtracted from the total cellular fluorescence value to obtain a value for net cellular fluorescence. Next, a segmentation (thresholding) function was used to highlight fluorescent cellular objects, levels of segmentation being adjusted to include all fluorescent signals above background. Software functions were used to determine the major axis diameter and fluorescence intensity value for each segmented object. The fluorescence intensity value from all objects ≥300 nm in major axis diameter was summed and divided by the value for net cellular fluorescence. Results from this calculation were plotted graphically as percentage of fluorescence in structures ≥300 nm in major axis diameter (Fig. 3 C). A diameter of 300 nm was estimated to be the working limit of x–y resolution under the experimental conditions used for live cell experiments. All fixed and live cell images were processed for publication using Adobe® Photoshop™ v5.5.
Serial section electron microscopy
Glass coverslips were seeded at low density, and the PtK-1 cells were grown until each colony had 4–10 cells. Colonies containing a suitable mitotic cell were selected by light microscopy, and surrounding colonies were removed using a micromanipulator. Cells were then fixed and processed for electron microscopy as described (Seemann et al., 2000a). Sections were cut parallel to the coverslip through the whole cell without any trimming from the surface with a diamond knife. All sections were transferred to single slot 3.05-mm copper grids coated with formvar/carbon support film (TAAB). Four mitotic cells were completely sectioned (total number of sections in parentheses): prometaphase (84), metaphase (80), anaphase (87), and telophase (118). From these cells, 20, 11, 10, and 18 sections, respectively, at roughly equal intervals, were selected for imaging. Three to five photographs covering the whole cell in the section were taken at a magnification of 6.6×. Chromosomes and Golgi clusters were identified morphologically and manually traced onto transparencies that were scanned. Images were stacked using NIH Image v1.61 (http://rsb.info.nih.gov/nih-image/) and assembled into a movie.
Peroxidase cytochemistry
SialylT-HRP cells were grown on coverslips and, where indicated, treated with 5 μg/ml brefeldin A (Epicentre Technologies) for 30 min at 37°C. NRK cells were also transiently transfected with pRS-ssHRP-KDEL (HRP linked to the signal sequence from human growth hormone at the NH2 terminus and a KDEL retention signal at the COOH terminus; Connolly et al., 1994), using the Fugene 6 transfection reagent (Roche Molecular Biochemicals), according to the manufacturer's instructions, and incubated for 27 h. Mitotic cells were selected as described above and fixed with 2% formaldehyde 1.5% glutaraldehyde (both EM-grade; Electron Microscopy Sciences) in 0.1 M Na-cacodylate buffer, pH 7.4, for 20 min at room temperature. The cells were then processed for peroxidase electron microscopy as described (Brown and Farquhar, 1989) using 3,3′-diaminobenzidine tetra-HCl (DAB; TAAB).
Online supplemental material
Movies accompanying Fig. 3 A are animated 2D projections of a Z-series through the entire cell depth that demonstrate the initial stages of mitotic Golgi disassembly. The images of Golgi fluorescence are presented with phase contrast (Video 1), with phase and arrows (Video 2; red shows aborted shuttling across metaphase plate, green arrows show polar movements), and with no phase contrast (Video 3), to facilitate visualization of the Golgi movements.
Movies accompanying Fig. 4 are animated 2D projections of a Z-series through the entire cell depth that demonstrate the metaphase to late telophase stages of mitotic Golgi inheritance. The animation of fluorescent mitotic Golgi apparatus accompanying Fig. 4 A (Video 4) is presented with phase contrast, and Fig. 4 B (Video 5) with a simultaneous view of the microtubule cytoskeleton (using rhodamine–tubulin).
A rotating animation accompanies the EM reconstruction in Fig. 5 (Video 6), and examples of Golgi cluster profiles chosen for the reconstruction are shown in online supplemental Fig. S1. Low power sections of each phase (magnification 12×) are presented together with high power insets (prometaphase, 24×; rest, 36×) showing the clusters that were identified by morphological criteria and then used in the reconstructions. All online supplemental material is available at http://www.jcb.org/cgi/content/full/200104073/DC1.
Supplemental Material
Acknowledgments
We would like to thank Joyce Müller, Giampietro Schiavo, and Jim Shorter for critical reading of the manuscript; Dr. Jukka Jernvall for 3D reconstruction using NIH Image program; Ms. Mervi Lindman for technical assistance; Matthew Golding for assistance with cell culture.
This work was funded by The Imperial Cancer Research Fund and by National Institutes of Health grant GM60478-01.
The online version of this article contains supplemental material.
Footnotes
Abbreviations used in this paper: 2D, two-dimensional; 3D, three-dimensional; GalT, β-1,4-galactosyltransferase; NRK, normal rat kidney; SialylT, α-2,6-sialyltransferase.
References
- Annaert, W.G., B. Becker, U. Kistner, M. Reth, and R. Jahn. 1997. Export of cellubrevin from the endoplasmic-reticulum is controlled by BAP31. J Cell Biol. 139:1397-1410. [DOI] [PMC free article] [PubMed] [Google Scholar]
- Barr, F.A., M. Puype, J. Vandekerckhove, and G. Warren. 1997. GRASP65, a protein involved in the stacking of Golgi cisternae. Cell. 91:253–262. [DOI] [PubMed] [Google Scholar]
- Brown, W.J., and M.G. Farquhar. 1989. Immunoperoxidase methods for the localization of antigens in cultured cells and tissue sections by electron microscopy. Meth. Cell Biol. 31:553–569. [DOI] [PubMed] [Google Scholar]
- Cabrera-Poch, N., R. Pepperkok, and D.T. Shima. 1998. Inheritance of the mammalian Golgi-apparatus during the cell-cycle. Biochim. Biophys. Acta. 1404:139–151. [DOI] [PubMed] [Google Scholar]
- Colanzi, A., T.J. Deerinck, M.H. Ellisman, and V. Malhotra. 2000. A specific activation of the mitogen-activated protein kinase kinase 1 (MEK1) is required for Golgi fragmentation during mitosis. J. Cell Biol. 149:331–339. [DOI] [PMC free article] [PubMed] [Google Scholar]
- Cole, N.B., N. Sciaky, A. Marotta, J. Song, and J. Lippincott-Schwartz. 1996. Golgi dispersal during microtubule disruption—regeneration of Golgi stacks at peripheral endoplasmic-reticulum exit sites. Mol. Biol. Cell. 7:631–650. [DOI] [PMC free article] [PubMed] [Google Scholar]
- Connolly, C.N., C.E. Futter, A. Gibson, C.R. Hopkins, and D.F. Cutler. 1994. Transport into and out of the Golgi complex studied by transfecting cells with cDNAs encoding horseradish peroxidase. J. Cell Biol. 127:641–652. [DOI] [PMC free article] [PubMed] [Google Scholar]
- Draviam, V.M., S. Orrechia, M. Lowe, R. Pardi, and J. Pines. 2001. The localization of human cyclins B1 and B2 determines CDK1 substrate specificity and neither enzyme requires MEK to disassemble the Golgi apparatus. J. Cell Biol. 152:945–958. [DOI] [PMC free article] [PubMed] [Google Scholar]
- Farmaki, T., S. Ponnambalam, A.R. Prescott, H. Clausen, B.L. Tang, W. Hong, and J.M. Lucocq. 1999. Forward and retrograde trafficking in mitotic animal cells. ER-Golgi transport arrest restricts protein export from the ER into COPII-coated structures. J. Cell Sci. 112:589–600. [DOI] [PubMed] [Google Scholar]
- Farquhar, M.G., and G.E. Palade. 1981. The Golgi apparatus (complex)—(1954–1981)—from artifact to center stage. J. Cell Biol. 91:77–103. [DOI] [PMC free article] [PubMed] [Google Scholar]
- Featherstone, C., G. Griffiths, and G. Warren. 1985. Newly synthesized G protein of vesicular stomatitis virus is not transported to the Golgi complex in mitotic cells. J. Cell Biol. 101:2036–2046. [DOI] [PMC free article] [PubMed] [Google Scholar]
- Gillham, H., M.C. Golding, R. Pepperkok, and W.J. Gullick. 1999. Intracellular movement of green fluorescent protein–tagged phosphatidylinositol 3-kinase in response to growth factor receptor signaling. J. Cell Biol. 146:869–880. [DOI] [PMC free article] [PubMed] [Google Scholar]
- Glick, B.S. 2000. Organization of the Golgi apparatus. Curr. Opin. Cell Biol. 12:450–456. [DOI] [PubMed] [Google Scholar]
- Heim, R., and R.Y. Tsien. 1996. Engineering green fluorescent protein for improved brightness, longer wavelengths and fluorescence resonance energy transfer. Curr. Biol. 6:178–182. [DOI] [PubMed] [Google Scholar]
- Jesch, S.A., and A.D. Linstedt. 1998. The Golgi and endoplasmic-reticulum remain independent during mitosis in HeLa cells. Mol. Biol. Cell. 9:623–635. [DOI] [PMC free article] [PubMed] [Google Scholar]
- Jesch, S.A., T.S. Lewis, N.G. Ahn, and A.D. Linstedt. 2001. Mitotic phosphorylation of Golgi reassembly stacking protein 55 by mitogen activated protein kinase ERK2. Mol. Biol. Cell. In press. [DOI] [PMC free article] [PubMed] [Google Scholar]
- Kano, F., K. Takenaka, A. Yamamoto, K. Nagayama, E. Nishida, and M. Murata. 2000. MEK and Cdc2 kinase are sequentially required for Golgi disassembly in MDCK cells by the mitotic Xenopus extracts. J. Cell Biol. 149:357–368. [DOI] [PMC free article] [PubMed] [Google Scholar]
- Lippincott-Schwartz, J., L.C. Yuan, J.S. Bonifacino, and R.D. Klausner. 1989. Rapid redistribution of Golgi proteins into the ER in cells treated with brefeldin A: evidence for membrane cycling from Golgi to ER. Cell. 56:801–813. [DOI] [PMC free article] [PubMed] [Google Scholar]
- Lowe, M., N. Nakamura, and G. Warren. 1998. a. Golgi division and membrane traffic. Trends Cell Biol. 8:40–44. [DOI] [PubMed] [Google Scholar]
- Lowe, M., C. Rabouille, N. Nakamura, R. Watson, M. Jackman, E. Jämsä, D. Rahman, D.J.C. Pappin, and G. Warren. 1998. b. Cdc2 kinase directly phosphorylates the cis-Golgi matrix protein GM130 and is required for Golgi fragmentation in mitosis. Cell. 94:783–793. [DOI] [PubMed] [Google Scholar]
- Lowe, M., N.K. Gonatas, and G. Warren. 2000. The mitotic phosphorylation cycle of the cis-Golgi matrix protein GM130. J. Cell Biol. 149:341–356. [DOI] [PMC free article] [PubMed] [Google Scholar]
- Lucocq, J.M., and G. Warren. 1987. Fragmentation and partitioning of the Golgi apparatus during mitosis in HeLa cells. EMBO J. 6:3239–3246. [DOI] [PMC free article] [PubMed] [Google Scholar]
- Lucocq, J.M., J.G. Pryde, E.G. Berger, and G. Warren. 1987. A mitotic form of the Golgi apparatus in HeLa cells. J. Cell Biol. 104:865–874. [DOI] [PMC free article] [PubMed] [Google Scholar]
- Lucocq, J.M., E.G. Berger, and G. Warren. 1989. Mitotic Golgi fragments in HeLa cells and their role in the reassembly pathway. J. Cell Biol. 109:463–474. [DOI] [PMC free article] [PubMed] [Google Scholar]
- Misteli, T., and G. Warren. 1995. A role for tubular networks and a COP I-independent pathway in the mitotic fragmentation of Golgi stacks in a cell-free system. J. Cell Biol. 130:1027–1039. [DOI] [PMC free article] [PubMed] [Google Scholar]
- Munro, S., and H.R. Pelham. 1987. A C-terminal signal prevents secretion of luminal ER proteins. Cell. 48:899–907. [DOI] [PubMed] [Google Scholar]
- Nakamura, N., C. Rabouille, R. Watson, T. Nilsson, N. Hui, P. Slusarewicz, T.E. Kreis, and G. Warren. 1995. Characterization of a cis-Golgi matrix protein, GM130. J. Cell Biol. 131:1715–1726. [DOI] [PMC free article] [PubMed] [Google Scholar]
- Nilsson, T., M.H. Hoe, P. Slusarewicz, C. Rabouille, R. Watson, F. Hunte, G. Watzele, E.G. Berger, and G. Warren. 1994. Kin recognition between medial Golgi enzymes in HeLa cells. EMBO J. 13:562–574. [DOI] [PMC free article] [PubMed] [Google Scholar]
- Paulik, M., D.D. Nowack, and D.J. Morre. 1988. Isolation of a vesicular intermediate in the cell-free transfer of membrane from transitional elements of the endoplasmic reticulum to Golgi apparatus cisternae of rat liver. J. Biol. Chem. 263:17738–17748. [PubMed] [Google Scholar]
- Pepperkok, R., and D.T. Shima. 1999. Fluorescence microscopy of living cells. Practical Approach Series: Microscopic Visualization of Living Cells. Oxford University Press, New York, NY. 120–138.
- Pypaert, M., T. Nilsson, E.G. Berger, and G. Warren. 1993. Mitotic Golgi clusters are not tubular endosomes. J. Cell Sci. 104:811–818. [DOI] [PubMed] [Google Scholar]
- Rambourg, A., Y. Clermont, L. Hermo, and D. Segretain. 1987. Tridimensional structure of the Golgi apparatus of non-ciliated epithelial cells of the ductuli efferentes in rat: an electron microscopic stereoscopic study. Biol. Cell. 60:103–116. [DOI] [PubMed] [Google Scholar]
- Rieder, C.L., and R.W. Cole. 1998. Entry into mitosis in vertebrate somatic cells is guarded by a chromosome damage checkpoint that reverses the cell cycle when triggered during early but not late prophase. J. Cell Biol. 142:1013–1022. [DOI] [PMC free article] [PubMed] [Google Scholar]
- Rossanese, O.W., C.A. Reinke, B.J. Bevis, A.T. Hammond, I.B. Sears, J. O'Connor, and B.S. Glick. 2001. A role for actin, Cdc1p, and Myo2p in the inheritance of late Golgi elements in Saccharomyces cerevisiae. J. Cell Biol. 153:47–62. [DOI] [PMC free article] [PubMed] [Google Scholar]
- Sacchetti, A., and S. Alberti. 1999. Protein tags enhance GFP folding in eukaryotic cells. Nat. Biotechnol. 17:1046. [DOI] [PubMed] [Google Scholar]
- Scales, S.J., R. Pepperkok, and T.E. Kreis. 1997. Visualization of ER-to-Golgi transport in living cells reveals a sequential mode of action for COPII and COPI. Cell. 90:1137–1148. [DOI] [PubMed] [Google Scholar]
- Seemann, J., E. Jämsä Jokitalo, and G. Warren. 2000. a. The role of the tethering proteins p115 and GM130 in transport through the Golgi apparatus in vivo. Mol. Biol. Cell. 11:635–645. [DOI] [PMC free article] [PubMed] [Google Scholar]
- Seemann, J., E. Jokitalo, M. Pypaert, and G. Warren. 2000. b. Matrix proteins can generate the higher order architecture of the Golgi apparatus. Nature. 407:1022–1026. [DOI] [PubMed] [Google Scholar]
- Shima, D.T., and G. Warren. 1998. Inheritance of the cytoplasm during cell division. Dynamics of Cell Division: Frontiers in Molecular Biology. S.A. Endow and D.M. Glover, editors. Oxford University Press, Oxford, UK. 248–269.
- Shima, D.T., K. Haldar, R. Pepperkok, R. Watson, and G. Warren. 1997. Partitioning of the Golgi apparatus during mitosis in living HeLa cells. J. Cell Biol. 137:1211–1228. [DOI] [PMC free article] [PubMed] [Google Scholar]
- Shima, D.T., N. Cabrera-Poch, R. Pepperkok, and G. Warren. 1998. An ordered inheritance strategy for the Golgi apparatus: visualization of mitotic disassembly reveals a role for the mitotic spindle. J. Cell Biol. 141:955–966. [DOI] [PMC free article] [PubMed] [Google Scholar]
- Shorter, J., R. Watson, M.E. Giannakou, M. Clarke, G. Warren, and F.A. Barr. 1999. GRASP55, a second mammalian GRASP protein involved in the stacking of Golgi cisternae in a cell-free system. EMBO J. 18:4949–4960. [DOI] [PMC free article] [PubMed] [Google Scholar]
- Souter, E., M. Pypaert, and G. Warren. 1993. The Golgi stack reassembles during telophase before arrival of proteins transported from the endoplasmic reticulum. J. Cell Biol. 122:533–540. [DOI] [PMC free article] [PubMed] [Google Scholar]
- Stinchcombe, J.C., H. Nomoto, D.F. Cutler, and C.R. Hopkins. 1995. Anterograde and retrograde traffic between the rough endoplasmic reticulum and the Golgi complex. J. Cell Biol. 131:1387–1401. [DOI] [PMC free article] [PubMed] [Google Scholar]
- Storrie, B., J. White, S. Rottger, E.H.K. Stelzer, T. Suganuma, and T. Nilsson. 1998. Recycling of Golgi-resident glycosyltransferases through the ER reveals a novel pathway and provides an explanation for nocodazole-induced Golgi scattering. J. Cell Biol. 143:1505–1521. [DOI] [PMC free article] [PubMed] [Google Scholar]
- Terasaki, M. 2000. Dynamics of the endoplasmic reticulum and Golgi apparatus during early sea urchin development. Mol. Biol. Cell. 11:897–914. [DOI] [PMC free article] [PubMed] [Google Scholar]
- Thyberg, J., and S. Moskalewski. 1992. Reorganization of the Golgi complex in association with mitosis: redistribution of mannosidase II to the endoplasmic reticulum and effects of brefeldin A. J. Submicrosc. Cytol. Pathol. 24:495–508. [PubMed] [Google Scholar]
- Troyer, D., and M.L. Cameron. 1980. Spermiogenesis in lumbricid earthworms revisited. I. Function and fate of centrioles, fusion of organelles and organelle movements. Biol. Cell. 37:279–286. [Google Scholar]
- Wacker, I., C. Kaether, A. Kromer, A. Migala, W. Almers, and H.H. Gerdes. 1997. Microtubule-dependent transport of secretory vesicles visualized in real-time with a GFP-tagged secretory protein. J. Cell Sci. 110:1453–1463. [DOI] [PubMed] [Google Scholar]
- Warren, G. 1985. Membrane traffic and organelle division. Trends Biochem. Sci. 10:439–443. [Google Scholar]
- Warren, G. 1993. Membrane partitioning during cell division. Annu. Rev. Biochem. 62:323–348. [DOI] [PubMed] [Google Scholar]
- Warren, G., and W. Wickner. 1996. Organelle inheritance. Cell. 84:395–400. [DOI] [PubMed] [Google Scholar]
- Zaal, K.J., C.L. Smith, R.S. Polishchuk, N. Altan, N.B. Cole, J. Ellenberg, K. Hirschberg, J.F. Presley, T.H. Roberts, E. Siggia, et al. 1999. Golgi membranes are absorbed into and reemerge from the ER during mitosis. Cell. 99:589–601. [DOI] [PubMed] [Google Scholar]
Associated Data
This section collects any data citations, data availability statements, or supplementary materials included in this article.


