

Abstract
Little is known about the fate of normal human mammary epithelial cells (HMECs) that lose p53 function in the context of extracellular matrix (ECM)–derived growth and polarity signals. Retrovirally mediated expression of human papillomavirus type 16 (HPV-16) E6 and antisense oligodeoxynucleotides (ODNs) were used to suppress p53 function in HMECs as a model of early breast cancer. p53+ HMEC vector controls grew exponentially in reconstituted ECM (rECM) until day 6 and then underwent growth arrest on day 7. Ultrastructural examination of day 7 vector controls revealed acinus-like structures characteristic of normal mammary epithelium. In contrast, early passage p53− HMEC cells proliferated in rECM until day 6 but then underwent apoptosis on day 7. p53− HMEC-E6 passaged in non-rECM culture rapidly (8–10 passages), lost sensitivity to both rECM-induced growth arrest and polarity, and also developed resistance to rECM-induced apoptosis. Resistance was associated with altered expression of α3-integrin. Treatment of early passage p53− HMEC-E6 cells with either α3- or β1-integrin function-blocking antibodies inhibited rECM-mediated growth arrest and induction of apoptosis. Our results indicate that suppression of p53 expression in HMECs by HPV-16 E6 and ODNs may sensitize cells to rECM-induced apoptosis and suggest a role for the α3/β1-heterodimer in mediating apoptosis in HMECs grown in contact with rECM.
Keywords: extracellular matrix; mammary epithelial cells; apoptosis; p53; α3/β1-integrin
Introduction
Interactions between extracellular matrix (ECM)*and mammary epithelial cells are critical for the regulation of cellular proliferation, polarity, and apoptosis (Petersen et al., 1992; Strange et al., 1992). These normal interactions may be disrupted during breast carcinogenesis (Petersen et al., 1992; Zutter et al., 1995). It has been observed that although normal mammary epithelial cells undergo growth arrest in culture in the presence of reconstituted ECM (rECM), breast cancer cells and established breast cancer cell lines fail to exhibit similar growth arrest (Petersen et al., 1992). Thus, it is hypothesized that interaction with ECM may serve to distinguish the growth patterns of normal and malignant mammary epithelial cells.
The mechanism by which ECM-mediated signal transduction events might result in changes in gene expression is a subject of current investigation. It has been shown that rECM regulates both biomechanical and biochemical signaling events and conversely that alterations in cell morphology can alter the response of cells to rECM (Folkman and Moscona, 1978; Roskelley et al., 1994). It is hypothesized that because malignant cells have an altered response to rECM, ECM signaling pathways may utilize tumor suppressor checkpoints critical for cellular organization and polarity (Petersen et al., 1992; Howlett et al., 1994; Weaver et al., 1997).
Integrins are heterodimeric cell surface receptors that link ECM to structural and functional components within the cell (Hynes, 1992). There is increasing evidence that integrins are important regulators of normal mammary morphology, since mammary carcinoma cells frequently demonstrate atypical patterns of integrin expression including loss, downregulation, or improper localization (Koukoulis et al., 1991; Glukhova et al., 1995; Lichtner et al., 1998). In the normal mammary gland, the α3/β1 integrin is expressed at the basal surface of luminal epithelial cells (Koukoulis et al., 1991; Glukhova et al., 1995). In contrast, invasive breast carcinomas demonstrate weak staining and redistribution of the α3/β1 integrin. Recently, the α3/β1 integrin has attracted considerable interest, since its function appears to be versatile. For example, the integrin α3/β1 functions as a cell adhesion receptor for laminin-5 (epiligrin), a major ECM protein present in basement membrane (Xia et al., 1996). The α3/β1-integrin is recruited to focal adhesion contacts in cultured cells and thereby plays an important role in linking ECM to components of the actin cytoskeleton (Carter et al., 1990b; Grenz et al., 1993; DiPersio et al., 1995). Integrin α3/β1 is a critical mediator of intracellular adhesion (Kawano et al., 2001). Studies in keratinocytes suggest that α3/β1 plays a critical role in cell spreading and migration and promotes gap junctional communication (Carter et al., 1990b; Xia et al., 1996; DiPersio et al., 1997). Recently, α3/β1-integrin has been shown to be involved in the initiation apoptosis (Sato et al., 1999). Taken together, these studies illustrate the multifaceted role of α3/β1-integrin in mediating interactions between ECM and epithelial cells and perhaps in initiating apoptosis.
Tissue homeostasis is maintained by a dynamic equilibrium between cellular proliferation and cell death (Evan and Littlewood, 1998). Apoptosis is considered to be the predominant mechanism of cell death and plays a central role in controlling cell number and eliminating cells sustaining DNA damage (Ashkenazi and Dixit, 1998). The role of the tumor suppressor p53 in ECM-induced growth arrest, polarity, and apoptosis is unknown. TP53 is a cell cycle “checkpoint” gene critical for cell cycle regulation, and it is functionally inactivated in human cancer at a high frequency (Hansen and Oren, 1997). Mutations of the TP53 gene are detected commonly in breast cancers and are associated with an increased risk of malignancy (Ashkenazi and Dixit, 1998; Levesque et al., 1998). Aberrant expression of p53 in mammary epithelial cells may be a biomarker predicting risk for subsequent breast carcinogenesis. Accumulation of p53 protein in mammary epithelial cells is detected frequently in women at high risk for the development of breast cancer (Fabian et al., 1996) and associated with an increased risk of progression to breast cancer in women with benign breast disease (Rohan et al., 1998).
Retrovirally mediated introduction of human papillomavirus type 16 (HPV-16) E6 protein into cells provides a model for the isolated loss of p53 function. The E6 protein of the cancer-associated HPV-16 binds to p53 and targets it for degradation through the ubiquitin pathway (Demers et al., 1996). We employed this approach and antisense (AS) oligondeoxyucleotides (ODNs) to acutely suppress p53 function in normal human mammary epithelial cells (HMECs) in order to model p53 loss in the context of ECM signaling.
Our results showed that control HMECs expressing p53 underwent rECM-mediated growth arrest and formed a polarized epithelium. In contrast, HMECs with HPV-16 E6– and ODN-suppressed p53 expression underwent rECM-induced growth arrest followed by apoptosis. p53− HMEC-E6 cells passaged in non-rECM culture rapidly acquired resistance to rECM-mediated growth arrest, polarity, and apoptosis after 8 –10 passages in culture. Treatment of early passage p53− HMEC-E6 cells with either α3- or β1-integrin function-altering antibodies (Abs) blocked rECM-mediated growth arrest and induction of apoptosis. Observations in our model system suggest that rECM may play an important role in the induction of apoptosis in early passage p53− HMECs via an α3/β1 signaling pathway.
Results
p53 protein suppression in HMECs
Retrovirally mediated expression of the HPV-16 E6 protein was used to suppress normal intracellular p53 protein levels in HMECs. The pLXSN16E6 retroviral vector containing the coding sequence for HPV-16 E6 viral protein has been described previously (Demers et al., 1994). Actively dividing passage 9 AG11132 cells were infected with the retroviral vector LXSN16E6 or the control vector LXSN, and the infected cells were selected as described in Materials and methods. All experiments described subsequently were performed on mass cultures. HMEC-P parental cells, p53+ HMEC-LXSN controls, and p53− HMEC-E6 cells were passaged serially in culture on plastic tissue culture plates. As previously observed (Seewaldt et al., 1999a,b), p53+ HMEC-LXSN controls and HMEC-P parental cells exhibited a progressive increase in doubling time with continued serial passaging and entered “phase b” growth plateau at about passage 23 (Romanov et al., 2001). In contrast, p53− HMEC-E6 cells exhibited an extended lifespan in culture and entered a growth plateau at passage 40.
Northern blot analysis was performed on p53+ HMEC-P parental cells, p53− HMEC-E6 cells, and p53+ HMEC-LXSN controls (passage 11 and 18) to test for HPV-16 E6 mRNA expression. Expression of the LTR-initiated E6 mRNA transcript was observed in p53− HMEC-E6 cells at passage 11 and 18 but not in parental or vector controls (Fig. 1 a).
Figure 1.
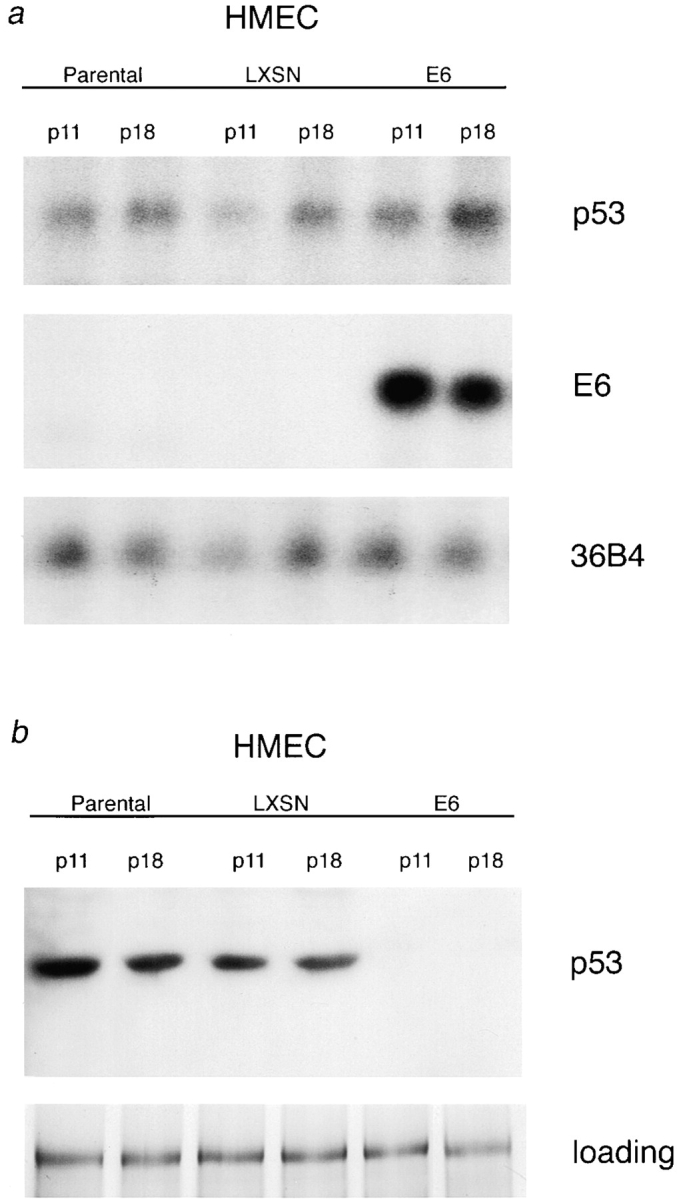
Expression of p53 and HPV-16 E6 mRNA and p53 proteins in HMECs. (a) Expression of endogenous p53 and exogenous HPV-16 E6 mRNA in HMECs. Passage 10 and 18 p53+ HMEC-P parental cells (Parental), p53+ HMEC-LXSN controls (LXSN), and p53− HMEC-E6 cells (E6) were analyzed for p53 and HPV-16 E6 mRNA expression. 10 μg of RNA were loaded per lane. 36B4 served as a loading control. (b) Expression of p53 protein is suppressed in p53− HMEC-E6 cells. Passage 10 and 18 p53+ HMEC-P parental cells (Parental), p53+ HMEC-LXSN controls (LXSN), and p53− HMEC-E6 cells (E6) were analyzed for p53 protein expression as described in Materials and methods. Equal amounts of protein lysate were loaded per lane. The protein gel was stained with Coomassie blue, and an unknown 45-kD protein band was used as a loading control.
Western blots were performed on p53+ HMEC-P parental cells, p53− HMEC-E6 cells, and p53+ HMEC-LXSN controls (passage 11 and 18) to determine the relative levels of p53 protein expression. Expression of p53 protein was observed in p53+ HMEC-P parental cells and p53+ HMEC-LXSN vector controls but was not detectable by Western analysis in p53− HMEC-E6 cells at either passage 11 or 18 (Fig. 1 b).
Cytogenetic analysis of early and late passage p53+ and p53− HMECs
Cytogenetic analysis of p53+ HMEC-P parental cells, p53+ HMEC-LXSN controls, and early passage p53− HMEC-E6 cells was performed using both spectral karyotyping (SKY) and DAPI staining to (a) test whether parental and vector control cells exhibited a normal karyotype and (b) verify that early passage p53− HMEC-E6 cells did not exhibit specific karyotypic abnormalities.
38 early passage p53+ HMEC-P parental cells (passage 8) were karyotyped. 35 (92%) metaphase cells had a normal diploid karyotype. Three cells (8%) exhibited random chromosome loss.
Similarly, 22 early passage p53+ HMEC-LXSN control cells (passage 10) were karyotyped. 20 (91%) p53+ HMEC-LXSN metaphase cells had a normal diploid karyotype. Two cells (9%) exhibited random chromosome loss.
22 late passage p53+ HMEC-LXSN control cells (passage 17) were karyotyped. 18 (82%) p53+ HMEC-LXSN metaphase cells had a normal diploid karyotype. Three cells (13%) exhibited random chromosome loss. One cell (5%) was tetraploid (92 chromosomes). These results are consistent with karyotypes reported for late “phase a” (pregrowth plateau) HMECs (Romanov et al., 2001).
A total of 21 early passage p53− HMEC-E6 metaphase cells (passage 10) were karyotyped. Two cells were analyzed by SKY, and 19 cells were analyzed using inverted and contrast-enhanced DAPI staining. The majority of cells (12 cells, 57%) had a normal diploid chromosome content, three cells had random chromosome loss (14%), and the remaining cells were aneuploid. In three cells (14%), multiple losses of whole chromosomes occurred, resulting in the chromosomes number of 30, 32, and 36, respectively. The other three cells (14%) were either tetraploid (92 chromosomes) or hypotetraploid (90 and 80 chromosomes). Only two cells, both near diploid and both studied using DAPI staining, displayed structural chromosome changes: inv(20)(p11q13.1) in one cell, and del(X)(p21), dic(14;19)(q32;q13.4), and a marker chromosome in another.
In contrast to early passage cells, late passage p53− HMEC-E6 (passage 18) were markedly abnormal with numerical and structural chromosome aberrations. A total of 35 metaphase cells were analyzed: 27 using SKY and 8 using inverted and contrast-enhanced DAPI staining (Table I). These results have been published previously (Seewaldt et al., 2001). No cell had a normal diploid karyotype. The predominant types of structural changes were deletions, whole arm translocations, and dicentric chromosomes with breakpoints in the pericentromeric and/or telomeric regions. Although a majority of the 35 cells contained complex chromosomal rearrangements, each resistant cell analyzed was unique. This suggests that chromosome aberrations observed in the late passage p53− HMEC-E6 cell population resulted from a generalized event causing karyotypic instability that is inconsistent with the outgrowth of a mutant clone.
Table I.
Karyotype of late passage p53 − HMEC-E6 cells
| Cell number | Karyotype |
|---|---|
| S14 | 32<2n>,XX,−1,−2,−5,−8,−11,−12,−14,−16,−16,−17,−18,−20,−21, der(10;21)(q10;q10),−22,+mar |
| S21 | 35,XX,−2,−3,−5,−6,−7,−8,−11,dic(12;20)(p1?1;p13),−16,del(16)(p11),−18,−19 |
| S24 | 36,−X,t(X;14)(q2?8;q24),r(5),der(6)del(6)(p22)del(6)(q11),−9,−10,−10,−13, dic(14;21)(q32;q22),−15,−15,der(17;21)(q10;q10),−22 |
| S32 | 36,XX,−1,−3,−5,−6,del(8)(q13q24),−9,−11,−13,−17,−18,−19 |
| S17 | 39,X,−X,−1,del(3)(p11),der(6;21)(q10;q10),del(8)(q24),del(12)(p13),−15,del(16)(p11),−18,−19,−21 |
| S19 | 38,XX,−1,−2,−5,−7,dic(9;20)(p11;p13),−15,dic(16;21)(p11;p13),−18 |
| S6 | 40,XX,del(1)(q3?1),−3,der(6)t(3;6)(?;p11),−10,der(12;16)(q10;q10),−15,−17,−10, der(?21)t(20;?21)(p11;q11) |
| S30 | 41,X,dic(X;12)(q28;p11),del(8)(?p11),der(16;21)(q10;q10),der(15;21)(q10;q10), dic(17;18)(p11;p11.3),−22 |
| S33 | 41,XX,dic(5;21)(p1?5;p1?3),dic(12;21)(p1?2;q22),dic(15;17)(p13;q25),dic(16;22)(p11;p1?3), dic(18;20)(p11.3;q13.?1) |
| S13 | 41,XX,−1,−4,−6,−10,dic(12;17)(p13;p1?3),add(16)(p11),−21 |
| S34 | 42,XX,del(2)(q11),del(9)(q11),del(12)(p1?2),dic(12;16)(p11;q24),−15,−21,−21 |
| S7 | 44,XX,dic(6;8)(p25;p23),−13,del(17)(p11),der(21;22)(q10;q10) |
| S9 | 44,X,dic(X;21)(p22;p1?1),del(2)(q11),+der(2),+der(2)t(2;16)(?;?q1?3),−16,−17,−19 |
| S2 | 44,XX,del(7)(q11),trc(7;21;20)(q36;p11q21−22;p13),del(16)(?p11) |
| S20 | 44,XX,der(12;16)(q10;q10),dic(20;21)(p13;p1?1) |
| S26 | 44,XX,dic(10;17)(q26;p1?1),−12 |
| S28 | 44,X,dic(X;15)(q11;p11),−16 |
| S29 | 44,XX,−5,del(16)(p11) |
| S27 | 45,XX,−10,der(16)t(10;16)(q11;p11),t(20;20)(q13.1;q13.3) |
| S16 | 45,XX,+15,dic(15;15)(q26;p1?3),der(12;16)(q10;q10),der(20)t(18;20)(?q12;p13) |
| S5 | 45,XX,dic(14;21)(q3?2;p11),−15,del(16)(p11),del(17)(p11),+21,der(21)t(14;21)(?;?p11) |
| S18 | 46,XX,csb(2)(p11),del(9)(q12),del(12)(p13),der(16;21)(q10;q10),dic(20;21)(p13;p13) |
| S10 | 49,XX,+2,dic(3;6)(p26;p25)×2,+dic(3;22)(p11;p13),+5,+5,t(5;9)(q35;q34), dic(6;20)(p25;q13.?1),−7,+8,+10,+dic(12;6;19)(p13;?;p13.?3),−13,+14,−15,+16, der(16)t(13;16)(q1?2;p13)x2,+der(17)t(17;19)(p11;?p12),+18,dic(20;20)(p13;q13.3),−21 |
| S15 | 55,X,t(X8)(q2?8p21),+der(X)t(X2)(p22?),−1,del(2)(q11),+del(2)(?p11),+3,+4,+5,+5,+7,+7,−9,+11, +11,dic(12;21)(p13;q22)?dup(12)(p11p13),+13,+14,−16,del(16)(p1?2),−19,+20,+22 |
| S35 | 61<3n>,−X,−X,−X,−1,−2,−3,−3,−4,+5,−7,−7,+8,+9,−12, der(12)t(X;12)(q21;p13),+14,−15,−16,−20 |
| S1 | 63<3n>,XXX,−2,−3,der(3)del(3)(p21)del(3)(q2?3),+4,der(6)inv(6)(p25q23)dic(66)(p25q27),+7,+10, +11,+12,dic(12;22)(p13;p13)×2,−14,−15,−16,−16,dic(20;20)(p13;q13.3),−21,der(21;21)(q10;q10) |
| S25 | 84,XXX,del(X)(q13),−3,−5,del(6)(p11),−8,−8,dic(14;16)(p11;p11)×2,dic(17;21)(p13;q22)×2 |
| D1 | 46,XX,del(16)(p1?1) |
| D3 | 43,XX,−15,−19,−20 |
| D10 | 41,X,−X,dic(7;21)(p22;q22),−11,dic(12;?)(p13;?),−15,dic(16;?)(p1?1;?),−20,−21,−22,+2mar |
| D6 | 44,XX,−6,der(12;16)(q10;q10) |
| D9 | 44,XX,der(16;20)(q10;q10),der(17;21)(q10;q10) |
| D12 | 41,XX,−12,add(15)(p11−13),−16,add(17)(p1?1),−20,−21,−21 |
| D14 | 44,XX,+9,dic(?9;12)(q34;p13),der(16;17)(q10;q10),dic(21;21)(q22;q22) |
| D2 | 45,XX,der(12;14)(q10;q10) |
Morphologic appearance of early and late passage HMECs with HPV-16 E6–suppressed p53 expression
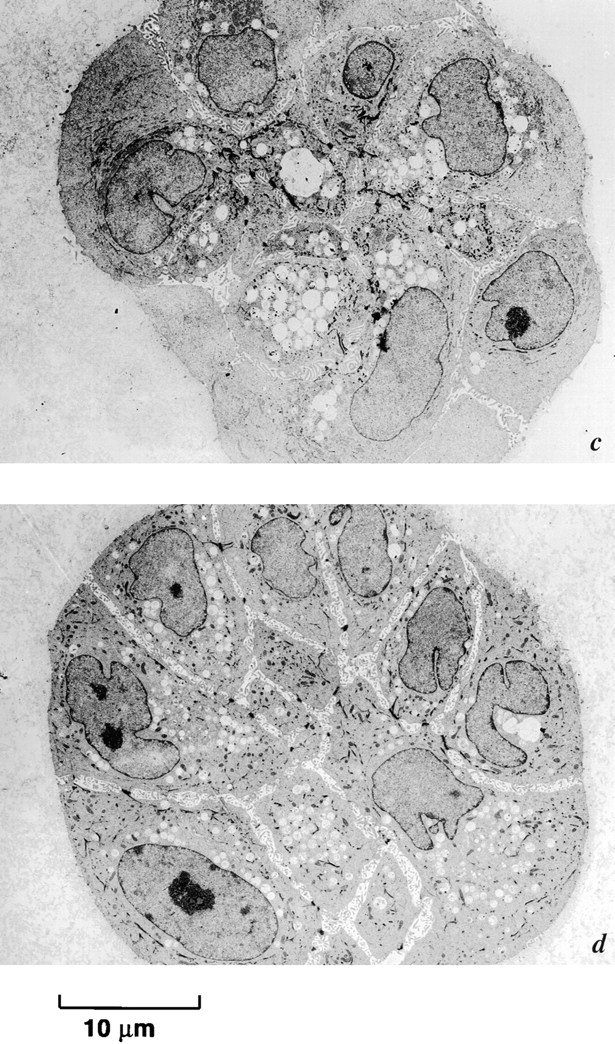
Early passage p53+ HMEC-LXSN controls (passage 10) and p53− HMEC-E6 cells (passage 10) were similar in appearance (Fig. 2, a and b). Late passage p53+ HMEC-LXSN cells (passage 21) exhibited morphologic changes characteristic of senescence including increased cell size and increased cytoplasmic vesicles (Fig. 2 c). In contrast, late passage p53− HMEC-E6 cells (passage 18) were morphologically similar (but not identical) to passage 10 cells (Fig. 2 d).
Figure 2.
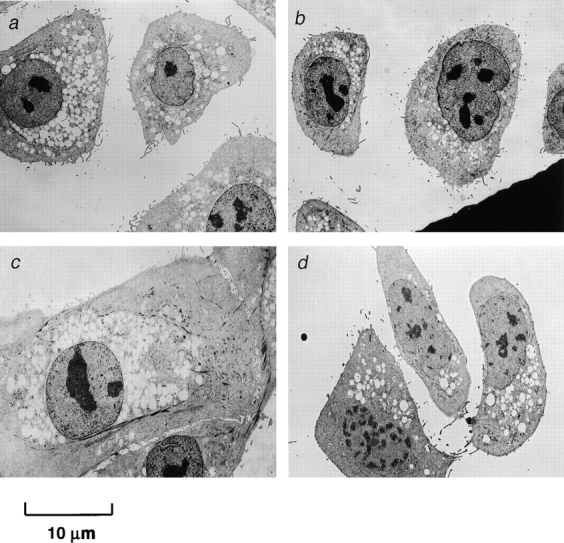
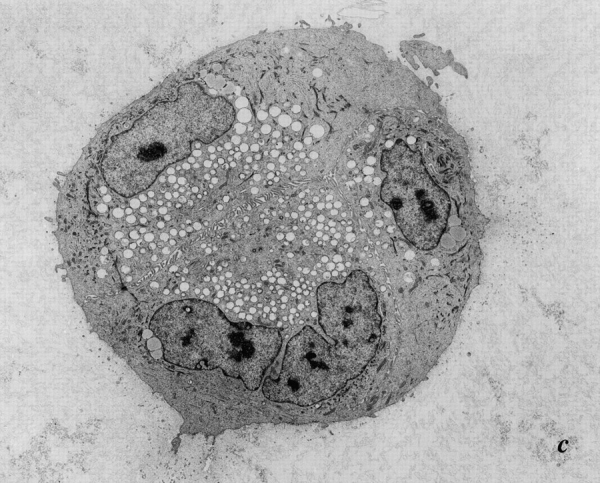
Morphologic appearance of early and late passage HMECs expressing HPV-16 E6. Electron micrographs of early passage (passage 10) p53+ HMEC-LXSN controls (a) and p53− HMEC-E6 cells (b) grown in tissue culture for 4 d were similar in appearance. (c) Late passage (passage 21) p53+ HMEC-LXSN vector control cells were approaching in vitro senescence, were significantly larger than early passage cells, and contained increased numbers of vesicles. (d) Passage 18 p53− HMEC-E6 cells were similar in appearance (but not identical) to passage 10 cells.
rECM-induced growth arrest of HMECs is not altered by the acute expression of HPV-16 E6
Early passage p53+ HMEC-LXSN controls (passage 10) and p53− HMEC-E6 cells (passage 10) were grown in prepared rECM as a single cell suspension. Both p53+ HMEC-LXSN and p53− HMEC-E6 cells grew exponentially in rECM until day 6 and then growth arrested on day 6–7 (Fig. 3). They formed a uniform population of spherical colonies. The mean diameter of p53+ HMEC-LXSN and p53− HMEC colonies on day 7 was 30.5 ± 7.4 and 33 ±5.5 μm, respectively (Fig. 3). There was a decrease in the mean sphere diameter of p53− HMEC-E6 cells relative to controls on day 9, but this was not statistically significant. These data suggest that the acute suppression of p53 function in HMECs by HPV-16 E6 alters neither proliferation of cells in contact with rECM nor rECM-induced growth inhibition as measured by colony diameter in this in vitro system.
Figure 3.

rECM-induced growth arrest of early passage p53 − HMEC-E6 cells and p53 − HMEC-LXSN controls. The mean diameter of spheres formed by p53+ HMEC-LXSN controls (passage 10) and p53− HMEC-E6 cells (passage 10) were plotted as a function of days in culture. Cells were plated in rECM on day 0 and the diameter of growing spherical cell colonies measured with an eye piece equipped with micrometer spindle. For both p53+ HMEC-LXSN controls and p53− HMEC-E6 cells, the 20 largest colonies were measured at each time point. These data are representative of three separate experiments.
Acute expression of HPV-16 E6 induces apoptosis in rECM-growth arrested HMECs in the absence of p53 expression
EM was performed on early passage rECM growth-arrested p53+ HMEC-LXSN controls and p53− HMEC-E6 cells to test whether suppression of p53 expression by HPV-16 E6 altered the response of HMECs to rECM. p53+ HMEC-LXSN control cells (passage 10) proliferated in contact with rECM until day 6 and then underwent rECM-induced growth arrest on day 6–7.
As observed previously (Seewaldt et al., 1997b), day 7 p53+ HMEC-LXSN cells grown in rECM exhibited an acinus-like structure consistent with normal nonlactating mammary glandular epithelium (Fig. 4 a). There was no evidence of apoptosis. Day 14 p53+ HMEC-LXSN cells likewise did not exhibit evidence of apoptosis (Fig. 4 b).
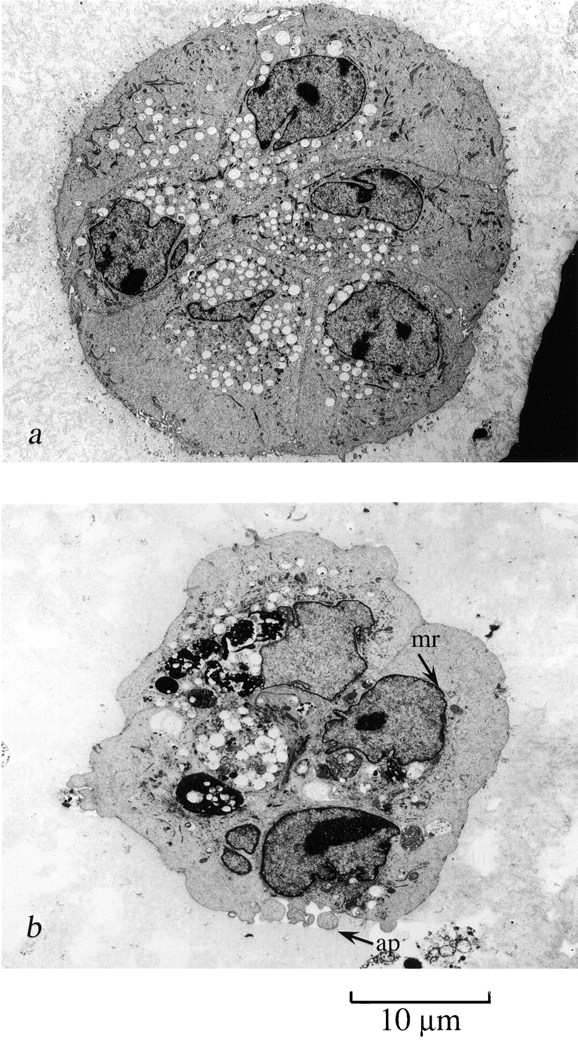
Figure 4.
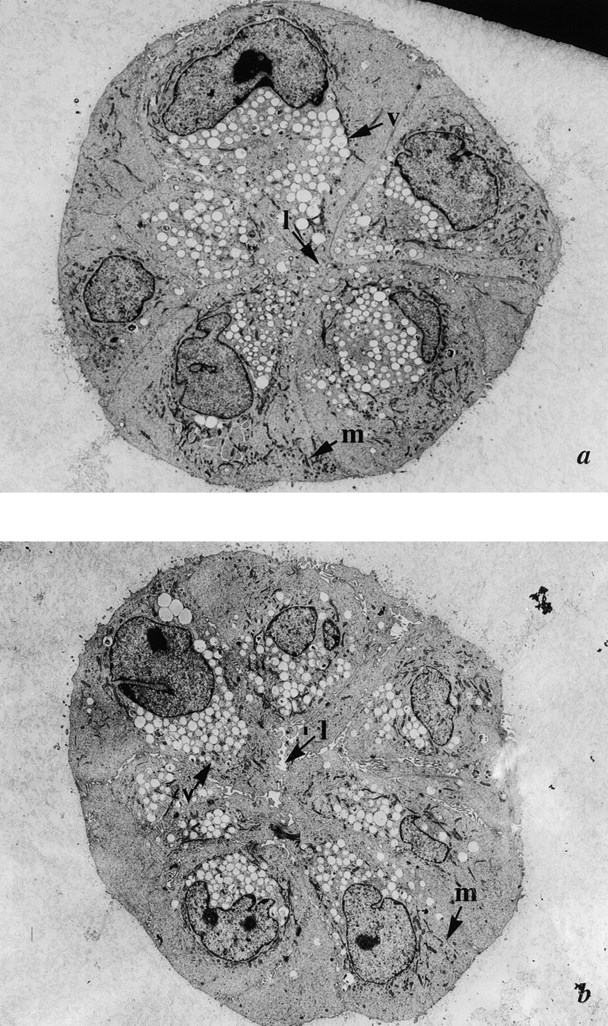
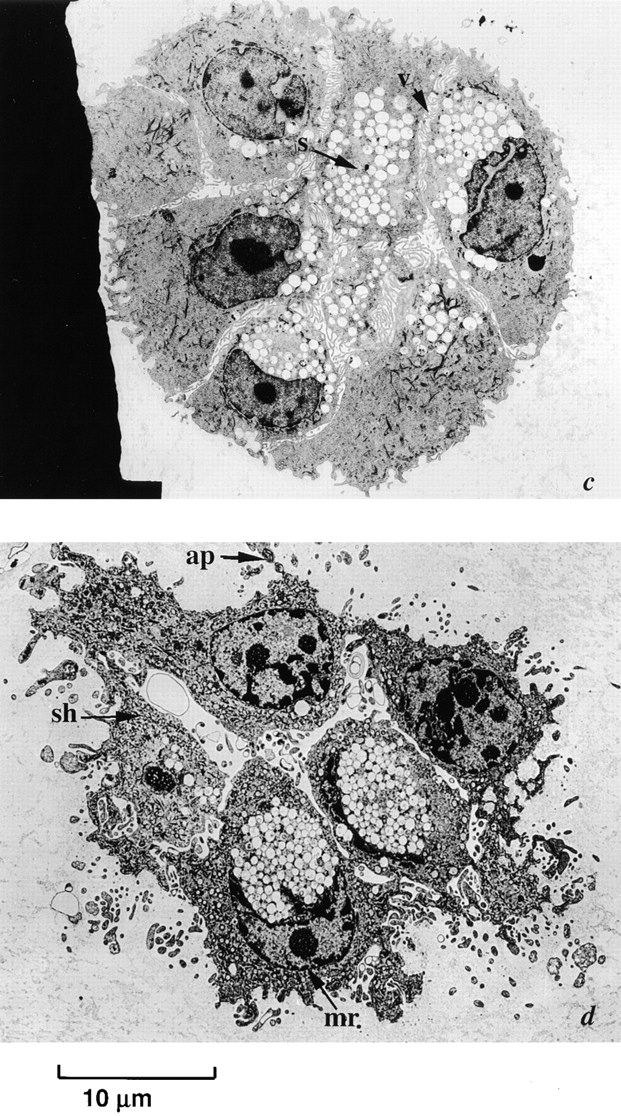
Early passage p53 − HMEC-E6 cells undergo apoptosis when cultured in contact with rECM starting at 7 d. (a and b) Electron micrographs of p53+ HMEC-LXSN vector control cells (passage 10) grown in rECM for 7 (a) and 14 (b) d. p53+ HMEC-LXSN controls formed acini-like structures, which demonstrated a central lumen (l) consistent with nonlactating mammary glandular epithelium: (1) nuclei were aligned predominantly with the basal surface, (2) secretory vesicles (v) were present on the luminal surface and not on the basal surface, and (3) mitochondria (m) were located at the basolateral surface. (c and d) p53− HMEC-E6 cells grown in rECM for 6 (c) and 7 (d) d. At 6 d (c), p53− HMEC-E6 cells are organized around a central lumen, there is cell separation (s), nuclei are primarily oriented at the basal surface, and vesicles (v) are present typically at the luminal surface. At 7 d (d), p53− HMEC-E6 cells demonstrated evidence of apoptosis including (1) nuclear condensation, (2) cell shrinkage (sh) and separation, (3) margination of chromatin (mr), and (4) the presence of apoptotic bodies (ap) containing cytoplasmic elements.
In contrast, early passage p53− HMEC-E6 cells (passage 10) proliferated in rECM until day 6 and then underwent apoptosis on day 7. There was no morphologic evidence of apoptosis in day 6 rECM cultures (Fig. 4 c). On day 7, 100 early passage p53− HMEC-E6 cell clusters were surveyed for the presence or absence of apoptosis. 98 clusters (98%) exhibited morphologic evidence of apoptosis by the following criteria: (a) nuclear condensation, (b) cell shrinkage and separation, (c) margination of chromatin, (d) the presence of apoptotic bodies, and (e) mitochondrial condensation (Fig. 4 d).
A second HMEC strain, AG11134, was tested to ensure that these observations were not HMEC strain specific. Similar to observations made in HMEC strain AG11132 above, (a) AG1134-LXSN controls underwent growth arrest and formed an acinus-like structure in contact with rECM at day 7 (unpublished data), and (b) early passage AG11134-E6 cells exhibited morphologic evidence of apoptosis at day 7 (unpublished data).
The terminal deoxynucleotidyl transferase (TdT) method was also used to detect the presence or absence of apoptotic strand breaks in day 7 rECM culture. The 3′-hydroxyl termini of apoptotic-induced strand breaks were labeled with biotin-dUTP by exogenous TdT and were detected in situ by HRP-conjugated streptavidin. Day 7 rECM growth-arrested early passage p53+ HMEC-LXSN controls (passage 10) did not demonstrate evidence of apoptosis (unpublished data). In contrast, early passage day 7 p53− HMEC-E6–transduced cells (passage 10) grown in contact with rECM exhibited apoptotic strand breaks (unpublished data).
These observations indicate that whereas early passage p53+ HMEC-LXSN controls undergo rECM-induced growth arrest, early passage p53− HMEC-E6 cells undergo rECM-mediated growth arrest on day 6 followed by induction of apoptosis on day 7. Results from this in vitro model of rECM-induced apoptosis in HMECs suggest an association between HPV-16 E6–induced suppression of p53 function and the induction of rECM-mediated apoptosis.
Acute suppression of p53 by an AS approach in HMECs promotes sensitivity to rECM-mediated apoptosis
Since HPV-16 E6 may have effects other than the suppression of p53, an AS approach was used to test whether the acute suppression of p53 function promotes sensitivity to rECM-mediated apoptosis. p53 protein expression was suppressed using a p53 AS ODN in HMECs. Western blot analysis demonstrated almost complete suppression of p53 protein expression in HMECs treated with the p53 AS ODN (p53− HMEC-AS) and no suppression of p53 protein expression in HMECs treated with a scrambled sequence of the p53 AS ODN (p53+ HMEC–scrambled AS [scrAS]) (Fig. 5).
Figure 5.

Expression of p53 protein is suppressed in p53 − HMEC-AS cells. Passage 10 p53+ HMEC-P parental cells (Parental), p53+ HMEC-scrAS controls (scrAS), and p53− HMEC-AS cells (AS) were grown with (+) or without rECM (−) and analyzed for p53 protein expression as described in Materials and methods. Equal amounts of protein lysate were loaded per lane. Hybridization with Abs to actin serves as the loading control.
Consistent with results obtained in early passage p53− HMEC-E6 cells, the acute suppression of p53 function by an AS approach did not alter the ability of p53− HMEC-AS or p53+ HMEC-scrAS controls to proliferate in rECM or to undergo rECM-mediated growth arrest (Fig. 6). Mean diameter of p53+ HMEC-scrAS and p53− HMEC-AS colonies on day 7 was 32 ± 4.0 and 31 ± 5.0 μm, respectively (Fig. 6). These data suggest that the acute suppression of p53 function in HMECs by an AS approach neither alters proliferation of cells in contact with rECM nor does it alter rECM-induced growth inhibition as measured by colony diameter.
Figure 6.

rECM-induced growth arrest of early passage p53 − HMEC-AS cells and p53 + HMEC-scrAS controls. The mean diameter of spheres formed by p53+ HMEC-scrAS controls (passage 10) and p53− HMEC-AS cells (passage 10) are plotted as a function of days in culture. Cells were plated in rECM on day 0, and the diameter of growing spherical cell colonies was measured with an eye piece equipped with micrometer spindle. The 20 largest colonies were measured at each time point. These data are representative of three separate experiments.
We tested whether inhibition of p53 protein expression by an AS approach promoted rECM-mediated apoptosis. On day 7, 100 early passage p53− HMEC-AS cell clusters were surveyed for the presence or absence of apoptosis. Similar to early passage p53− HMEC-E6 cells, p53− HMEC-AS cells underwent apoptosis on day 7 (Fig. 7 b). 90 clusters (90%) exhibited morphologic evidence of apoptosis by the following criteria: (a) nuclear condensation, (b) cell shrinkage and separation, (c) margination of chromatin, (d) the presence of apoptotic bodies, and (e) mitochondrial condensation (Fig. 7 b). In contrast, early passage p53+ HMEC-scrAS cells did not exhibit morphologic evidence of apoptosis on day 7 or 14 (Fig. 7 a; unpublished data). These observations support the hypothesis that the acute suppression of p53 function promotes rECM-mediated apoptosis.
Figure 7.
Early passage p53 − HMEC-AS cells undergo apoptosis when cultured in contact with rECM starting at 7 d. (a) Electron micrographs of p53+ HMEC-scrAS control cells (passage 10) grown in rECM for 14 d. p53+ HMEC-LXSN controls formed acini-like structures. (b) p53− HMEC-AS cells grown in rECM for 7 d demonstrated evidence of apoptosis including (1) nuclear condensation, (2) cell shrinkage and separation, (3) margination of chromatin (mr), and (4) the presence of apoptotic bodies (ap) containing cytoplasmic elements.
Late passage p53− HMEC-E6 cells acquire resistance to rECM-induced growth arrest
Starting at passage 16–18, p53− HMEC-E6 cells acquired resistance to rECM-induced growth arrest as evidenced by continued increase in sphere diameter from day 5 to 9 (Fig. 8). The mean sphere diameter was 37 ± 3 μm at day 7 and 48 ± 5 μm at day 9. In contrast, passage 17 p53+ HMEC-LXSN cells exhibited sensitivity to rECM-induced growth arrest (Fig. 8).
Figure 8.

Late passage p53 − HMEC-E6 cells are resistant to rECM-induced growth arrest. The mean diameter of spheres formed by late passage p53+ HMEC-LXSN controls (passage 17) and p53− HMEC-E6 cells (passage 18) are plotted as a function of days in culture as described in Materials and methods. These data are representative of three separate experiments.
Late passage HMECs with HPV-16 E6-suppressed p53 function exhibit dysregulated growth and are resistant to rECM-induced apoptosis
Late passage p53+ HMEC-LXSN controls (passage 17) and p53− HMEC-E6 cells (passage 18) were cultured in rECM. In contrast to early passage p53− HMEC-E6 cells, late passage cells demonstrated disorganized growth and no evidence of apoptosis at day 7 or 14 (Fig. 9, a and b). Similar to early passage p53+ HMEC-LXSN vector controls, electron micrographs of late passage controls demonstrated a normal acinus-like structure without evidence of apoptosis at day 7 (unpublished data) and 14 (Fig. 9 c). Passage 18 p53− HMEC-E6 cells grown in rECM formed disorganized multilayered irregularly shaped colonies (Fig. 9, a and b). There was no morphologic evidence of apoptosis in passage 18 p53− HMEC-E6 cells grown in rECM. A second HMEC strain AG11134 was tested to confirm that these results were not strain specific. Late passage AG11134-E6 cells were grown in rECM. Similar to late passage p53− HMEC-E6 cells, AG11134-E6 cells formed disorganized aggregates of cells and did not demonstrate evidence of apoptosis (unpublished data). These results suggest that p53− HMEC-E6 cells passaged in vitro acquire resistance to rECM-induced apoptosis.
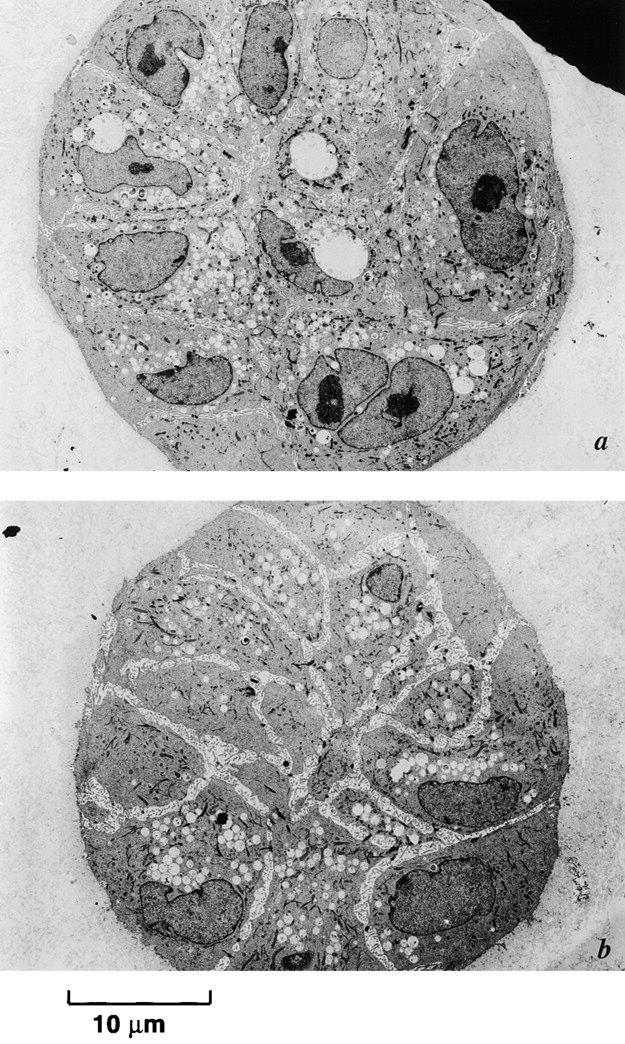
Figure 9.
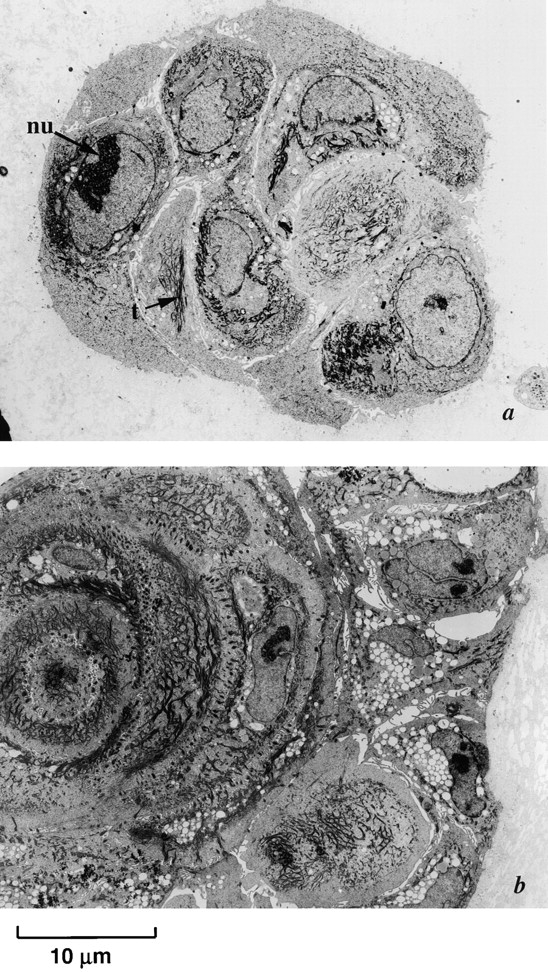
Late passage p53 − HMEC-E6 cells are resistant to rECM-mediated apoptosis. Electron micrographs of late passage p53− HMEC-E6 cells grown in rECM for 7 (a) and 14 (b) d and p53+ HMEC-LXSN controls grown in rECM for 14 d (c). Passage 18 p53− HMEC-E6 cells (a and b) grew in disorganized multilayered irregularly shaped colonies without morphologic evidence of normal cellular polarity or apoptosis. Morphologic evidence of lack of polarity included the following: (1) cells were not organized into spherical single layer structures, (2) a lumen was not present, and (3) secretory vacuoles were distributed randomly throughout the cytoplasm. In addition, cells exhibited a prominent nucleolus (nu) and disorganized tonofilaments (t) consistent with a less differentiated phenotype. In contrast, late passage p53+ HMEC-LXSN vector control cells (passage 17) grown in rECM for 14 d (c) formed acini-like structures.
Late passage p53− HMEC-E6 cells grown in contact with rECM lack polarized expression of E-cadherin
Early and late passage p53+ HMEC-LXSN and early passage p53− HMEC-E6 cells grown in contact with rECM demonstrated basolateral expression of E-cadherin, including lateral staining at cell–cell junctions consistent with a polarized epithelium (Fig. 10, a–c). 20 cell clusters were surveyed per data point. These results are similar to what is observed in normal breast sections and consistent with results obtained by other investigators when mammary epithelial cells are grown in contact with rECM (Weaver et al., 1997; Spancake et al., 1999). In contrast, late passage p53− HMEC-E6 cells exhibited punctate dispersed and intracellular staining consistent with a loss of epithelial polarity (Fig. 10 d). These results are similar to what is observed in tumorigenic mammary epithelial cells that lack epithelial polarity grown in rECM (Weaver et al., 1997).
Figure 10.

Localization of E-cadherin in p53 + HMEC-LXSN and p53 − HMEC-E6 cells using immunofluorescence microscopy. Frozen section of early passage p53+ HMEC-LXSN controls (passage 11) (a), early passage p53− HMEC-E6 cells (passage 11) (b), late passage p53+ HMEC-LXSN controls (passage 16) (c), and late passage p53− HMEC-E6 cells (passage 21) (d) grown in rECM for 6 d, cryosectioned, and stained with a mAb to E-cadherin as described in Materials and methods. E-cadherin was localized at the basolateral surface and at points of cell–cell contact in early and late passage p53+ HMEC-LXSN cells and in early passage p53− HMEC-E6 cells (a–c, arrows). In contrast, late passage p53− HMEC-E6 cells showed punctate dispersed membrane and intracellular staining (d, arrowheads).
Laminin is critical for the induction of apoptosis in early passage p53− HMEC-E6 cells
To identify the component of rECM that promotes apoptosis, early passage p53− HMEC-E6 cells and p53+ HMEC-LXSN controls were cultured in growth factor–depleted Matrigel™, collagen I/IV gels, and collagen I/IV supplemented with laminin. Early passage p53− HMEC-E6 cells underwent apoptosis when cultured for 7 d in growth factor–depleted Matrigel™ (Fig. 11 a), suggesting that depletion of growth factors present in the Matrigel™ are not critical for the induction of apoptosis. Early passage p53+ HMEC-LXSN controls did not undergo apoptosis when cultured in growth factor–depleted Matrigel™ (Fig. 11 b). When early passage p53− HMEC-E6 cells were cultured in the presence of collagen I/IV, there was no evidence of apoptosis after 7 and 14 d (Fig. 11 c; unpublished data). Likewise, early passage p53+ HMEC-LXSN controls did not exhibit evidence of apoptosis when grown in the presence of collagen I/IV (Fig. 11 d). Interestingly, neither early passage p53+ HMEC-LXSN controls nor p53− HMEC-E6 cells formed acinar structures when grown in collage I/IV (Fig. 11, c and d). When human placental laminin was added to the collagen I/IV gel, both early passage p53− HMEC-E6 cells and p53+ HMEC-LXSN vector controls developed branching tubular structures that terminated in spherical aggregates (Fig. 11, e and g). Early passage p53− HMEC-E6 cells present in both branched and aggregate structures exhibited evidence of apoptosis at 7–10 d (Fig. 11 g). By day 14, no cells were visualized by EM (unpublished data). Likewise, early passage p53− HMEC-E6 cells cultured on a laminin-coated substratum in the presence of a 1:1 dilution of standard medium to laminin formed similar three-dimensional branching aggregates that also underwent apoptosis on days 7–10 as determined by EM (unpublished data). In contrast, early passage p53+ HMEC-LXSN controls grown in collagen I/IV supplemented with laminin did not exhibit evidence of apoptosis at 14 d (Fig. 11 h). These observations suggest a critical role for laminin in the induction of apoptosis in p53− HMEC-E6 cells.
Figure 11.
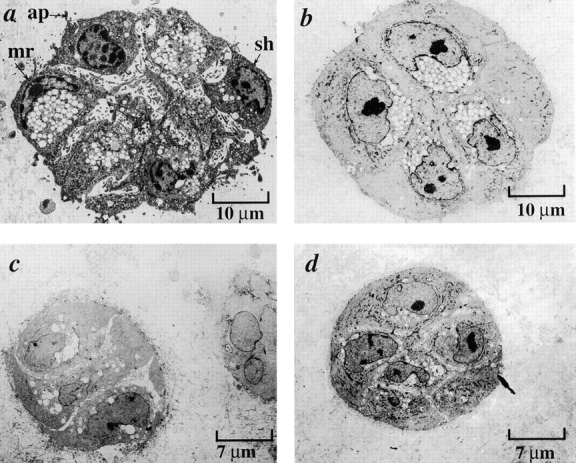
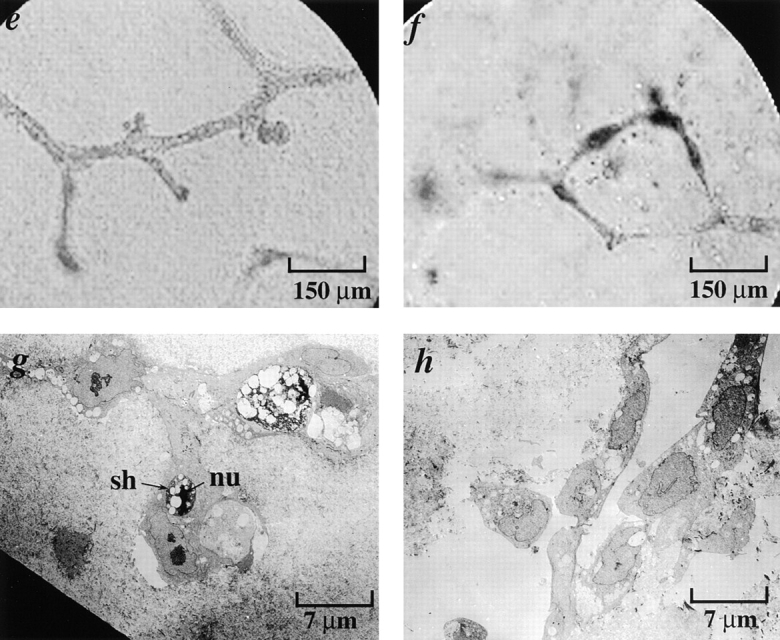
Early passage p53 − HMEC-E6 cells undergo apoptosis when cultured in contact with growth factor–depleted rECM and laminin as evidenced by EM. At 7 d (a), passage 11 p53− HMEC-E6 cells grown in contract with growth factor–depleted rECM demonstrated evidence of apoptosis including the following: (1) nuclear condensation, (2) cell shrinkage (sh) and separation, (3) margination of chromatin (mr), and (4) the presence of apoptotic bodies (ap) containing cytoplasmic elements. In contrast, passage 11 p53+ HMEC-LXSN controls (b) grown in contact with growth factor–depleted rECM did not demonstrate evidence of apoptosis at 14 d. Passage 11 p53− HMEC-E6 cells (c) and passage 11 p53+ HMEC-LXSN controls (d) grown in collagen I/IV for 7 d did not demonstrate evidence of apoptosis by morphologic criteria. Light micrographs of passage 11 p53− HMEC-E6 cells grown in collagen I/IV supplemented with laminin (e) exhibited branching structures that terminated in spherical cell clusters. Electron micrographs of passage 11 p53− HMEC-E6 cells grown in collagen I/IV supplemented with laminin (g) demonstrated morphologic evidence of apoptosis including cell shrinkage (sh) and nuclear condensation (nu) at 7 d. Light micrographs of passage 11 p53+ HMEC-LXSN vector controls grown in collagen supplemented with laminin demonstrated branching structures similar to those exhibited by early passage p53− HMEC-E6 cells (f) but did not demonstrate evidence of apoptosis by EM (h).
α3-integrin expression is altered in rECM-resistant late passage p53− HMEC-E6 cells
Early and late passage p53+ HMEC-LXSN controls and p53− HMEC-E6 cells were tested for α2-, α3-, α6-, β1-, and β4-integrin expression by immunohistochemistry. All early and late passage p53+ HMEC-LXSN controls and early passage p53− HMEC-E6 cells stained positively for α2-, α3-, and β1-integrins and very weakly for α6- and β4-integrins (Fig. 12; unpublished data). Late passage p53− HMEC-E6 cells grown in non-rECM culture exhibited a qualitative decrease in expression of α3-integrin (Fig. 12 d).
Figure 12.
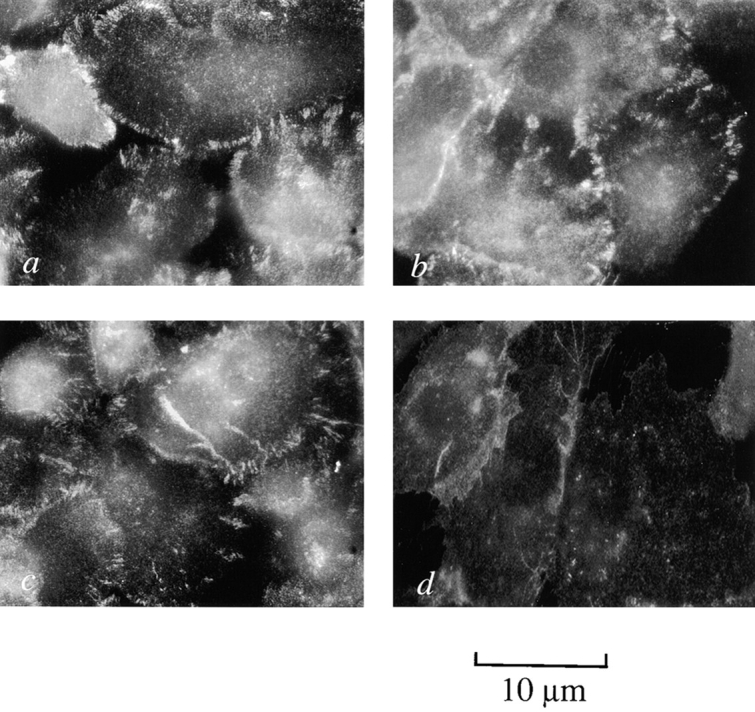
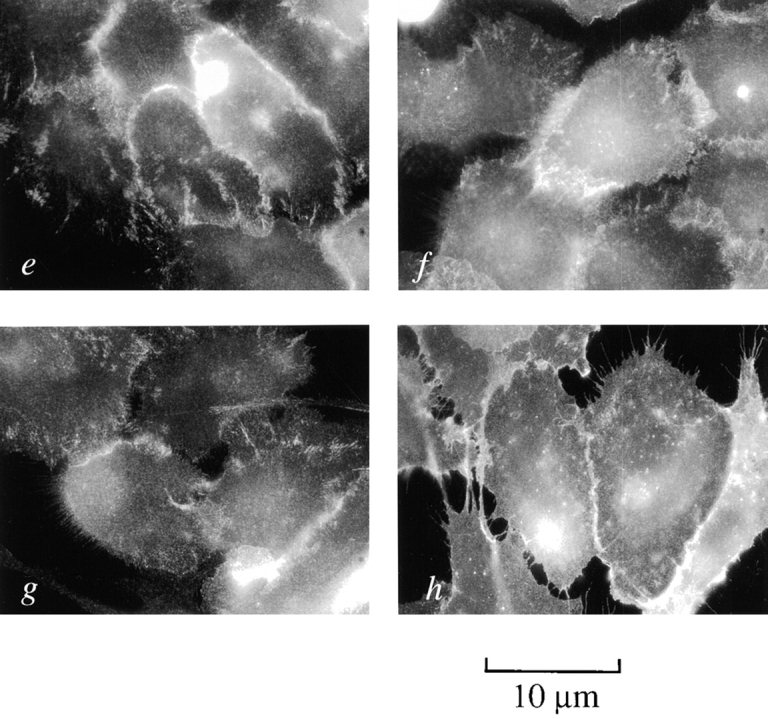
Late passage p53 − HMEC-E6 cells exhibit decreased expression of integrin α3. Early passage p53+ HMEC-LXSN controls (passage 10) (a and e), early passage p53− HMEC-E6 cells (passage 10) (b and f), late passage p53+ HMEC-LXSN controls (passage 18) (c and g) and late passage p53− HMEC-E6 cells (passage 21) (d and h) were grown on glass coverslips for 48 h and then stained by indirect Immunofluorescence with mAb P1F2 against integrin α3 (a–d) or with P4C10 against β1-integrin (e–h).
Early and late passage p53+ HMEC-LXSN controls and p53− HMEC-E6 cells were grown in rECM and tested for α3- and β1-integrin expression by immunohistochemistry (clones P1F2 and P4C10, respectively). Early and late passage p53+ HMEC-LXSN controls and early passage p53− HMEC-E6 cells exhibited polarized basal expression of α3- and β1-integrins (Fig. 13). In contrast, late passage p53− HMEC-E6 cells grown in rECM demonstrated disorganized plasma membrane and cytosolic expression of α3-integrins (Fig. 13 d). Redistribution of α3-integrins has been seen previously by other investigators in association with loss of mammary epithelial cell polarity in rECM culture and is consistent with these findings (Weaver et al., 1997). Late passage p53− HMEC-E6 cells grown in rECM exhibited polarized basal β1-integrin expression but had an increase in the amount of cytosolic expression relative to early passage cells (Fig. 13 h).
Figure 13.


Localization of α3- and β1-integrin expression in p53 + HMEC-LXSN and p53 − HMEC-E6 cells using immunofluorescence microscopy. Frozen section of early passage p53+ HMEC-LXSN controls (passage 11) (a and e), early passage p53− HMEC-E6 cells (passage 11) (b and f), late passage p53+ HMEC-LXSN controls (passage 16) (c and g), and late passage p53− HMEC-E6 cells (passage 21) (d and h) grown in rECM for 6 d, cryosectioned, and stained with monoclonal Abs to α3- (a–d) and β1- (e–h) integrins as described in Materials and methods. Integrins α3 and β1 were localized to the cell-rECM junction in early and late passage p53+ HMEC-LXSN cells and in early passage p53− HMEC-E6 cells (a–c and e–g). In contrast, late passage p53− HMEC-E6 cells demonstrated disorganized membrane and cytosolic staining (d).
α3- and β1-integrin function-altering Abs inhibit ECM-induced growth arrest of early passage p53+ and p53− HMEC-E6 cells
Early passage p53− HMEC-E6 cells (passage 10) were treated with either α3- or β1-integrin function-altering Abs or control mouse nonimmune IgG and grown in prepared rECM as a single cell suspension. As expected, p53+ HMEC-LXSN controls and p53− HMEC-E6 cells treated with nonimmune mouse IgG or β1-integrin–stimulating Ab (clone B3B11) grew exponentially in rECM until day 6 and then growth arrested on day 6–7 (Fig. 14 a; unpublished data), forming a uniform population of spherical colonies. In contrast, p53+ HMEC-LXSN controls and p53− HMEC-E6 cells treated with α3- or β1-integrin blocking Abs (clones P1B5 and JB1A, respectively) did not undergo growth arrest on day 6–7 and continued to proliferate (Fig. 14, b and c). Mean diameter of control p53− HMEC-E6 colonies treated with nonspecific mouse IgG on day 7 and 9 was 30 ± 3 and 27 ± 4 μm, respectively (Fig. 14 a). Mean diameter of p53− HMEC-E6 cells treated with α3- or β1-integrin blocking Abs on day 9 was 51 ± 5 and 52 ± 4 μm, respectively (Fig. 14 c). p53+ HMEC-LXSN controls treated with α3- or β1-integrin blocking Abs demonstrated similar results (Fig. 14 b). These data show that interruption of α3/β1-integrin signaling by a blocking Ab inhibits rECM-mediated growth arrest in both p53+ HMEC-LXSN controls and early passage p53− HMEC-E6.
Figure 14.


Treatment with α3- and β1-integrin function-altering Abs blocks rECM-mediated growth arrest in p53 + and p53 − HMECs. The mean diameter of spheres formed by p53+ HMEC-LXSN controls, passage 10 (a and b) and p53− HMEC-E6 cells, passage 10 (a and c) treated with α3- or β1-integrin function-altering Abs (b and c) or nonimmune mouse IgG (a) is plotted as a function of days in culture. Cells were plated in rECM on day 0, and the diameter of growing spherical cell colonies was measured with an eye piece equipped with micrometer spindle. The 20 largest colonies were measured at each time point. Both early passage (passage 10) p53+ HMEC-LXSN controls and p53− HMEC-E6 transduced cells treated with nonimmune mouse IgG control antiserum proliferated when grown in contact with rECM until day 7 and then underwent growth arrest. In contrast, early passage (passage 10) p53+ HMEC-LXSN and p53− HMEC-E6 cells treated with α3- and β1-integrin function-altering Abs were resistant to rECM-induced growth arrest and continued to proliferate after day 7. These data are representative of three separate experiments.
α3- and β1-integrin function-altering Abs inhibit rECM-mediated apoptosis of early passage p53− HMEC-E6 cells
Early passage p53− HMEC-E6 cells and early passage p53+ HMEC-LXSN controls were treated with either α3- or β1-integrin function-altering Abs or control mouse nonimmune IgG and grown in rECM. Electron micrographs of early passage p53− HMEC-E6 cells and early passage p53+ HMEC-LXSN controls treated with either α3- or β1-integrin blocking Abs (clones P1B5 and JB1A, respectively) demonstrated disorganized cell aggregates without evidence of apoptosis at day 7 or 14 (Fig. 15; unpublished data). Early passage p53− HMEC-E6 cells treated with β1-integrin blocking Abs also exhibited increased cell–cell separation (Fig. 15 b). Control p53− HMEC-E6 cells treated with nonspecific mouse IgG or β1-integrin stimulatory Ab (clone B3B11) underwent apoptosis on day 7 (unpublished data). Control p53+ HMEC-LXSN controls treated with nonspecific mouse IgG did not exhibit apoptosis at day 7 (unpublished data). These results suggest that α3/β1-integrin-mediated signal transduction may be critical for the induction of apoptosis in early passage p53− HMEC-E6 cells grown in contact with rECM.
Figure 15.
Inhibition of α3- and β1-integrin signaling blocks induction of rECM-mediated apoptosis. Electron micrographs of passage 10 p53− HMEC-E6 cells (a and b) and passage 10 p53+ HMEC-LXSN controls (c and d) treated with 10 μg/ml α3- (a and c) or 20 μg/ml β1- (b and d) integrin blocking Abs and then grown in rECM for 7 d. Cells grew in multilayered colonies and did not growth arrest at day 6–7. There was no morphologic evidence of apoptosis. Evidence of lack of polarity included the following: (1) cells are not organized into spherical single layer structures, (2) a lumen was not present, and (3) vacuoles and nuclei were randomly distributed throughout the cytoplasm. Cells treated with β1-integrin blocking Abs exhibited cell–cell separation. There was no evidence of apoptosis.
Discussion
p53 is a critical regulator of cell cycle control, and the high frequency with which p53 is functionally inactivated in human malignancy attests to its key role in preventing the clonal expansion of mutated cells (Hansen and Oren, 1997; Goetz et al., 2001). Although there is extensive experimental evidence demonstrating the importance of p53 as a tumor suppressor and in promoting differentiation, little is known about the fate of normal human cells that acutely lose p53 function in the context of rECM regulatory signals.
Abnormal p53 expression in benign breast tissue is associated with the subsequent development of breast cancer and may represent a very early event in breast carcinogenesis (Fabian et al., 1996; Levesque et al., 1998; Rohan et al., 1998). Interactions between mammary epithelial cells and ECM play a critical role in maintaining normal tissue homeostasis and are likely to be disrupted during breast carcinogenesis. In this report, we describe an in vitro system for investigating interactions between HMECs with suppressed p53 protein expression and rECM as a potential model of early mammary carcinogenesis.
Retrovirally mediated expression of HPV-16 E6 and AS ODNs were used to acutely inhibit p53 protein expression in HMECs (Figs. 1 and 5). The combination of these approaches allowed us to utilize both viral and nonviral methods to suppress p53. We observed that early passage p53+ HMEC control cells underwent rECM-mediated growth arrest on day 6–7 and formed acinus-like structure (Figs. 3, 4, and 10). In contrast, early passage p53− HMEC-E6 cells and early passage p53− HMEC-AS cells proliferated until day 6 (Figs. 3, 4, and 6) and then underwent apoptosis on day 7 as evidenced by EM and by in situ TdT staining (Figs. 4 and 7; unpublished data). These observations suggest that the acute suppression of p53 function in HMECs by HPV-16 E6 and by AS ODNs may promote sensitivity to rECM-induced apoptosis.
ECM has been shown to provide essential signals for mammary epithelial cell survival and in their absence cells undergo apoptosis (Streuli et al., 1991; Strange et al., 1992; Pullan et al., 1996). The critical relationship between ECM signaling and p53 expression is highlighted by a recent report that ECM survival signals transduced by focal adhesion kinase suppress p53-mediated apoptosis (Ilic et al., 1998). However, there is significant evidence that growth arrest, differentiation, and survival signals may also promote apoptosis in genetically damaged cells (Seewaldt et al., 1995; Hong and Sporn, 1997; Mancini et al., 1997; Seewaldt et al., 1997b).
Our observation that the acute suppression of p53 in HMECs promotes sensitivity to apoptosis is consistent with several reports in human and mouse primary fibroblasts that the acute suppression of p53 results in apoptosis sensitivity (Hawkins et al., 1996; Wahl et al., 1996; Lanni et al., 1997). The mechanism by which the acute loss of p53 function might promote apoptosis is unknown. However, we observe that immediately after suppression of p53 by HPV-16 E6, HMECs exhibited a high percentage of tetraploid cells (14%) and an increased sensitivity to apoptosis. The tumor suppressor p53 is a critical component of the spindle checkpoint that ensures the maintenance of diploidy, and an increase in tetraploidy has been observed in cultured fibroblasts from p53-deficient mouse embryo fibroblasts (Cross et al., 1995). We speculate that it is possible that a loss in the spindle checkpoint might promote the induction of apoptosis when early passage p53− HMEC cells are exposed to either survival or growth arrest signals. Alternatively, p53 also plays an important role in differentiation, and therefore lack of p53 might result in cellular disregulation that promotes cell death. We observe that early passage p53− HMECs are sensitive to the induction of apoptosis by other agents that only promote growth arrest in p53+ HMECs at equimolar concentrations. For example, we observed that although tamoxifen promotes G1/S-phase arrest in early passage p53+ HMEC controls, tamoxifen promoted apoptosis in early passage p53− HMECs (Dietze et al., 2001; Seewaldt et al., 2001). Taken together, these observations provide evidence that the acute suppression of p53 might promote the induction of apoptosis when cells are exposed to growth arrest or survival signals.
Although early passage p53 HMEC-E6 cells underwent apoptosis when cultured in rECM, late passage cells were resistant to rECM-induced growth arrest, did not exhibit epithelial polarity, and failed to undergo apoptosis (Fig. 9). Loss of epithelial polarity is based on morphologic appearance by EM and lack of polarized expression of E-cadherin (Figs. 9 and 10). The development of apoptosis resistance correlated with the appearance of complex karyotypic abnormalities. Unlike early passage cells, late passage p53− HMEC-E6 cells continued to proliferate in rECM, formed multilayered aggregates of cells, and subsequently did not undergo apoptosis (Figs. 8 and 9). Based upon observations in our in vitro system, we propose that resistance to rECM-mediated growth arrest and polarity may promote resistance to apoptosis.
We investigated which component of rECM may be proapoptotic. Early passage p53− HMEC-E6 cells grown in collagen did not form acinar structures and did not undergo apoptosis (Fig. 11). Based on these observations, we speculate that the presence of collagen I/IV in a 1:1 ratio in our model system is not sufficient to induce apoptosis nor promote an acinar structure. When laminin was added to collagen I/IV gels, early passage p53− HMEC-E6 cells formed organized branched tubular structures that terminated in spherical cell clusters and underwent apoptosis (Fig. 11). Early passage p53− HMEC-E6 cells cultured in laminin suspension, in the absence of a plastic substratum for adhesion, formed similar three dimensional structures and likewise underwent apoptosis. This suggests that contact with laminin is critical for the induction of apoptosis in early passage p53− HMEC-E6 cells.
Integrin α3β1 is a critical mediator of intracellular adhesion and an important receptor for laminin-5 (Xia et al., 1996; Kawano et al., 2001). Recently, α3/β1-integrin has been shown to play a potential role in the initiation apoptosis in T cells (Sato et al., 1999). Resistance to rECM-mediated apoptosis in late passage p53− HMEC-E6 cells was associated with altered expression of α3-integrin (Figs. 12 and 13). Redistribution of α3-integrin has been seen previously by other investigators in association with loss of mammary epithelial cell polarity in rECM culture and is consistent with our findings (Weaver et al., 1997). Treatment of early passage p53− HMEC-E6 cells with α3- and β1-integrin function-altering Abs blocked rECM-mediated growth arrest and inhibited the induction of apoptosis (Figs. 14 and 15). Taken together, these observations suggest an important role for α3/β1 signaling in rECM-mediated growth regulation and apoptosis.
Previous investigators have tested the ability of α3- and β1-integrin blocking Abs to mediate growth of breast cell lines in rECM and in collagen and fibrin gels (Howlett et al., 1995; Alford et al., 1998). HMT-3522, a nontumorigeneic breast cell line, demonstrated decreased proliferation in rECM culture when treated with either the inhibitory anti–α3-integrin Ab P1B5 or anti–β1-integrin Ab AIIB2 (Howlett et al., 1995). In contrast, we observed dysregulated proliferation when we treated HMECs with either the inhibitory anti–α3-integrin Ab P1B5 or anti–β1-integrin Ab JB1A. The induction of stimulatory or inhibitory functions by Abs directed to defined integrin subunits has been observed previously for both anti–β1- and anti–α3-integrin Abs (Lenter et al., 1993; Driessens et al., 1995; Lichtner et al., 1998) and is felt to be highly cell type specific. We hypothesize that utilization of nonimmortalized cells with low levels of α6β4-integrin expression may account for differences between our results and those obtained by Howlett et al. (1995).
In conclusion, we have shown that whereas p53+ HMEC-LXSN cells undergo growth arrest and form polarized epithelium when grown in contact with rECM, p53− HMEC-E6 and p53− HMEC-AS cells that have acutely lost p53 function undergo apoptosis. Resistance to rECM-mediated growth arrest and polarity results in resistance to rECM-mediated apoptosis and is associated with altered expression of α3-integrin. Treatment of apoptosis-sensitive early passage p53− HMEC-E6 cells with either α3- or β1-integrin function-altering Abs results in loss of rECM-mediated growth arrest and resistance to rECM-mediated apoptosis. We suggest that sensitivity and resistance to rECM-mediated apoptosis in p53− HMECs is dependent on the ability to form a polarized epithelium and may require α3/β1-integrin signaling.
Materials and methods
Cell culture and media
HMEC strains AG11132 and AG11134 (M. Stampfer, Lawrence Berkeley National Laboratory, Berkeley, CA) were purchased from the National Institute of Aging, Cell Culture Repository (Stampfer, 1985). HMEC strains AG11132 and AG11134 were established from normal tissue obtained at reduction mammoplasty, have a limited life span in culture, and fail to divide after ∼20–25 passages. AG11132 and AG11134 cells exhibit a low level of estrogen receptor staining characteristic of normal mammary cells. AG11132 and AG11134 were at passage 8 at the time of receipt. HMECs were grown in standard medium: mammary epithelial cell basal medium (Clonetics) supplemented with 4 mg/ml bovine pituitary extract (CC4009; Clonetics), 5 mg/ml insulin (Upstate Biotechnology), 10 ng/ml EGF (Upstate Biotechnology), 0.5 mg/ml hydrocortisone (Sigma-Aldrich), 10−5 M isoproterenol (Sigma-Aldrich), and 10 mM Hepes buffer (Sigma-Aldrich). G418 (GIBCO BRL) containing standard medium was prepared by the addition of 300 mg/ml of G418 to standard medium. Cells were cultured at 37°C in a humidified incubator with 5% CO2/95% air. Mycoplasma testing was performed as reported previously (Seewaldt et al., 1997a).
Retroviral transduction
The LXSN16E6 retroviral vector containing the HPV-16 E6 coding sequence (provided by D. Galloway, Fred Hutchinson Cancer Research Center, Seattle, WA) has been described previously (Halbert et al., 1991; Demers et al., 1994). HMECs (passage 9) were plated in four T-75 tissue culture flasks (Corning) in standard medium and grown to 50% confluency. Transducing virions from either the PA317-LXSN16E6 or the control PA317-LXSN (without insert) retroviral producer line were added at a multiplicity of infection of 1:1 in the presence of 4 μg/ml polybrene (Sigma-Aldrich) to log-phase cells grown in T-75 flasks. The two remaining T-75 flasks were not infected with virus. After 48 h, the two flasks containing transduced cells and one flask with untransduced cells were passaged 1:3 (passage 10) and selected with standard medium containing 300 μg/ml G418. Cells were grown in G418 containing standard medium for 1 wk until 100% of control untransduced cells were dead. The transduction efficiency was high during selection, cells were passaged 1:3 at the completion of selection (passage 11), and cells were maintained in the absence of selection before immediately proceeding to apoptosis experiments. The fourth flask of unselected untransduced parental control cells was passaged in parallel with the selected transduced experimental and vector control cells. Parental AG11132 cells were designated HMEC-P, transduced cells expressing the HPV-16E6 construct were designated p53− HMEC-E6, and vector control clones were designated p53+ HMEC-LXSN. All cells were maintained in standard medium after transfection in the absence of G418 selection to ensure that any chromosomal abnormalities or apoptosis resistance observed was not due to continued exposure to G418. All experiments were performed on mass cultures.
p53 oligonucleotides
The p53 AS oligonucleotide is an 18-mer targeting the region of the initiation codon (six base pairs immediately before the first and the first four coding codons): 5′-CGGCTCCTCCATGGCAGT-3′. This AS ODN has been used previously by several investigators to suppress p53 function (Bi et al., 1994; Capoulade et al., 2001). The p53 control ODN (5′-CGGCTCCTCATGGCAGT-3′) was chosen to be a scrambled sequence of the AS ODN to ensure identical nucleotide content and minimize differences potentially attributable to nucleic acid content (Capoulade et al., 2001). In all ODNs, the first and the last three nucleotides were phosphorothiolate modified to increase stability in vitro.
Early passage p53+ HMEC-P parental cells were plated in T-75 plates in standard medium. After allowing 24 h for attachment, cell cultures were treated for 72 h with either 0.1 μM active or scrAS p53 ODNs. The culture medium was replaced by new standard medium containing fresh ODNs every 24 h. Western blot analysis was performed to confirm suppression of p53 expression as described below. The resulting film images were digitized and quantitated using Eastman Kodak, Co. 1D image analysis software.
rECM culture was as follows: cells were trypsinized, and ∼104 cells were resuspended in 100 μl rECM containing 0.1 μM of either active or p53 scrAS ODN on ice. rECM cultures were prepared as described below. rECM cultures were overlayed with standard medium containing 0.1 μM of either active or scrambled p53 ODNs. Overlay medium was changed every 24 h to ensure a fresh supply of ODNs. The diameter of the growing colonies was determined, and cell colonies were prepared for EM as described below. To measure p53 protein expression in cells grown in rECM culture, colonies were released from the matrix by 60-min incubation at 37°C with dispase (5,000 U/ml caseinolytic activity; Collaborative Research). Released cells were washed once using ice-cold PBS with 5 mM EDTA and twice with PBS alone. The resulting pellet was tested for p53 protein expression by Western blot analysis as described below.
Western blotting
Preparation of cellular lysates and immunoblotting were performed as previously described (Seewaldt et al., 1995, 1997b). p53 expression was detected using a 1:100 dilution of mouse anti–human p53 Ab-2 (Oncogene Research Products) and detected by ECL Western blotting detection reagents (Amersham Pharmacia Biotech) as described by the manufacturer.
Northern blot analysis
RNA was extracted with guanidium isothiocyanate and subjected to Northern blotting in formaldehyde denaturing gels as described previously (Seewaldt et al., 1995). 10 mg of RNA were loaded per lane. Molecular probes used in the Northern blot analysis were as follows: the human p53 probe was a 1.9-kb BamH1 fragment (Seewaldt et al., 1997b), and the 36B4 probe was a 700-bp PstI fragment that was used as a loading and transfer control probe (Seewaldt et al., 1995).
HMEC culture in reconstituted ECM
Mammary epithelial cells were grown in rECM by methods developed by Bissell and others (Folkman and Moscona, 1978; Howlett et al., 1994; Roskelley et al., 1994; Seewaldt et al., 1997b). 100 μl of rECM (Matrigel™; Collaborative Research) or growth factor–depleted rECM (growth factor–reduced Matrigel™; Collaborative Research) were added per well to a 48-well plate and allowed to gel at 37°C for 20 min. p53− HMEC-E6–transduced cells and p53+ HMEC-LXSN vector controls were trypsinized, counted, and pelleted in a sterile microcentrifuge tube. Approximately 104 cells were resuspended in 100 μl rECM on ice, gently overlaid on the initial undercoating of ECM, and allowed to gel at 37°C for 20 min. Standard medium was then added, and wells were inspected to ensure an equal distribution of cells in each well. Cells were grown for 5–14 d in culture. Medium was changed daily.
For integrin-blocking experiments, ∼104 p53+ HMEC-LXSN vector control cells (passage 11) or p53− HMEC-E6 cells (passage 10) were pelleted and resuspended in 100 μl standard medium containing either Abs to α3- and β1-integrins (Chemicon International) or control nonimmune mouse IgG for 15 min at room temperature (RT). Final concentration of α3-integrin blocking Ab (CDW496, clone P1B5) was 10 μg/ml, β1-integrin blocking Ab (CD29, clone JB1A) was 20 μg/ml, and β1-integrin stimulatory Ab (CD29, clone B3B11) was 10 μg/ml. 100 μl rECM was added to the cell suspension, gently mixed, and overlaid as described above. 1 ml standard medium containing the above respective concentration of blocking Ab was added to each well and changed every other day. Cells were grown for 5–9 d in rECM culture.
Collagen/laminin morphogenesis assays
Collagen and collagen/laminin gels were prepared by a modification of methods developed by Alford et al. (1998). Collagen type I (Sigma-Aldrich) and human placental collagen type IV (Sigma-Aldrich) were solubilized in 0.018 N acetic acid for a final concentration of 3 mg/ml each. Three parts collagen type I were mixed with one part collagen type IV. The collagen I/IV solution was neutralized by mixing 8 vol of collagen solution with 1 vol of sterile PBS and 1 vol of sterile 0.1 M NaOH for a final pH of 7.4. 100 μl of neutralized collagen I/IV solution were added per well to a 48-well plate and allowed to gel at 37°C for 20 min. Approximately 104 early passage p53− HMEC-E6 cells and p53+ HMEC-LXSN controls were resuspended in 100 μl neutralized collagen I/IV solution on ice, gently overlaid on the initial undercoating of collagen, and allowed to gel at 37°C for 20 min. Standard medium was then added, and wells were inspected to ensure an equal distribution of single cells suspended in each well. Cells were grown for 5–9 d in culture and then prepared for EM as described previously (Seewaldt et al., 1997b). For collagen/laminin gels, nine parts collagen I/IV were added to one part human placental laminin (Sigma-Aldrich), and gels were prepared as above. Laminin cultures were prepared as follows: 48-well plates were coated with 100 μl neutralized collagen I/IV solution and baked at 65°C for 24 h. This was repeated three times. 100 μl of human placental laminin were added per well and baked at 50°C until the laminin solution hardened. This was repeated three times. Approximately 104 early passage p53− HMEC-E6 cells were suspended in a 1:1 mixture of standard medium and human placental laminin. Cells were grown for 7 d and prepared for EM as previously described (Seewaldt et al., 1997b).
Transmission EM
p53− HMEC-E6 cells and p53+ HMEC-LXSN vector control cells were grown in contact with rECM as described above, and EM was preformed as described previously (Seewaldt et al., 1997b).
Cell growth determination in rECM culture
Cell growth was determined by the following criteria: the size of growing spherical cell colonies was measured with an eye piece equipped with a micrometer spindle. For both p53+ HMEC-LXSN vector controls and p53− HMEC-E6–transduced cells, the 20 largest colonies were measured.
Detection of apoptosis by in situ TUNEL
p53− HMEC-E6 cells and p53+ HMEC-LXSN vector control cells were grown in contact with rECM as described above for 5–9 d. Cells were then fixed in PBS with 10% formalin and embedded in paraffin. Sections were deparaffinized and quenched in methanol containing 2.1% hydrogen peroxide. Antigen retrieval was achieved by placing slides in 10 mM citric acid at 95°C for 10 min. Nuclear proteins were stripped with 20 μg/ml proteinase K, and slides were washed in deionized water. Positive controls were immersed in DN buffer (30 mM Tris, pH 7.2, 140 mM sodium cacodylate, 4 mM magnesium chloride, 0.1 mM DTT) for 5 min at RT and then incubated with DNAseI (Roche) in DN buffer for 10 min at RT. Negative controls were treated with 5% FBS. All samples were immersed in TdT buffer (30 mM Tris, pH 7.2, 140 mM sodium cacodylate, 1.0 mM cobalt chloride) for 5 min at RT. Sections were covered with TdT/Bio-14-dATP solution (800 μl TdT buffer containing 120 U terminal transferase and 50 nM Bio-14-dATP [GIBCO BRL]), incubated for 1 h at RT, and then the reaction was terminated with PBS. Sections were blocked with 2% BSA for 10 min at RT and treated with ABC solution (Elite). Sections were allowed to complex on ice for 30 min, incubated for 30 min at 37°C, and were washed in PBS. Sections were stained with DAB (2% nickel chloride, 0.1% hydrogen peroxide) for 3 min at RT and counterstained.
E-cadherin immunostaining
Early and late passage p53− HMEC-E6 cells and p53+ HMEC-LXSN vector control cells were grown in rECM as described for 6 d and embedded in OCT (Miles). Cells were snap frozen, and 5-μm sections were obtained. Sections were fixed in for 30 min at RT with 3.7% formaldehyde in PBS and were blocked with 0.5% heat-denatured BSA (HD-BSA) in PBS for 1 h at RT. Cells were then incubated for 30 min with mouse anti–human E-cadherin Ab (BD Signal Transduction Laboratories), diluted in PBS with 0.5% HD-BSA for 30 min at RT, and then washed six times with PBS at RT. For Immunofluorescence, cells were incubated with FITC-conjugated goat anti–mouse Ab at a 1:200 Ab dilution (Santa Cruz Biotechnology, Inc.) in PBS with 0.5% HD-BSA for 30 min at RT and washed. Sections were mounted in 30% glycerol in PBS and visualized for immunofluorescence using a ZEISS LSM 410 fluorescence microscope.
Immunodetection of integrin expression
Early and late passage p53− HMEC-E6 cells and p53+ HMEC-LXSN vector control cells were grown on glass coverslips for 48 h in standard medium. Cells were fixed in for 20 min at RT with 2% formaldehyde in 0.1 M sodium cacodylate and 0.1 M sucrose at pH 7.2, permeabilized with 0.1% Triton X-100 for 10 min at RT, and blocked with 0.5% HD-BSA in PBS for 1 h at RT. Cells were then incubated with a primary Ab diluted in PBS with 0.5% HD-BSA for 1 h at RT and washed six times with PBS at RT. Abs against integrin subunits α2 (P1H5), α3 (P1F2, P1B5), and β1 (P4C10) were a gift from William Carter (Fred Hutchinson Cancer Research Center) and have been described previously (Wayner and Carter, 1987; Wayner et al., 1988; Carter et al., 1990a,b). Abs against integrin α6 (GoH3) and β4 (3E1) were obtained from Chemicon International. For Immunofluorescence, cells were incubated with either FITC-conjugated goat anti–mouse Ab at a 1:1,500 dilution or goat anti–rat Ab at a 1:4,000 dilution (Dako) in PBS with 0.5% HD-BSA for 1 h at RT and washed. Sections were mounted in a solution containing 25 mg/ml of 1,4-diazobicyclo-(2,2,2)octane in glycerol and visualized for immunofluorescence using a ZEISS LSM 410 fluorescence microscope.
For rECM culture, early and late passage p53− HMEC-E6 cells and p53+ HMEC-LXSN vector control cells were grown in contact with rECM for 6 d in standard medium. Cells were embedded in OCT, snap frozen, and sectioned as described above. Sections were fixed in for 20 min at RT with 2% formaldehyde in 0.1 M sodium cacodylate, 0.1 M sucrose, pH 7.2, and blocked with 0.5% HD-BSA in PBS for 1 h at RT. Sections were stained with Abs against integrin subunits α3 (P1F2) and β1 (P4C10) and visualized as described above.
Cytogenetic analysis of early passage transduced and parental HMECs
Cultures of p53+ HMEC-P parental cells (passage 10), p53+ HMEC-LXSN vector controls (passage 10), p53− HMEC-E6 cells (passage 10), and p53− HMEC-E6 cells (passage 18) were checked for sufficient numbers of dividing cells and exposed to colcemid (GIBCO BRL) at a final concentration of 0.01–0.02 μg/ml for 2–3 h. Subsequently, the cells were released from flasks by trypsinization, exposed to hypotonic solution, and fixed as described previously (Mrózek et al., 1993). Chromosome preparations were made, and after appropriate aging slides were subjected to SKY, a method that enables simultaneous display of all human chromosomes in different colors (Schröck et al., 1996). Additional slides were also stained with DAPI (Vector Laboratories) alone. For SKY, the slides were hybridized with the SKY probe mixture containing combinatorially labeled painting probes for each of the autosomes and sex chromosomes (Applied Spectral Imaging) for 42–45 h at 37°C. The hybridization and detection procedures were performed according to the manufacturer's protocol (Applied Spectral Imaging), and chromosomes were counterstained with DAPI in antifade solution. The multicolor hybridizations were visualized with the SpectraCube SD 200 system (Applied Spectral Imaging) mounted on the ZEISS Axioplan 2 epifluorescence microscope using a custom-designed optical filter (SKY-1; Chroma Technology). The DAPI images of all metaphase cells were acquired using a DAPI-specific optical filter. Spectral analysis and classification were performed using SkyView 1.2r visualization and analysis software (Applied Spectral Imaging). The assignment of breakpoints in structural abnormalities was made on comparison of images of SKY classified chromosomes with the images of the same chromosomes stained with DAPI that were inverted electronically and contrast enhanced by SkyView 1.2r software. Karyotypic abnormalities were classified according to the recommendations of the International System for Human Cytogenetic Nomenclature (Mitelman, 1995).
Acknowledgments
The authors are indebted to Judy Goombridge and Franque Remington for the preparation of EM specimens. We gratefully acknowledge William Carter for the gift of integrin-specific Abs. The authors wish to thank Mr. and Mrs. Jack and Marcia Slane for the generous gift of the ZEISS LSM 410 fluorescence microscope to the Duke University Comprehensive Cancer Center.
This work is supported by National Institutes of Health/National Cancer Institute grants R01CA88799 (to V.L. Seewaldt), 2P30CA14236-26 (to V.L. Seewaldt), and 5P30CA16058 (to K. Mrózek), National Institutes of Health/National Institute of Diabetes and Digestive Kidney Diseases grant 2P30DK 35816-11 (to V.L. Seewaldt), American Cancer Society award CCE-99898 (to V.L. Seewaldt), a Charlotte Geyer award (to V.L. Seewaldt), a V-Foundation award (to V.L. Seewaldt), and a Susan G. Komen Breast Cancer award (to V.L. Seewaldt).
Footnotes
Abbreviations used in this paper: AS, antisense; ECM, extracellular matrix; HMEC, human mammary epithelial cells; HPV-16, human papillomavirus type 16; rECM, reconstituted ECM; RT, room temperature; SKY, spectral karyotyping; ODN, oligodeoxynucleotide; scrAS, scrambled AS; TdT, terminal deoxynucleotidyl transferase.
References
- Alford, D., D. Baeckström, M. Geyp, P. Pitha, and J. Taylor-Papadimitriou. 1998. Integrin-matrix interactions affect the form of the structures developing from human mammary epithelial cells in collagen or fibrin gels. J. Cell Sci. 111:521–532. [DOI] [PubMed] [Google Scholar]
- Ashkenazi, A., and V.M. Dixit. 1998. Death receptors: signaling and modulation. Science. 281:1305–1308. [DOI] [PubMed] [Google Scholar]
- Bi, S., F. Lanza, and J.M. Goldman. 1994. The involvement of “tumor suppressor” p53 in normal and chronic myelogenous leukemia hemopoiesis. Cancer Res. 54:582–586. [PubMed] [Google Scholar]
- Capoulade, C., L.M. Mir, K. Carlier, Y. Lecuse, C. Tetaud, Z. Mishal, and J. Wiels. 2001. Apoptosis of tumoral and nontumoral lymphoid cells is induced by both mdm2 and p53 antisense oligodeoxynuclotides. Blood. 97:1043–1049. [DOI] [PubMed] [Google Scholar]
- Carter, W.G., P. Kaur, S.G. Gil, P.J. Gahr, and E.A. Wayner. 1990. a. Distinct functions for integrins α3β1 in focal adhesions and α6β4/bullous pemphigoid antigen in a new stable anchoring contact (SAC) of keratinocytes: relation to hemidesmosomes. J. Cell Biol. 111:3141–3154. [DOI] [PMC free article] [PubMed] [Google Scholar]
- Carter, W.G., E.A. Wayner, T.S. Bouchard, and P. Kaur. 1990. b. The role of integrins α2β1 and α3β1 in cell–cell and cell–substrate adhesion of human epidermal cells. J. Cell Biol. 110:1387–1404. [DOI] [PMC free article] [PubMed] [Google Scholar]
- Cross, S.M., C.A. Sanchez, C.A. Morgan, M.K. Schimke, S. Ramel, R.L. Idzerda, W.H. Raskin, and B.J. Reid. 1995. A p53-dependent mouse spindle checkpoint. Science. 267:1353–1356. [DOI] [PubMed] [Google Scholar]
- Demers, G.W., S.A. Foster, C.L. Halbert, and D.A. Galloway. 1994. Growth arrest by induction of p53 in DNA damaged keratinocytes is bypassed by human papillomavirus 16 E7. Proc. Natl. Acad. Sci. USA. 91:4382–4386. [DOI] [PMC free article] [PubMed] [Google Scholar]
- Demers, G.W., E. Espling, J.B. Harry, B.G. Etscheid, and D.A. Galloway. 1996. Abrogation of growth arrest signals by human papillomavirus type 16 E7 is mediated by sequences required for transformation. J. Virol. 70:6862–6869. [DOI] [PMC free article] [PubMed] [Google Scholar]
- Dietze, E.C., L.E. Caldwell, S.L. Grupin, M. Mancini, and V.L. Seewaldt. 2001. Tamoxifen but not 4-hydroxytamoxifen initiates apoptosis in p53(-) normal human mammary epithelial cells by inducing mitochondrial depolarization. J. Biol. Chem. 276:5384–5394. [DOI] [PubMed] [Google Scholar]
- DiPersio, C.M., S. Shah, and R.O. Hynes. 1995. α3β1 integrin localizes to focal contacts in response to diverse extracellular matrix proteins. J. Cell. Sci. 108:2321–2336. [DOI] [PubMed] [Google Scholar]
- DiPersio, C.M., K.M. Hodivala-Dilke, R. Jaenisch, J.A. Kreidberg, and R.O. Hynes. 1997. α3/β1 integrin is required for normal development of the epidermal basement membrane. J. Cell Biol. 137:729–742. [DOI] [PMC free article] [PubMed] [Google Scholar]
- Driessens, M.H.E., E.A.M. van Rijthoven, H. Kemperman, and E. Roos. 1995. Adhesion of lymphoma cells to fibronectin: differential use of α4β1 and α5β1 integrins and stimulation by the 9EG7 mAb against the murine β1 integrin subunit. Cell Adhes. Commun. 3:327–336. [DOI] [PubMed] [Google Scholar]
- Evan, G., and T. Littlewood. 1998. A matter of life and cell death. Science. 281:1317–1322. [DOI] [PubMed] [Google Scholar]
- Fabian, C.J., S. Kamel, C. Zalles, and B.F. Kimler. 1996. Identification of a chemoprevention cohort from a population of women at high risk for breast cancer. J. Cell. Biochem. Suppl. 25:112–122. [PubMed] [Google Scholar]
- Folkman, J., and A. Moscona. 1978. Role of cell shape in growth control. Nature. 273:345–349. [DOI] [PubMed] [Google Scholar]
- Glukhova, M., V. Koteliansky, X. Sastre, and J.-P. Thiery. 1995. Adhesion systems in normal breast and in invasive breast carcinoma. Am. J. Pathol. 146:706–716. [PMC free article] [PubMed] [Google Scholar]
- Goetz, F., Y.J. Tzent, E. Guhl, J. Merker, M. Graessmann, and A. Grassemann. 2001. The SV40 small t-antigen prevents mammary gland differentiation and induces breast cancer formation in transgenic mice; truncated large T-antigen molecules harboring the intact p53 and pRb binding region do not have this effect. Oncogene. 20:2325–2350. [DOI] [PubMed] [Google Scholar]
- Grenz, H., S. Carbonetto, and S.L. Goodman. 1993. α3/β1 integrin is moved into focal contacts in kidney mesangial cells. J. Cell Sci. 105:739–751. [DOI] [PubMed] [Google Scholar]
- Halbert, C.L., D.W. Demers, and D.A. Galloway. 1991. The E7 gene of human papillomavirus type 16 is sufficient for immortalization of human epithelial cells. J. Virol. 65:473–478. [DOI] [PMC free article] [PubMed] [Google Scholar]
- Hansen, R., and M. Oren. 1997. p53: from inductive signal to cellular effects. Curr. Opin. Genet. Dev. 7:46–51. [DOI] [PubMed] [Google Scholar]
- Hawkins, D.S., G.W. Demers, and D.A. Galloway. 1996. Inactivation of p53 enhances sensitivity to multiple chemotherapeutic agents. Cancer Res. 56:892–898. [PubMed] [Google Scholar]
- Hong, W.K., and M.B. Sporn. 1997. Recent advances in chemoprevention of cancer. Science. 278:1073–1077. [DOI] [PubMed] [Google Scholar]
- Howlett, A.R., O.W. Petersen, P.S. Steeg, and M.J. Bissell. 1994. A novel function for the nm23-H1 gene: overexpression in human breast carcinoma cells leads to the formation of basement membrane and growth arrest. J. Natl. Cancer Inst. 86:1838–1844. [DOI] [PMC free article] [PubMed] [Google Scholar]
- Howlett, A.R., N. Bailey, C. Damsky, O.W. Petersen, and M.J. Bissell. 1995. Cellular growth and survival are mediated by β1 integrins in normal human breast epithelium but not in breast carcinoma. J. Cell. Sci. 108:1945–1957. [DOI] [PubMed] [Google Scholar]
- Hynes, R.O. 1992. Integrins: versatility, modulation, and signaling in cell adhesion. Cell. 69:11–25. [DOI] [PubMed] [Google Scholar]
- Ilic, D., E.A.C. Almeida, D.D. Schlaepfer, P. Dazin, S. Aizawa, and C.H. Damsky. 1998. Extracellular matrix survival signals transduced by focal adhesion kinase suppress p53-mediated apoptosis. J. Cell Biol. 143:547–560. [DOI] [PMC free article] [PubMed] [Google Scholar]
- Kawano, K., S.S. Kantak, M. Murai, C.-C. Yao, and R.H. Kramer. 2001. Integrin α3β1 engagement disrupts intracellular adhesion. Exp. Cell Res. 262:180–196. [DOI] [PubMed] [Google Scholar]
- Koukoulis, G.K., I. Virtanen, M. Korhonen, L. Laitinen, V. Quaranta, and V.E. Gould. 1991. Immunohistochemical localization of integrins in the normal, hyperplastic, and neoplastic breast. Correlations with their functions as receptors and cell adhesion molecules. Am. J. Pathol. 139:787–799. [PMC free article] [PubMed] [Google Scholar]
- Lanni, J.S., S.W. Lowe, E.J. Licitra, J.O. Liu, and T. Jacks. 1997. p53-independent apoptosis induced by pacitaxel through an indirect mechanism. Proc. Natl. Acad. Sci. USA. 94:9679–9683. [DOI] [PMC free article] [PubMed] [Google Scholar]
- Lenter, M., H. Uhlig, A. Hamann, P. Jenö, B. Imhof, and D. Vestweber. 1993. A monoclonal antibody against an activation epitope on mouse integrin chain β1 blocks adhesion of lymphocytes to the endothelial integrin α6β1. Proc. Natl. Acad. Sci. USA. 90:9051–9055. [DOI] [PMC free article] [PubMed] [Google Scholar]
- Levesque, M.A., H. Yu, G.M. Clark, and E.P. Diamandis. 1998. Enzyme-linked immunoabsorbent assay-detected p53 protein accumulation: a prognostic factor in a large breast cancer cohort. J. Clin. Oncol. 16:2641–2650. [DOI] [PubMed] [Google Scholar]
- Lichtner, R.B., A.R. Howlett, M. Lerch, J.-A. Xuan, J. Brink, B. Langton-Webster, and M.R. Schneider. 1998. Negative cooperativity between α3/β1 and α2/β1 integrins in human mammary carcinoma MDA MB 231 cells. Exp. Cell Res. 240:368–376. [DOI] [PubMed] [Google Scholar]
- Mancini, M., B.O. Anderson, E. Caldwell, M. Sedghinasab, P.B. Paty, and D.M. Hockenbery. 1997. Mitochondrial proliferation and paradoxical membrane depolarization during terminal differentiation and apoptosis in a human colon carcinoma cell line. J. Cell Biol. 128:449–469. [DOI] [PMC free article] [PubMed] [Google Scholar]
- Mitelman, F. 1995. An International System for Human Cytogenetic Nomenclature. S. Karger AG, Basel, Germany.
- Mrózek, K., C.P. Karakousis, C. Perez-Mesa, and C.D. Bloomfield. 1993. Translocation t(12;22)(q13;q12.2-12.3) in a clear cell sarcoma of tendons and aponeuroses. Genes Chromosomes Cancer. 6:249–252. [DOI] [PubMed] [Google Scholar]
- Petersen, O.W., L. Rønnov-Jessen, A.R. Howlett, and M.J. Bissell. 1992. Interaction with basement membrane serves to rapidly distinguish growth and differentiation pattern of normal and malignant human breast epithelial cells. Proc. Natl. Acad. Sci. USA. 89:9064–9068. [DOI] [PMC free article] [PubMed] [Google Scholar]
- Pullan, S., J. Wilson, A. Metcalfe, G.M. Edwards, N. Goberdham, J. Tilly, J.A. Hickman, C. Dive, and C.H. Streuli. 1996. Requirement of basement membrane for the suppression of programmed cell death in mammary epithelium. J. Cell Sci. 109:631–642. [DOI] [PubMed] [Google Scholar]
- Rohan, T.E., W. Hartwick, A.B. Miller, and R.A. Kandel. 1998. Immunohistochemical detection of c-erbB-2 and p53 in benign breast disease and breast cancer risk. J. Natl. Cancer Inst. 90:1262–1269. [DOI] [PubMed] [Google Scholar]
- Romanov, S.R., B.K. Kozakiewicz, C.R. Holst, M.R. Stampfer, L.M. Haupt, and T.D. Tlsty. 2001. Normal human mammary epithelial cells spontaneously escape senescence and acquire genomic changes. Nature. 409:633–637. [DOI] [PubMed] [Google Scholar]
- Roskelley, C.D., P.Y. Desprez, and M.J. Bissell. 1994. Extracellular matrix-dependent tissue-specific gene expression in mammary epithelial cells requires both physical and biochemical signal transduction. Proc. Natl. Acad. Sci. USA. 91:12378–12382. [DOI] [PMC free article] [PubMed] [Google Scholar]
- Sato, K., K. Katagiri, S. Hattori, T. Tsuji, T. Irimura, S. Irie, and T. Katagiri. 1999. Laminin 5 promotes activation and apoptosis of T cells expressing α3β1 integrin. Exp. Cell Res. 247:451–460. [DOI] [PubMed] [Google Scholar]
- Schröck, E., S. du Manoir, T. Veldman, B. Schoell, J. Wienberg, M.A. Ferguson-Smith, Y. Ning, D.H. Ledbetter, I. Bar-Am, D. Soenksen, et al. 1996. Multicolor spectral karyotyping of human chromosomes. Science. 273:494–497. [DOI] [PubMed] [Google Scholar]
- Seewaldt, V.L., B.S. Johnson, M.B. Parker, S.J. Collins, and K. Swisshelm. 1995. Expression of retinoic acid receptor β mediates retinoic acid-induced growth arrest and apoptosis in breast cancer cells. Cell Growth Differ. 6:1077–1088. [PubMed] [Google Scholar]
- Seewaldt, V.L., L.E. Caldwell, B.S. Johnson, K. Swisshelm, S.J. Collins, and S. Tsai. 1997. a. Inhibition of retinoic acid receptor function in normal human mammary epithelial cells results in increased cellular proliferation and inhibits the formation of a polarized epithelium in vitro. Exp. Cell Res. 236:16–28. [DOI] [PubMed] [Google Scholar]
- Seewaldt, V.L., J.-H. Kim, L.E. Caldwell, B.S. Johnson, K. Swisshelm, and S.J. Collins. 1997. b. All-trans-retinoic acid mediates G1 arrest of but not apoptosis of normal human mammary epithelial cells. Cell Growth Differ. 8:631–641. [PubMed] [Google Scholar]
- Seewaldt, V.L., E.C. Dietze, B.S. Johnson, S.J. Collins, and M.B. Parker. 1999. a. Retinoic acid-mediated G1-S-phase arrest of normal human mammary epithelial cells and is independent of p53 protein expression. Cell Growth Differ. 10:49–59. [PubMed] [Google Scholar]
- Seewaldt, V.L., J.-H. Kim, M.B. Parker, E.C. Dietze, K.V. Srinivasan, and L.E. Caldwell. 1999. b. Dysregulated expression of cyclin D1 in normal human mammary epithelial cells inhibits all-trans-retinoic acid-mediated G0/G1-phase arrest and differentiation in vitro. Exp. Cell Res. 249:70–85. [DOI] [PubMed] [Google Scholar]
- Seewaldt, V.L., K. Mrózek, E.C. Dietze, M. Parker, and L.E. Caldwell. 2001. Human papillomavirus type 16 E6 inactivation of p53 in normal human mammary epithelial cells promotes tamoxifen-mediated apoptosis. Cancer Res. 61:616–624. [PubMed] [Google Scholar]
- Spancake, K.M., C.B. Anderson, V.M. Weaver, N. Matsuami, M.J. Bissell, and R.L. White. 1999. E7-transduced human breast epithelial cells show partial differentiation in three-dimensional culture. Cancer Res. 59:6042–6045. [PubMed] [Google Scholar]
- Stampfer, M. 1985. Isolation and growth of human mammary epithelial cells. J. Tissue Cult. Method. 9:107–121. [Google Scholar]
- Strange, R., F. Li, S. Saurer, A. Burkhardt, and R.R. Friis. 1992. Apoptotic cell death and tissue remodeling during mouse mammary gland involution. Development. 115:49–58. [DOI] [PubMed] [Google Scholar]
- Streuli, C.H., N. Bailey, and M.J. Bissell. 1991. Control of mammary epithelial differentiation-basement membrane induces tissue-specific gene expression in the absence of cell–cell interaction and morphological polarity. J. Cell Biol. 115:1383–1395. [DOI] [PMC free article] [PubMed] [Google Scholar]
- Wahl, A.F., K.L. Donaldson, C. Fairchild, F.Y.F. Lee, S.A. Foster, G.W. Demers, and D.A. Galloway. 1996. Loss of normal p53 function confers sensitization to Taxol by increasing G2/M arrest and apoptosis. Nat. Med. 2:72–79. [DOI] [PubMed] [Google Scholar]
- Wayner, E.A., and W.G. Carter. 1987. Identification of multiple cell adhesion receptors for collagen and fibronectin in human fibrosarcoma cells possessing unique α and common β subunits. J. Cell Biol. 105:1873–1884. [DOI] [PMC free article] [PubMed] [Google Scholar]
- Wayner, E.A., W.G. Carter, R.S. Piotrowicz, and T.J. Kunicki. 1988. The function of multiple extracellular matrix receptors in mediating cell adhesion to extracellular matrix: preparation of monoclonal antibodies to the fibronectin receptor that specifically inhibit cell adhesion to fibronectin and react with platelet glycoproteins Ic-IIa. J. Cell Biol. 107:1881–1891. [DOI] [PMC free article] [PubMed] [Google Scholar]
- Weaver, V.M., O.W. Petersen, F. Wang, C.A. Larabell, P. Briand, C. Damsky, and M.J. Bissell. 1997. Reversion of the malignant phenotype of human breast cells in three-dimensional culture and in vivo by integrin blocking antibodies. J. Cell Biol. 137:231–245. [DOI] [PMC free article] [PubMed] [Google Scholar]
- Xia, Y., S.G. Gil, and W.G. Carter. 1996. Anchorage mediated by integrin α6/β4 to laminin 5 (epiligrin) regulates tyrosine phosphorylation of a membrane-associated 80-kD protein. J. Cell Biol. 132:727–740. [DOI] [PMC free article] [PubMed] [Google Scholar]
- Zutter, M.M., S.A. Santoro, W.D. Staatz, and Y.L. Tsung. 1995. Re-expression of the α2β1 integrin abrogates the malignant phenotype of breast carcinoma cells. Proc. Natl. Acad. Sci. USA. 92:7411–7415. [DOI] [PMC free article] [PubMed] [Google Scholar]