

Abstract
The CHO1-encoded phosphatidylserine synthase (CDP-diacylglycerol:L-serine O-phosphatidyltransferase, EC 2.7.8.8) is one of the most highly regulated phospholipid biosynthetic enzymes in the yeast Saccharomyces cerevisiae. CHO1 expression is regulated by nutrient availability through a regulatory circuit involving a UASINO cis-acting element in the CHO1 promoter, the positive transcription factors Ino2p and Ino4p, and the transcriptional repressor Opi1p. In this work, we examined the posttranscriptional regulation of CHO1 by mRNA stability. CHO1 mRNA was stabilized in mutants defective in deadenylation (ccr4Δ), mRNA decapping (dcp1), and the 5’-3’ exonuclease (xrn1) indicating that the CHO1 transcript is primarily degraded through the general 5’-3’ mRNA decay pathway. In respiratory sufficient cells, the CHO1 transcript was moderately stable with a half-life of 12 min. However, the CHO1 transcript was stabilized to a half-life of greater than 45 min in respiratory deficient (rho− and rho°) cells, the cox4Δ mutant defective in the cytochrome c oxidase, and wild type cells treated with KCN (a cytochorome c oxidase inhibitor). The increased CHO1 mRNA stability in response to respiratory deficiency caused increases in CHO1 mRNA abundance, phosphatidylserine synthase protein and activity, and the synthesis of phosphatidylserine in vivo. Respiratory deficiency also caused increases in the activities of CDP-diacylglycerol synthase, phosphatidylserine decarboxylase, and the phospholipid methyltransferases. Phosphatidylinositol synthase and choline kinase activities were not affected by respiratory deficiency. This work advances our understanding of phosphatidylserine synthase regulation and underscores the importance of mitochondrial respiration to the regulation of phospholipid synthesis in S. cerevisiae.
The CHO1-encoded (1–3) PS1 synthase (CDP-diacylglycerol:L-serine O-phosphatidyltransferase, EC 2.7.8.8)2 is one of the most highly regulated enzymes of phospholipid synthesis in the yeast Saccharomyces cerevisiae (4–6). PS synthase is an integral membrane protein that is localized to the endoplasmic reticulum (7). It catalyzes the formation of PS by a Mn2+-dependent sequential reaction by displacing CMP from CDP-DAG with serine (8). The reaction product PS is a major structural component of yeast membranes accounting for 4–18% of total phospholipids depending on growth conditions (9–11). PS also serves as the precursor for the synthesis of the most abundant membrane phospholipids PE (20–32%) and PC (35–55%) that are synthesized by the de novo CDP-DAG pathway (Fig. 1) (5, 9).
FIGURE 1. Phospholipid synthetic pathways in S. cerevisiae.

The pathways shown for the synthesis of phospholipids include the relevant steps discussed throughout the paper. The genes encoding enzymes responsible for the reactions in the CDP-DAG and Kennedy pathways are indicated in the figure. PA, phosphatidate; CDP-DAG, CDP-diacylglycerol; PI, phosphatidylinositol; PS, phosphatidylserine; PE, phosphatidylethanolamine; PC, phosphatidylcholine; DAG, diacylglycerol; P-choline, phosphocholine; P-ethanolamine, phosphoethanolamine.
cho1 mutants defective in PS synthase activity can still synthesize PE and PC if they are supplemented with ethanolamine or choline; indeed cho1 mutants are ethanolamine/choline auxotrophs (12, 13). Ethanolamine is used for PE synthesis via the CDP-ethanolamine branch of the Kennedy pathway (Fig. 1). The PE synthesized by the Kennedy pathway may be methylated to PC via the CDP-DAG pathway (Fig. 1). Choline is used for PC synthesis via the CDP-choline branch of the Kennedy pathway (Fig. 1). In wild type cells, both the CDP-DAG and Kennedy pathways contribute to the synthesis of PC regardless of whether choline is supplemented to the growth medium (14–19). If choline is not present in the growth medium, the choline required for the Kennedy pathway is derived from the phospholipase D-mediated turnover of PC synthesized by way of the CDP-DAG pathway (19, 20).
PS synthase is regulated by biochemical and genetic mechanisms, both of which have an impact on the synthesis of PC via the CDP-DAG and Kennedy pathways (4–6, 21). The activity of PS synthase is modulated (i.e., inhibited or activated) by membrane phospholipids (e.g., PA, phosphatidylglycerol, cardiolipin,) (22–24), and is inhibited by inositol (25) and by the nucleotide CTP (17). In addition, the phosphorylation of the enzyme inhibits its activity, whereas dephosphorylation stimulates its activity (26, 27). In general, the inhibition of PS synthase activity favors PC synthesis via the Kennedy pathway (4, 5). The biochemical regulation of PS synthase activity also governs the partitioning of the substrate CDP-DAG between PS and PI; the inhibition of PS synthase activity favors PI synthesis (Fig. 1) (4).
The expression of the PS synthase (CHO1) gene is regulated by the supplementation of water-soluble phospholipid precursors (e.g., inositol) (28–31), zinc deprivation (32), and by growth phase (33, 34). CHO1 is maximally expressed in exponential phase cells when grown in the absence of inositol (28–31) and grown in the presence of zinc (32). CHO1 is repressed when inositol is supplemented to the growth medium (28–31) or when zinc is depleted from the growth medium (32). The zinc-mediated regulation of CHO1 occurs in the absence of inositol supplementation (32). Repression of CHO1 also occurs when cells enter the stationary phase of growth (33, 34). These forms of regulation are dependent on the UASINO cis-acting element in the promoter of the CHO1 gene (21). The derepression of CHO1 is mediated by a heterodimer complex of the positive transcription factors Ino2p and Ino4p that bind to a UASINO cis-acting element to drive transcription (5, 21, 35, 36). Repression of CHO1 is mediated by the repressor Opi1p, which interacts with Ino2p to attenuate transcription (5, 21, 35, 36). Opi1p repressor function is regulated by the cellular concentration of PA, which helps anchor the repressor to the nuclear/endoplasmic reticulum membrane apart from the Ino2p-Ino4p complex bound to the UASINO element (37). PA concentration and Opi1p repressor function is mediated in part by the PAH1-encoded Mg2+-dependent PA phosphatase enzyme (38–40). Data (41) are consistent with a model (40) whereby activation of Mg2+-dependent PA phosphatase activity results in a decrease in PA concentration followed by the translocation of Opi1p into the nucleus for interaction with Ino2p to repress CHO1 transcription. As discussed above for the biochemical regulation of PS synthase activity, the repression of CHO1 favors PI synthesis and the Kennedy pathway for PC synthesis (5).
Decay analysis of CHO1 mRNA in a cki1Δ eki1Δ mutant defective in the synthesis of phospholipids via the Kennedy pathway (Fig. 1) has revealed a novel mechanism by which CHO1 expression is regulated independent of the UASINO element in the CHO1 promoter (42). In wild type cells, CHO1 mRNA is moderately stable with a half-life of 12 min when compared with other S. cerevisiae mRNAs that have half-lives ranging from 1 to 60 min (43). However, CHO1 mRNA is greatly stabilized with a half-life > 45 min in the cki1Δ eki1Δ (KS106) mutant (42). This results in increased levels of the PS synthase protein and its associated activity (42). The objective of this work was to identify an intermediate or end product of the Kennedy that was responsible for regulation of CHO1 mRNA stability. During the course of this work, we discovered that the stabilization of CHO1 mRNA was not mediated by components of the Kennedy pathway, but instead it was mediated by a defect in mitochondrial respiration. This work underscores the importance of respiration to the regulation of phospholipid synthesis and advances our understanding PS synthase regulation in yeast.
EXPERIMENTAL PROCEDURES
Materials
All chemicals were reagent grade. Growth medium supplies were purchased from Difco Laboratories. The plasmid DNA purification and DNA gel extraction kits were from Qiagen, Inc. NEBlot kit, restriction endonucleases, recombinant Vent DNA polymerase, and modifying enzymes were purchased from New England Biolabs, Inc. RNA size markers were purchased from Promega. Yeast transformation kit was obtained from Clontech. Enhanced chemifluorescence Western blotting detection kit, polyvinylidene difluoride membranes, and ProbeQuant G-50 columns were purchased from GE Healthcare. Bio-Rad was the supplier of Zeta Probe blotting membranes, protein assay reagents, electrophoretic reagents, acrylamide solutions, immunochemical reagents, the DNA size ladder used for agarose gel electrophoresis, and protein molecular mass standards for SDS-PAGE. AdoMet, ampicillin, aprotinin, benzamidine, bovine serum albumin, choline, CTP, leupeptin, N-ethylmaleimide, pepstatin, phenylmethylsulfonyl fluoride, L-serine, and Triton X-100 were purchased from Sigma. Phospholipids were purchased from Avanti Polar Lipids. TLC plates were from EM science. Radiochemicals and scintillation counting supplies were from PerkinElmer Life Sciences and National Diagnostics, respectively. Thiolutin was a gift from Pfizer.
Strains, Plasmids, and Growth Conditions
The bacterial and yeast strains used in this work are listed in Table 1. Methods for the growth of bacteria and yeast were described previously (44, 45). Cells were grown at 30 °C in complete synthetic medium without inositol (46) using either 2% glucose or 2% glycerol as the carbon source. For selection of cells bearing plasmids, appropriate nutrients were omitted from synthetic complete medium. Glucose-grown cells were also cultured in the presence of 1 mM hydrogen peroxide to induce oxidative stress (47, 48). Cells in liquid media were grown to the exponential phase (1–2 × 10⁷ cells/ml), and cell numbers were determined spectrophotometrically at an absorbance of 600 nm. Plasmids were maintained and amplified in Escherichia coli strain DH5α, which was grown in LB medium (1% tryptone, 0.5% yeast extract, 1% NaCl, pH 7.4) at 37 °C. Ampicillin (100 mg/ml) was added to cultures of DH5α carrying plasmids. For growth on plates, yeast and bacterial media were supplemented with 2% and 1.5% agar, respectively. Respiratory sufficiency was scored by growth on YPG (1% yeast extract, 2% peptone, 2% glycerol) and YPD (1% yeast extract, 2% peptone, 2% glucose) media plates (44, 45).
TABLE 1.
Strains used in this work
| Strain | Relevant characteristics | Source or Ref. |
|---|---|---|
| E. coli | ||
| DH5α | F− ϕ80dlacZΔM15 Δ(lacZYA-argF)U169 deoR recA1 endA1 hsdR17(rk− mk+) phoA supE44 λ−thi-1 gyrA96 relA1 | (45) |
| S. cerevisiae | ||
| yRP840 | MATa cup1::LEU2 (PM) his4-539 leu2-3,112 trp1 ura3-52 | (95) |
| yRP841 | MATa cup1::LEU2 (PM) leu2-3,112 lys2-201 trp1 ura3-52 | (95) |
| yRP1616 | ccr4Δ::NEO derivative of yRP840 | (96) |
| yRP1069 | dcp1::URA3 derivative of yRP841 | (95) |
| yRP884 | xrn1::URA3 derivative of yRP840 | (95) |
| W303-1B | MATα ade2-1 can1-100 his3-11,15 leu2-3,112 trp1-1 ura3-1 | (97) |
| KS105 | cki1Δ::HIS3 derivative of W303-1B | (53) |
| KS101 | eki1Δ::TRP1 derivative of W303-1B [rho°] | (53) |
| KS106 | cki1Δ::HIS3 eki1Δ::TRP1 derivative of W303-1B [rho°] | (53) |
| HCY3 | ect1Δ::TRP1 derivative of W303-1B | This study |
| HCY4 | ept1Δ::TRP1 derivative of W303-1B | This study |
| HCY5 | eki1Δ::TRP1 derivative of strain W303-1B | This study |
| HCY6 | rho° derivative of HCY5 | This study |
| HCY7 | cki1Δ::HIS3 eki1Δ::TRP1 derivative of W303-1B | This study |
| HCY8 | rho− derivative of W303-1B | This study |
| W303 [rho°] | MATa ade2-1 can1-100 his3-11,15 leu2-3,112 trp1-1 ura3-1 [rho°] | M. Greenberg |
| MGY100 | MATa ade1 oxi2 [rho−] | M. Greenberg |
| DL1 | MATα his3-11 15 leu2-3 12 ura3-251 328,372 | (98) |
| WD1 | cox4Δ::LEU2 derivative of DL1 | (77) |
4’-6-Diamidino-2-phenylindole (DAPI)-staining of Mitochondria
Mitochondrial DNA of S. cerevisiae cells was examined by 4’-6-diamidino-2-phenylindole (DAPI) staining (49) using a Nikon Eclipse E800 fluorescence microscope equipped with a Hamamatsu Orca digital camera. Images were captured in monochrome and processed using Improvision Openlab software.
DNA Isolation and Manipulations
Plasmid and genomic DNA preparation, restriction enzyme digestion, and DNA ligations were performed according to standard protocols (45). Transformations of yeast (50) and E. coli (45) were performed as described previously. Plasmid maintenance and amplifications were performed in E. coli strain DH5α. Conditions for the amplification of DNA by PCR were optimized as described previously (51).
Construction of eki1Δ, ect1Δ, ept1Δ, and cki1Δ eki1Δ Mutants
A new eki1Δ mutant (HCY5) was constructed in the W303-1B background by the one-step gene replacement technique (52) with the eki1Δ::TRP1 disruption cassette as described by Kim et al. (53). The ect1Δ (HCY3) and ept1Δ (HCY4) mutants were similarly constructed in W303-1B using ect1Δ::TRP1 and ept1Δ::TRP1 disruption cassettes, respectively, that were prepared by PCR using appropriate primers and plasmid pRS414. Disruption of the chromosomal copies of the EKI1, ECT1, and EPT1 genes in the eki1Δ, ect1Δ, and ept1Δ, respectively, were confirmed by PCR using the appropriate primers. Loss of the functions of the EKI1, ECT1, and EPT1 gene products in the mutants were confirmed by [1,2-14C]ethanolamine labeling and analysis of CDP-ethanolamine pathway intermediates (53–55). A new cki1Δ eki1Δ mutant (HCY7) was constructed by the one-step gene replacement technique (52) using the eki1Δ::TRP1 disruption cassette in the cki1Δ (KS105) mutant (53).
Analysis of CHO1 mRNA Decay
Total RNA was isolated from cells (43, 56), resolved overnight at 22V on a 1.1% formaldehyde gel (57), and then transferred to Zeta Probe membrane by vacuum blotting. The CHO1 (17) and PGK1 (58) probes were labeled with [α-32P]dTTP using the NEBlot random primer labeling kit. Unincorporated nucleotides were removed using ProbeQuant G-50 columns. Pre-hybridization, hybridization with the probes, and washes to remove non-specific binding were carried out according to manufacturer’s instructions. Images of radiolabeled mRNAs were acquired by phosphorimaging analysis. The half-life of CHO1 mRNA was determined after the arrest of transcription with thiolutin (15 µg/ml) as described by Gonzalez and Martin (58).
Immunoblotting
SDS-PAGE (59) using 12% slab gels and transfer of proteins to polyvinylidene difluoride membranes (60) were performed as described previously. The membrane was probed with a 1:500 dilution of anti-PS synthase antibodies (42). Goat anti-rabbit IgG alkaline phosphatase conjugate was used as a secondary antibody at a dilution of 1:5000. The PS synthase protein was detected using the enhanced chemifluorescence Western blotting detection kit, and the protein signals were acquired by Fluoroimaging. The relative density of the protein was analyzed using ImageQuant software. Immunoblot signals were in the linear range of detectability.
Preparation of Yeast Cell Extract and the Total Membrane Fraction
The cell extract and total membrane fraction were prepared as described previously (61). Cell pellets were homogenized with glass beads at 4 °C in 50 mM Tris-maleate buffer (pH 7.0) containing 1 mM EDTA, 0.3 M sucrose, 10 mM 2-mercaptoethanol, 0.5 mM phenylmethylsulfonyl fluoride, 1 mM benzamidine, and 5 µg/ml each of aprotinin, leupeptin, and pepstatin. The cell extract was obtained by centrifugation of the homogenate at 1,500 × g for 10 min. The cell extract was centrifuged at 100,000 × g for 1 h to obtain total membranes, which were then resuspended in 50 mM Tris-maleate (pH 7.0) buffer containing 10 mM MgCl2, 10 mM 2-mercaptoethanol, 20% glycerol (w/v), and 0.5 mM phenylmethylsulfonyl fluoride. Protein concentration was estimated by the method of Bradford (62) using bovine serum albumin as the standard.
Enzymes Assays
All assays were conducted in triplicate at 30 °C. CDP-DAG synthase activity was measured with 50 mM Tris-maleate buffer (pH 6.5), 20 mM MgCl2, 15 mM Triton X-100, 0.5 mM PA, and 1.0 mM [5-³H]CTP (63). PS synthase activity was measured with 50 mM Tris-HCl buffer (pH 8.0), 0.6 mM MnCl2, 3.2 mM Triton X-100, 0.2 mM CDP-DAG, and 0.5 mM [3-³H]serine (64). PS decarboxylase activity was measured with 50 mM Tris-HCl buffer (pH 7.2), 10 mM 2-mercaptoethanol, 5 mM EDTA, 2 mM Triton X-100, and 0.5 mM [3-³H]PS (65, 66). PE methyltransferase activity was measured with 50 mM Tris-HCl buffer (pH 9.0), 0.2 mM PE, and 0.5 mM [Me-³H]AdoMet (67). Phospholipid methyltransferase activity was measured with 50 mM Tris-HCl buffer (pH 7.5), 10 mM MgCl2, 0.2 mM phosphatidylmonomethylethanolamine, and 0.5 mM [Me-³H]AdoMet (67). PI synthase activity was measured with 50 mM Tris-HCl buffer (pH 8.0), 2 mM MnCl2, 3.2 mM Triton X-100, 0.2 mM CDP-DAG, and 1 mM [2-³H]inositol (68). Choline kinase activity was measured with 67 mM glycine-NaOH buffer (pH 9.5), 10 mM MgSO4, 1.3 mM dithiothreitol, 0.5 mM ATP, and 5 mM [methyl-³H]choline (69). All assays were linear with time and protein concentration. The average standard deviation of the assays was ± 5%. A unit of phospholipid enzymatic activity was defined as the amount of enzyme that catalyzed the formation of 1 nmol of product per min.
Labeling and Analysis of Phospholipids
Labeling of phospholipids with [14C]serine was performed as described previously (12, 13). Phospholipid synthesis was followed by labeling exponential phase cells for 30 min. Phospholipids were extracted from labeled cells by the method of Bligh and Dyer (70). Two-dimension TLC with chloroform/methanol/ammonium hydroxide/H2O (90:50:4:6) (dimension 1) and chloroform/methanol/acetic acid/H2O (63:8:10:2) (dimension 2) was used to separate phospholipids (42). Radiolabeled phospholipids on the chromatography plates were visualized by phosphorimaging, and their identities were confirmed by comparison with standard phospholipids after exposure to iodine vapor. The amount of each 14C-labeled phospholipid was determined by liquid scintillation counting.
Analyses of Data
Statistical analyses were performed with SigmaPlot software. Statistical significance was determined by performing the Student’s t-test. P values < 0.05 were taken as a significant difference.
RESULTS
CHO1 mRNA Decay Involves Deadenylation, Decapping, and 5’-3’ Exonuclease Cleavage
Many mRNAs in S. cerevisiae are degraded by a general deadenylation-dependent pathway involving the deadenylation of the poly(A) tail by Ccr4p, the removal of the 5’ cap by the Dcp1p-Dcp2p complex, and the 5’-3’ exonuclease cleavage by Xrn1p (71). To examine whether CHO1 mRNA is degraded by this general pathway, a decay analysis was performed in mutants defective in each of the three steps. The rate of CHO1 mRNA decay was reduced in the ccr4Δ mutant defective in deadenylation, in the dcp1Δ mutant defective in decapping, and in the xrn1Δ mutant defective in 5’-3’ exonuclease cleavage (Fig. 2, Table 3). That CHO1 mRNA was stabilized in these mutants indicated that the CHO1 transcript is degraded by the general decay pathway (71).
FIGURE 2. Effects of the ccr4Δ, dcp1Δ, and xrn1Δ mutations on CHO1 mRNA decay.

Wild type (WT, yRP840 for ccr4Δ and xrn1Δ, and yRP841 for dcp1Δ), ccr4Δ (yRP1616), dcp1Δ (yRP1069), and xrn1Δ (yRP884) mutant cells were grown to the exponential phase (1×10⁷ cells/ml) of growth. Following the arrest of transcription, 5-ml samples were taken every 5 min, total RNA was extracted, and the levels of CHO1 mRNA and PGK1 mRNA were determined by Northern blot analysis. The relative amounts of CHO1 and PGK1 mRNAs were determined by ImageQuant analysis. The figure shows a plot of the log of the relative amount of CHO1 to PGK1 mRNAs versus time. The lines drawn were the result of a least-squares analysis of the data. The data shown in the figure are representative of three independent experiments. Half-life values are presented in Table 3.
TABLE 3.
CHO1 mRNA half-lives determined in this work
| Strain | Half-life (min)1 |
|---|---|
| Wild type (yRP840) | 15.4 ± 4.4 |
| ccr4Δ (yRP1616) | > 45 |
| xrn1Δ (yRP884) | > 45 |
| Wild type (yRP841) | 11.6 ± 2.4 |
| dcp1Δ (yRP1069) | > 45 |
| Wild type (W303-1B) | 12.3 ± 1.3 |
| cki1Δ (KS105) | 14.5 ± 2.2 |
| eki1Δ [rho°] (KS101) | > 45 |
| eki1Δ cki1Δ [rho°] (KS106) | > 45 |
| ect1Δ (HCY3) | 12.9 ± 1.8 |
| ept1Δ (HCY4) | 14.6 ± 2.1 |
| eki1Δ [rho°]/EKI1 (KS101 containing pHS9) | > 45 |
| eki1Δ (HCY5) | 17 ± 1.25 |
| eki1Δ [rho°] (HCY6) | > 45 |
| rho− (MGY100) | > 45 |
| rho° (W303 [rho°]) | > 45 |
| rho− (HCY8) | > 45 |
| Wild type treated with 1 mM KCN | 22.3 ± 1.3 |
| Wild type treated with 2 mM KCN | 32.0 ± 1.4 |
| Wild type treated with 4 mM KCN | > 45 |
| Wild type (DL1) | 18.5 ± 4.5 |
| cox4Δ (WD1) | > 45 |
The half-life values are the average of triplicate determinations ± S.D.
Effects of the cki1Δ, eki1Δ, and cki1Δ eki1Δ Mutations on CHO1 mRNA Decay
Previous studies have shown that the cki1Δ eki1Δ mutations have a stabilizing effect on the abundance of CHO1 mRNA (42). It is unclear, however, whether the signal responsible for increased CHO1 mRNA stability in the cki1Δ eki1Δ (KS106) mutant results from a defect in the CDP-choline branch, the CDP-ethanolamine branch, or from both branches of the Kennedy pathway. To address this question, CHO1 mRNA decay was examined in the cki1Δ (KS105) mutant (53) defective in the first step of the CDP-choline pathway and in the eki1Δ (KS101) mutant (53) defective in the first step of the CDP-ethanolamine pathway (Fig. 1). CHO1 mRNA decay was also reexamined in the cki1Δ eki1Δ (KS106) mutant. The half-life of CHO1 mRNA decay in the cki1Δ mutant was similar to that observed in the wild type control (Fig. 3, Table 3). In contrast, CHO1 mRNA was stabilized in the eki1Δ (KS101) mutant (Fig. 3, Table 3). Thus, the increase in CHO1 mRNA stability in the cki1Δ eki1Δ (KS106) mutant was due to the eki1Δ mutation (i.e., defect in the CDP-ethanolamine branch).
FIGURE 3. Effects of the cki1Δ, eki1Δ, and cki1Δ eki1Δ mutations on CHO1 mRNA decay.

Wild type (WT, W303-1B), cki1Δ (KS105), eki1Δ (KS101), and cki1Δ eki1Δ (KS106) mutant cells were grown to the exponential phase (1×10⁷ cells/ml) of growth. Following the arrest of transcription, CHO1 mRNA decay was quantified as described in the legend to Fig. 2. The figure shows a plot of the log of the relative amount of CHO1 to PGK1 mRNAs versus time. The lines drawn were the result of a least-squares analysis of the data. The data shown in the figure are representative of three independent experiments. Half-life values are presented in Table 3.
Effects of CDP-ethanolamine Pathway Mutations on CHO1 mRNA Decay
Mutations in the second (ect1Δ) and third (ept1Δ) steps of the CDP-ethanolamine pathway (i.e., phosphoethanolamine cytidylyltransferase and phosphocholine cytidylyltransferase, respectively) were constructed and examined for their effects on CHO1 mRNA decay. Of the three mutants, eki1Δ (KS101) was the only mutant in which CHO1 mRNA was stabilized (Fig. 4, Table 3). The effects of the three CDP-ethanolamine pathway mutations on the abundance of CHO1 mRNA and PS synthase protein (Cho1p) were also examined (Fig. 5). The levels of CHO1 mRNA and PS synthase protein were elevated by about 2-fold in the eki1Δ (KS101) mutant when compared with the wild type control (Fig. 5). As described previously (42), CHO1 mRNA and Cho1p were elevated in the cki1Δ eki1Δ (KS106) mutant. These results correlated with the increase in CHO1 mRNA stability observed in the eki1Δ and cki1Δ eki1Δ mutants. On the other hand, the CHO1 gene products were not affected in the ect1Δ and ept1Δ mutants (Fig. 5).
FIGURE 4. Effects of the eki1Δ, ect1Δ, and ept1Δ mutations on CHO1 mRNA decay.

Wild type (WT, W303-1B), eki1Δ (KS101), ect1Δ (HCY3), and ept1Δ (HCY4) mutant cells were grown to the exponential phase (1×10⁷ cells/ml) of growth. Following the arrest of transcription, CHO1 mRNA decay was quantified as described in the legend to Fig. 2. The figure shows a plot of the log of the relative amount of CHO1 to PGK1 mRNAs versus time. The lines drawn were the result of a least-squares analysis of the data. The data shown in the figure are representative of three independent experiments. Half-life values are presented in Table 3.
FIGURE 5. Effects of Kennedy pathway mutations on the levels of CHO1 mRNA and PS synthase protein.

Wild type (WT, W303-1B), cki1Δ (KS105), eki1Δ (KS101), cki1Δ eki1Δ (KS106), ect1Δ (HCY3), and ept1Δ (HCY4) mutant cells were grown to the exponential phase (1×10⁷ cells/ml) of growth. A, the abundance of CHO1 mRNA was determined with 10 µg of total RNA by Northern blot analysis. The relative amounts of CHO1 and PGK1 mRNAs from wild type and mutant cells were determined by ImageQuant analysis of the data. The relative amount of CHO1 to PGK1 mRNA in wild type cells was arbitrarily set at 1. B, the total membrane fraction (12.5 µg of protein) was subjected to immunoblot analysis using a 1:500 dilution of anti-PS synthase antibodies. The relative amounts of the PS synthase protein from wild type and mutant cells were determined by ImageQuant analysis of the data. The amount of PS synthase protein found in wild type cells was arbitrarily set at 1. The data shown in panels A and B are the average of three experiments ± S.D.
Loss of the EKI1 Gene Is Not Responsible for Increased CHO1 mRNA Stability in the eki1Δ (KS101) Mutant
To confirm that the deletion of the EKI1 gene was responsible for the increased stability of CHO1 mRNA, the eki1Δ (KS101) mutant was transformed with a single copy plasmid bearing the EKI1 gene. Unexpectedly, the introduction of the EKI1 gene into the eki1Δ (KS101) mutant did not reverse the stable CHO1 mRNA phenotype of the mutant (Fig. 6, Table 3). This result indicated that a second mutation in the eki1Δ mutant was responsible for increasing CHO1 mRNA stability. Accordingly, a new eki1Δ (HCY5) mutant was constructed by the same method (53) used to construct the original eki1Δ (KS101) mutant. The analysis of CHO1 mRNA decay in the new eki1Δ mutant confirmed that the loss of the EKI1 gene was not responsible for the increased stability of CHO1 mRNA (Fig. 6, Table 3). Moreover, a new cki1Δ eki1Δ HCY7 mutant () was constructed, and it exhibited the wild type rate of CHO1 mRNA decay.
FIGURE 6. Effect of the EKI1 gene on CHO1 mRNA decay.

Wild type (WT, W303-1B), eki1Δ (KS101 containing plasmid YEp352), eki1Δ/EKI1 (KS101 containing plasmid pHS9), and eki1Δ (HCY5) mutant cells were grown to the exponential phase (1×10⁷ cells/ml) of growth. Following the arrest of transcription, CHO1 mRNA decay was quantified as described in the legend to Fig. 2. The figure shows a plot of the log of the relative amount of CHO1 to PGK1 mRNAs versus time. The lines drawn were the result of a least-squares analysis of the data. The data shown in the figure are representative of three independent experiments. Half-life values are presented in Table 3.
The eki1Δ (KS101) and cki1Δ eki1Δ (KS106) Mutants Are Respiratory Deficient
Unlike wild type (W303-1B) cells that formed pink colonies on agar plates, the eki1Δ (KS101) and cki1Δ eki1Δ (KS106) mutant colonies were white and relatively small (i.e., petite) in appearance. These characteristics were first thought to be due to the eki1Δ mutation. However, the colonies produced by the new eki1Δ (HCY5) and cki1Δ eki1Δ (HCY7) mutants were similar in appearance (i.e., normal size and pink) to their wild type parent W303-1B. Petite white colonies are characteristics of respiratory-deficient mutants (44). Respiratory deficient mutants are defective in mitochondrial function and cannot grow on non-fermentable carbon sources (44, 72). With this in mind, the respiratory sufficiency of the original eki1Δ (KS101) and cki1Δ eki1Δ (KS106) mutants were examined by growth on agar plates containing glucose (fermentable) or glycerol (non-fermentable) as the carbon source. Like known respiratory mutants (MGY100 and W303 [rho°]), the original eki1Δ (KS101) and cki1Δ eki1Δ (KS106) mutants only grew on glucose agar plates, whereas the new eki1Δ (HCY5) and cki1Δ eki1Δ (HCY7) mutants grew on both glucose and glycerol agar plates (Table 4). These data indicated that the original mutants were respiratory deficient. The white colony phenotype can be attributed to respiratory deficiency because the development of a pink color in the ade2 genetic background found in the eki1Δ (KS101) and cki1Δ eki1Δ (KS106) mutants and the parent W303-1B strain would be dependent on oxidative phosphorylation (73). Another characteristic common to respiratory-deficient mutants is the inability to grow at elevated temperatures (74). Indeed, the original eki1Δ (KS101) and cki1Δ eki1Δ (KS106) mutants were temperature sensitive for growth at 37 °C, whereas the new mutants were not temperature sensitive for growth (Table 4).
TABLE 4.
Growth of mutants using glycerol and glucose as the carbon source
| Growth1 |
|||
|---|---|---|---|
| Relevant genotype (strain) | Glycerol, 30 °C | Glucose, 30 °C | Glucose, 37 °C |
| Wild type (W303-1B) | + | + | + |
| eki1Δ [rho°] (KS101) | − | + | − |
| eki1Δ (HCY5) | + | + | + |
| eki1Δ (HCY6) | − | + | − |
| cki1Δ eki1Δ [rho°] (KS106) | − | + | − |
| cki1Δ eki1Δ (HCY7) | + | + | + |
| rho− (HCY8) | − | + | − |
| rho− (MGY100) | − | + | − |
| rho° (W303-1B [rho°]) | − | + | − |
The indicated cells were grown in YPD medium to stationary phase at 30 °C. Cells were diluted and spotted onto YPG and YPD media plates. The plates were incubated at the indicated temperatures, and colony growth was scored after 5 days. +, growth; −, no growth.
Interestingly, the new eki1Δ (HCY5) mutant had a tendency to give rise to spontaneous petite colonies that were white in color. Likewise, the wild type parent W303-1B also gave rise to petite white colonies, but at a lower frequency. One petite colony (strain HCY6) that was derived from the new eki1Δ (HCY5) mutant and one petite colony (strain HCY8) that was derived from the parent strain W303-1B were examined for their growth on glucose and glycerol, and for their growth on glucose at 37 °C. Strains HCY6 and HCY8 exhibited the phenotypes of respiratory deficiency (Table 4).
Respiratory deficient mutants are differentiated by the extent of mitochondrial DNA that they lack. Cells that have a reduced amount of mitochondrial DNA are designated rho−, whereas cells that lack mitochondrial DNA are designated rho° (44, 72). Florescence microscopy of cells stained with 4',6-diamidino-2-phenylindole (DAPI) (44) indicated that KS101, KS106, and HCY6 were rho°, whereas HCY8 was rho−.
Respiratory Deficiency Is Responsible for Increased CHO1 mRNA Stability
CHO1 mRNA decay was examined in two respiratory deficient mutants. These mutants included a known rho− mutant (MGY100) and a known rho° mutant (W303-1A [rho°]). The two respiratory mutants exhibited an increase in the half-life of CHO1 mRNA when compared with that of the respiratory sufficient control (Fig. 7, Table 3). Thus, respiratory deficiency, whether due to a partial or total lack of the mitochondrial genome, gave rise to increased CHO1 mRNA stability. These data also confirmed that the basis for the increased stability of CHO1 mRNA in the original eki1Δ (KS101) mutant was respiratory deficiency.
FIGURE 7. Effect of respiratory deficiency on CHO1 mRNA decay.

Wild type (WT, W303-1B), rho− (MGY100), and rho° (W303 [rho°]) mutant cells were grown to the exponential phase (1×10⁷ cells/ml) of growth. Following the arrest of transcription, CHO1 mRNA decay was quantified as described in the legend to Fig. 2. The figure shows a plot of the log of the relative amount of CHO1 to PGK1 mRNAs versus time. The lines drawn were the result of a least-squares analysis of the data. The data shown in the figure are representative of three independent experiments. Half-life values are presented in Table 3.
Respiration is a major function of the mitochondrion, which takes place at the inner mitochondrial by five-enzymatic complexes (75). KCN, a specific inhibitor of cytochrome c oxidase (complex IV), is commonly used to halt the electron transport chain and mitochondrial respiration (75, 76). To determine the effects of inhibiting respiration on CHO1 mRNA stability, respiratory-sufficient cells (W303-1B) were grown in the absence and presence of KCN. The addition of KCN to the growth medium resulted in a dose-dependent increase in the half-life of CHO1 mRNA (Fig. 8, Table 3). To further confirm that a block in respiration was responsible for the increase in CHO1 mRNA stability, the decay of the CHO1 transcript was analyzed in the cox4Δ mutant. COX4 is a nuclear gene that encodes an indispensable subunit of cytochrome c oxidase (77). The decay rate of CHO1 mRNA was much longer in the cox4Δ mutant when compared with the wild type control (Fig. 9, Table 3). Taken together, these data provided strong evidence that respiratory deficiency mediates CHO1 mRNA stability.
FIGURE 8. Effects of KCN on CHO1 mRNA decay.

Effects of KCN on CHO1 mRNA decay. Wild type (W303-1B) cells were grown to the exponential phase (1×10⁷ cells/ml) of growth in the absence and presence of the indicated concentrations of KCN. Following the arrest of transcription, CHO1 mRNA decay was quantified as described in the legend to Fig. 2. The figure shows a plot of the log of the relative amount of CHO1 to PGK1 mRNAs versus time. The lines drawn were the result of a least-squares analysis of the data. The data shown in the figure are representative of three independent experiments. Half-life values are presented in Table 3.
FIGURE 9. Effect of the cox4Δ mutation on CHO1 mRNA decay.

Wild type (WT, W303-1B) and cox4Δ (WD1) mutant cells were grown to the exponential phase (1×10⁷ cells/ml) of growth. Following the arrest of transcription, CHO1 mRNA decay was quantified as described in the legend to Fig. 2. The figure shows a plot of the log of the relative amount of CHO1 to PGK1 mRNAs versus time. The lines drawn were the result of a least-squares analysis of the data. The data shown in the figure are representative of three independent experiments. Half-life values are presented in Table 3.
Effects of Respiratory Deficiency on the Abundance of CHO1 mRNA, PS Synthase Protein, PS Synthase Activity, and on the Synthesis of PS In Vivo
Northern blot and Western blot analyses for the CHO1 gene products were performed with a respiratory deficient mutant and the results are presented in Figs. 10A and B, respectively. The levels of both CHO1 mRNA and PS synthase protein (Cho1p) were about 2-fold higher in the respiratory deficient mutant when compared with the levels in the wild type control. The increased levels of CHO1 mRNA and PS synthase protein in the respiratory mutant correlated with an increased level of PS synthase activity (Fig. 10C). Elevated PS synthase activity was also characteristic of respiratory deficient eki1Δ (KS101) and cki1Δ eki1Δ (KS106) mutants, but not respiratory sufficient eki1Δ (HCY5) and cki1Δ eki1Δ (HCY7) mutants. To examine the effect of respiratory deficiency on the synthesis of PS in vivo, exponential phase cells were labeled with [14C]serine for 30 min followed by the extraction and analysis of phospholipids. [14C]Serine is directly incorporated into PS via the PS synthase enzyme, followed by the incorporation of the label into PE and PC via the reactions catalyzed by the PS decarboxylase and phospholipid methyltransferase enzymes (i.e., CDP-DAG pathway) (5, 12). The respiratory deficient mutant showed a 1.9-fold increase in the incorporation of [14C]serine into PS after the 30 min labeling period (Fig. 10D). The effects of respiratory deficiency on the incorporation of the label into PE and PC were less dramatic (Fig. 10D). Respiratory deficiency did not have a significant effect on the steady state composition of phospholipids labeled [14C]serine.
FIGURE 10. Effects of respiratory deficiency on the levels of CHO1 mRNA, PS synthase protein, PS synthase activity, and the synthesis of PS in vivo.

Wild type (WT, W303-1B) and rho− (HCY8) mutant cells were grown to the exponential phase (1×10⁷ cells/ml) of growth. A, the abundance of CHO1 mRNA was determined with 10 µg of total RNA by Northern blot analysis. The relative amounts of CHO1 and PGK1 mRNAs from wild type and mutant cells were determined by ImageQuant analysis of the data. The relative amount of CHO1 to PGK1 mRNA in wild type cells was arbitrarily set at 1. B, the total membrane fraction (12.5 µg of protein) was subjected to immunoblot analysis using a 1:500 dilution of anti-PS synthase antibodies. The relative amounts of the PS synthase protein from wild type and mutant cells were determined by ImageQuant analysis of the data. The amount of PS synthase protein found in wild type cells was arbitrarily set at 1. C, the total membrane fraction was isolated and used for the assay of PS synthase activity. D, cells were incubated with [14C]serine for 30 min. Phospholipids were extracted and analyzed by two-dimensional TLC. The data shown in panels A–D are the average of three experiments ± S.D.
Effects of Respiratory Deficiency on the Levels of Phospholipid Synthesis Enzyme Activities
In addition to PS synthase, the activities of other CDP-DAG pathway enzymes are elevated in the original cki1Δ eki1Δ (KS106) mutant (42). To address whether this regulation was due to the Kennedy pathway mutations or due to respiratory deficiency, the enzyme activity analyses were performed with the rho− (HCY8) mutant. The levels of CDP-DAG synthase (29%), PS decarboxylase (26%), PE methyltransferase (60%), and phospholipid methyltransferase (34%) activities were elevated in respiratory deficient cells when compared with the control (Fig. 11). On the other hand, the activities of PI synthase and choline kinase were not affected by respiratory deficiency (Fig. 11). The analyses of these activities in the new cki1Δ eki1Δ mutant (HCY7) showed that the Kennedy pathway mutations did not affect the activity levels of the CDP-DAG pathway enzymes.
FIGURE 11. Effects of the rho− mutation on the levels of phospholipid synthesis enzyme activities.
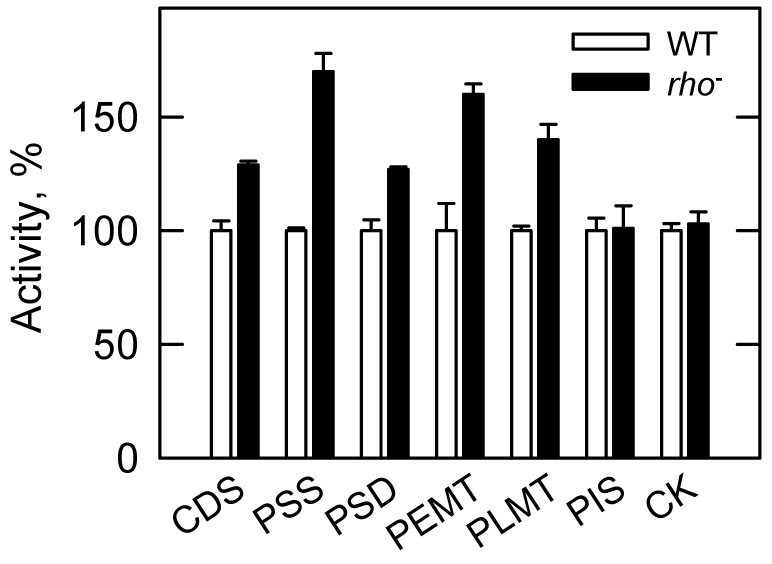
Wild type (WT, W303-1B) and rho− (HCY8) mutant cells were grown to the exponential phase (1×10⁷ cells/ml) of growth. The total membrane fraction was isolated and used for the assay of CDP-DAG synthase (CDS), PS synthase (PSS), PS decarboxylase (PSD), PE methyltransferase (PEMT), phospholipid methyltransferase (PLMT), and PI synthase (PIS). The cell extract was used for the assay of choline kinase (CK) activity. The specific activities (nmol/min/mg) of these enzymes from wild type cells were 0.92 ± 0.04, 2.2 ± 0.03, 0.41 ± 0.02, 0.4 ± 0.05, 0.64 ± 0.01, 2.5 ± 0.14, and 4.5 ± 0.14. Each data point represents the average of triplicate enzyme determinations from two independent experiments ± S.D.
Effects of Oxidative Stress and Respiratory Growth on CHO1 mRNA Decay/Stability
We questioned whether oxidative stress affected the rate of CHO1 mRNA decay. For this experiment, glucose-grown wild type cells were incubated with hydrogen peroxide, a treatment commonly used to induce oxidative stress (47, 48). This treatment did not affect the rate of CHO1 mRNA decay. We also questioned whether respiratory growth affected the decay of the CHO1 transcript. The rate of CHO1 mRNA decay of wild type cells grown with glycerol was not significantly different from cells grown with glucose.
DISCUSSION
In this work, we showed that the increased stability of CHO1 mRNA in the original cki1Δ eki1Δ (KS106) mutant was caused by respiratory deficiency associated with the loss of ethanolamine kinase (i.e., eki1Δ mutation) and not from the Kennedy pathway mutations per se. Decay analysis of CHO1 mRNA using respiration-deficient mutants (rho− and rho°), the cox4Δ mutant defective in the cytochrome c oxidase, and wild type cells treated with KCN (a cytochorome c oxidase inhibitor) confirmed that respiratory deficiency was responsible for the increase in the half-life of the CHO1 transcript. Moreover, the increased CHO1 mRNA stability in response to respiratory deficiency was responsible for increased PS synthase protein and activity, and the synthesis of PS in vivo.
It was not too surprising that the eki1Δ mutation gave rise to respiratory deficient cells. Phospholipid synthesis mutants (e.g., cho1, psd1Δ, opi3) commonly give rise to respiratory deficient petite colonies (13, 78, 79). Although it is not yet clear how the eki1Δ mutation caused respiratory deficiency, the reason for this general phenomenon may be attributed to the important roles that phospholipids (e.g., cardiolipin and PE) play in both the composition and function of mitochondrial membranes (78, 80–88).
Genome-wide analyses of gene expression in S. cerevisiae have shown that the levels of CHO1 mRNA decrease when cells transit from glucose-based fermentative to glycerol-based respiratory growth (89), and that CHO1 mRNA levels increase in response to oxygen deprivation (90). These findings indicate that a lack of mitochondrial respiration is a physiological condition that requires an increase in the abundance of the CHO1 transcript, supporting the role of mitochondrial respiration in the control of CHO1 expression. We showed in this study that the rate of CHO1 mRNA decay was not affected in glycerol-grown cells. Thus, the regulation that occurs when cells transit from fermentative to non-fermentative growth occurs at the level of transcription. Because respiratory deficiency may lead to oxidative stress, we questioned whether incubation with hydrogen peroxide affected the rate CHO1 mRNA stability. This stress condition did not affect the decay rate of CHO1 mRNA.
CHO1 mRNA was stabilized in mutants defective in deadenylation (ccr4Δ), mRNA decapping (dcp1), and the 5’-3’ exonuclease (xrn1). These results indicated that the CHO1 transcript is primarily degraded through the general 5’- 3’ mRNA decay pathway (71). The specific mechanisms and regulators that control the stabilization of CHO1 mRNA in response to respiratory deficiency are unknown. Given that CHO1 mRNA decays by the primary 5’-3’ decay pathway when cells are respiratory sufficient, it is reasonable to predict that the rate of deadenylation and/or decapping may be reduced when respiration is blocked. Extensive studies will be required to identify cis-acting elements in the transcript as well as components of the signal transduction system that lead from the respiratory defect to the mRNA stabilization response.
The activities of other CDP-DAG pathway enzymes (e.g., CDP-DAG synthase, PS decarboxylase, and the phospholipid methyltransferase enzymes) were also elevated in respiratory deficient cells. These results were similar to that found in the respiratory deficient cki1Δ eki1Δ (KS106) mutant (42). A reanalysis of these enzyme activities in the respiratory sufficient cki1Δ eki1Δ (HCY7) mutant confirmed that the regulation was solely due to the rho° mutation. The regulation of phospholipid synthesis enzymes in response to respiratory deficiency was not a universal response as the PI synthase and choline kinase activities were not affected by respiratory deficiency.
OLE1, which encodes the Δ-9 fatty acid desaturase, is another yeast gene of lipid metabolism whose expression is independently regulated at the levels of transcription and by mRNA stability (58, 91, 92). The OLE1 transcript is destabilized when cells are supplemented with unsaturated fatty acids (58, 91, 92). This fatty acid-regulated decay of OLE1 mRNA occurs through both the 5’- 3’ general pathway and via exosomal 3’- 5’ degradation activities (92). Interestingly, like CHO1 mRNA, OLE1 transcript levels are more abundant under oxygen-deprived conditions (92). It is not clear, however, whether this regulation is due to an increased rate of transcription, a decreased rate of mRNA decay or contributions from both regulatory systems.
In summary, we showed that the CHO1 transcript is degraded by the general mRNA decay pathway, and clarified that a block in the Kennedy pathway for phospholipid synthesis was not responsible for the regulation of PS synthase by mRNA stability. The rate of mRNA decay plays an important role in the control of gene expression (93). The half-life of an mRNA governs the number of times a transcript can be translated, which in turn governs the amount of protein that can be produced at a given rate of transcription (93). We hypothesize that S. cerevisiae cells compensated for the stress of respiratory deficiency by conserving the CHO1 transcript for translation to the PS synthase enzyme for the synthesis of PS. This work advances our understanding of PS synthase regulation and underscores the importance of mitochondrial respiration to the regulation of phospholipid synthesis in S. cerevisiae.
TABLE 2.
Plasmids used in this work
| Plasmid | Relevant characteristics | Source or Ref. |
|---|---|---|
| pRS414 | Single copy vector containing TRP1 | (99) |
| pRS416 | Single copy vector containing URA3 | (99) |
| YEp352 | Multicopy E. coli/yeast shuttle vector containing URA3 | (100) |
| pAS103 | Plasmid containing a 1.2 kb fragment of the CHO1 gene | (17) |
| pRIP1PGK | Plasmid containing a 1.0 kb fragment of the PGK1 gene | (101) |
| pKSK1 | EKI1 gene derived from PCR ligated into the SrfI site of pCRScript™ AMP SK(+) | (53) |
| pKSK2 | TRP1 disruption cassette from pJA52 ligated into the BglII/BsaBI sites of plasmid pKSK1 | (53) |
| pHS9 | EKI1gene from pKSK1 ligated into the PstI/SacI sites of YEp352 | This study |
| pHS12 | EKI1 gene from pKSK1 ligated into the BamHI/SacI site of pRS416 | This study |
Acknowledgments
We thank Roy Parker, Miriam Greenberg, and William Dowhan for mutants defective in the mRNA decay pathway, respiratory deficient strains, and the cox4Δ mutant, respectively. Dawn Brasaemle is acknowledged for the use of the Nikon Eclipse E800 microscope, and we thank Jeanelle Morgan for assistance with fluorescence microscopy. Gil-Soo Han, Charles Martin, and Robert Ramirez are acknowledged for helpful discussions during the preparation of this manuscript.
Footnotes
This work was supported in part by United States Public Health Service, National Institutes of Health Grant GM-50679.
The abbreviations used are: PS, phosphatidylserine; PE, phosphatidylethanolamine; PC, phosphatidylcholine; PI, phosphatidylinositol; PA, phosphatidate; CDP-DAG, CDP-diacylglycerol.
The S. cerevisiae PS synthase enzyme should not be confused with the PS synthase enzyme from mammalian cells that catalyzes an exchange reaction between PE or PC with serine (94).
REFERENCES
- 1.Letts VA, Klig LS, Bae-Lee M, Carman GM, Henry SA. Proc.Natl.Acad.Sci.USA. 1983;80:7279–7283. doi: 10.1073/pnas.80.23.7279. [DOI] [PMC free article] [PubMed] [Google Scholar]
- 2.Nikawa J, Tsukagoshi Y, Kodaki T, Yamashita S. Eur.J.Biochem. 1987;167:7–12. doi: 10.1111/j.1432-1033.1987.tb13297.x. [DOI] [PubMed] [Google Scholar]
- 3.Kiyono K, Miura K, Kushima Y, Hikiji T, Fukushima M, Shibuya I, Ohta A. J.Biochem. 1987;102:1089–1100. doi: 10.1093/oxfordjournals.jbchem.a122147. [DOI] [PubMed] [Google Scholar]
- 4.Carman GM, Zeimetz GM. J.Biol.Chem. 1996;271:13293–13296. doi: 10.1074/jbc.271.23.13293. [DOI] [PubMed] [Google Scholar]
- 5.Carman GM, Henry SA. Prog.Lipid Res. 1999;38:361–399. doi: 10.1016/s0163-7827(99)00010-7. [DOI] [PubMed] [Google Scholar]
- 6.Yamashita S, Nikawa J. Biochim.Biophys.Acta. 1997;1348:228–235. doi: 10.1016/s0005-2760(97)00102-1. [DOI] [PubMed] [Google Scholar]
- 7.Natter K, Leitner P, Faschinger A, Wolinski H, McCraith S, Fields S, Kohlwein SD. Mol.Cell Proteomics. 2005;4:662–672. doi: 10.1074/mcp.M400123-MCP200. [DOI] [PubMed] [Google Scholar]
- 8.Bae-Lee M, Carman GM. J.Biol.Chem. 1984;259:10857–10862. [PubMed] [Google Scholar]
- 9.Rattray JB, Schibeci A, Kidby DK. Bacteriol.Reviews. 1975;39:197–231. doi: 10.1128/br.39.3.197-231.1975. [DOI] [PMC free article] [PubMed] [Google Scholar]
- 10.Henry SA. In: The molecular biology of the yeast Saccharomyces. Metabolism and gene expression. Strathern JN, Jones EW, Broach JR, editors. Cold Spring Harbor: Cold Spring Harbor Laboratory; 1982. pp. 101–158. [Google Scholar]
- 11.Paltauf F, Kohlwein SD, Henry SA. In: The Molecular and Cellular Biology of the Yeast Saccharomyces: Gene Expression. Jones EW, Pringle JR, Broach JR, editors. Cold Spring Harbor, NY: Cold Spring Harbor Laboratory; 1992. pp. 415–500. [Google Scholar]
- 12.Atkinson K, Fogel S, Henry SA. J.Biol.Chem. 1980;255:6653–6661. [PubMed] [Google Scholar]
- 13.Atkinson KD, Jensen B, Kolat AI, Storm EM, Henry SA, Fogel S. J.Bacteriol. 1980;141:558–564. doi: 10.1128/jb.141.2.558-564.1980. [DOI] [PMC free article] [PubMed] [Google Scholar]
- 14.Morash SC, McMaster CR, Hjelmstad RH, Bell RM. J.Biol.Chem. 1994;269:28769–28776. [PubMed] [Google Scholar]
- 15.McGee TP, Skinner HB, Whitters EA, Henry SA, Bankaitis VA. J.Cell Biol. 1994;124:273–287. doi: 10.1083/jcb.124.3.273. [DOI] [PMC free article] [PubMed] [Google Scholar]
- 16.McMaster CR, Bell RM. J.Biol.Chem. 1994;269:28010–28016. [PubMed] [Google Scholar]
- 17.McDonough VM, Buxeda RJ, Bruno MEC, Ozier-Kalogeropoulos O, Adeline M-T, McMaster CR, Bell RM, Carman GM. J.Biol.Chem. 1995;270:18774–18780. doi: 10.1074/jbc.270.32.18774. [DOI] [PubMed] [Google Scholar]
- 18.Ostrander DB, O'Brien DJ, Gorman JA, Carman GM. J.Biol.Chem. 1998;273:18992–19001. doi: 10.1074/jbc.273.30.18992. [DOI] [PubMed] [Google Scholar]
- 19.Patton-Vogt JL, Griac P, Sreenivas A, Bruno V, Dowd S, Swede MJ, Henry SA. J.Biol.Chem. 1997;272:20873–20883. doi: 10.1074/jbc.272.33.20873. [DOI] [PubMed] [Google Scholar]
- 20.Xie ZG, Fang M, Rivas MP, Faulkner AJ, Sternweis PC, Engebrecht J, Bankaitis VA. Proc.Natl.Acad.Sci.USA. 1998;95:12346–12351. doi: 10.1073/pnas.95.21.12346. [DOI] [PMC free article] [PubMed] [Google Scholar]
- 21.Chen M, Hancock LC, Lopes JM. Biochim.Biophys.Acta. 2007;1771:310–321. doi: 10.1016/j.bbalip.2006.05.017. [DOI] [PubMed] [Google Scholar]
- 22.Hromy JM, Carman GM. J.Biol.Chem. . 1986;261:15572–15576. [PubMed] [Google Scholar]
- 23.Bae-Lee M, Carman GM. J.Biol.Chem. 1990;265:7221–7226. [PubMed] [Google Scholar]
- 24.Oshiro J, Rangaswamy S, Chen X, Han G-S, Quinn JE, Carman GM. J.Biol.Chem. 2000;275:40887–40896. doi: 10.1074/jbc.M008144200. [DOI] [PubMed] [Google Scholar]
- 25.Kelley MJ, Bailis AM, Henry SA, Carman GM. J.Biol.Chem. 1988;263:18078–18085. [PubMed] [Google Scholar]
- 26.Kinney AJ, Carman GM. Proc.Nat.Acad.Sci.USA. 1988;85:7962–7966. doi: 10.1073/pnas.85.21.7962. [DOI] [PMC free article] [PubMed] [Google Scholar]
- 27.Kinney AJ, Bae-Lee M, Singh Panghaal S, Kelley MJ, Gaynor PM, Carman GM. J.Bacteriol. 1990;172:1133–1136. doi: 10.1128/jb.172.2.1133-1136.1990. [DOI] [PMC free article] [PubMed] [Google Scholar]
- 28.Klig LS, Homann MJ, Carman GM, Henry SA. J.Bacteriol. 1985;162:1135–1141. doi: 10.1128/jb.162.3.1135-1141.1985. [DOI] [PMC free article] [PubMed] [Google Scholar]
- 29.Poole MA, Homann MJ, Bae-Lee M, Carman GM. J.Bacteriol. 1986;168:668–672. doi: 10.1128/jb.168.2.668-672.1986. [DOI] [PMC free article] [PubMed] [Google Scholar]
- 30.Bailis AM, Poole MA, Carman GM, Henry SA. Mol.Cell.Biol. 1987;7:167–176. doi: 10.1128/mcb.7.1.167. [DOI] [PMC free article] [PubMed] [Google Scholar]
- 31.Bailis AM, Lopes JM, Kohlwein SD, Henry SA. Nucleic Acids Res. 1992;20:1411–1418. doi: 10.1093/nar/20.6.1411. [DOI] [PMC free article] [PubMed] [Google Scholar]
- 32.Iwanyshyn WM, Han GS, Carman GM. J.Biol.Chem. 2004;279:21976–21983. doi: 10.1074/jbc.M402047200. [DOI] [PubMed] [Google Scholar]
- 33.Homann MJ, Poole MA, Gaynor PM, Ho C-T, Carman GM. J.Bacteriol. 1987;169:533–539. doi: 10.1128/jb.169.2.533-539.1987. [DOI] [PMC free article] [PubMed] [Google Scholar]
- 34.Lamping E, Luckl J, Paltauf F, Henry SA, Kohlwein SD. Genetics. 1995;137:55–65. doi: 10.1093/genetics/137.1.55. [DOI] [PMC free article] [PubMed] [Google Scholar]
- 35.Greenberg ML, Lopes JM. Microbiol.Rev. 1996;60:1–20. doi: 10.1128/mr.60.1.1-20.1996. [DOI] [PMC free article] [PubMed] [Google Scholar]
- 36.Henry SA, Patton-Vogt JL. Prog.Nucleic Acid Res. 1998;61:133–179. doi: 10.1016/s0079-6603(08)60826-0. [DOI] [PubMed] [Google Scholar]
- 37.Loewen CJR, Gaspar ML, Jesch SA, Delon C, Ktistakis NT, Henry SA, Levine TP. Science. 2004;304:1644–1647. doi: 10.1126/science.1096083. [DOI] [PubMed] [Google Scholar]
- 38.Santos-Rosa H, Leung J, Grimsey N, Peak-Chew S, Siniossoglou S. EMBO J. 2005;24:1931–1941. doi: 10.1038/sj.emboj.7600672. [DOI] [PMC free article] [PubMed] [Google Scholar]
- 39.Han G-S, Wu W-I, Carman GM. J Biol.Chem. 2006;281:9210–9218. doi: 10.1074/jbc.M600425200. [DOI] [PMC free article] [PubMed] [Google Scholar]
- 40.Carman GM, Han GS. Trends Biochem Sci. 2006;31:694–699. doi: 10.1016/j.tibs.2006.10.003. [DOI] [PMC free article] [PubMed] [Google Scholar]
- 41.O'Hara L, Han GS, Peak-Chew S, Grimsey N, Carman GM, Siniossoglou S. J Biol.Chem. 2006;281:34537–34548. doi: 10.1074/jbc.M606654200. [DOI] [PMC free article] [PubMed] [Google Scholar]
- 42.Choi HS, Sreenivas A, Han G-S, Carman GM. J.Biol.Chem. 2004;279:12081–12087. doi: 10.1074/jbc.M400297200. [DOI] [PubMed] [Google Scholar]
- 43.Herrick D, Parker R, Jacobson A. Mol Cell Biol. 1990;10:2269–2284. doi: 10.1128/mcb.10.5.2269. [DOI] [PMC free article] [PubMed] [Google Scholar]
- 44.Rose MD, Winston F, Heiter P. Methods in Yeast Genetics: A Laboratory Course Manual. Cold Spring Harbor, N.Y.: Cold Spring Harbor Laboratory Press; 1990. [Google Scholar]
- 45.Sambrook J, Fritsch EF, Maniatis T. Molecular Cloning, A Laboratory Manual. 2nd Ed. Cold Spring Harbor, N.Y.: Cold Spring Harbor Laboratory; 1989. [Google Scholar]
- 46.Culbertson MR, Henry SA. Genetics. 1975;80:23–40. doi: 10.1093/genetics/80.1.23. [DOI] [PMC free article] [PubMed] [Google Scholar]
- 47.Jamieson DJ. J.Bacteriol. 1992;174:6678–6681. doi: 10.1128/jb.174.20.6678-6681.1992. [DOI] [PMC free article] [PubMed] [Google Scholar]
- 48.Jamieson DJ, Rivers SL, Stephen DW. Microbiology. 1994;140:3277–3283. doi: 10.1099/13500872-140-12-3277. [DOI] [PubMed] [Google Scholar]
- 49.Kaiser C, Michaelis S, Mitchell A. Methods in Yeast Genetics: A Laboratory Course Manual. Cold Spring Harbor, N.Y.: Cold Spring Harbor Laboratory Press; 1994. [Google Scholar]
- 50.Ito H, Yasuki F, Murata K, Kimura A. J.Bacteriol. 1983;153:163–168. doi: 10.1128/jb.153.1.163-168.1983. [DOI] [PMC free article] [PubMed] [Google Scholar]
- 51.Innis MA, Gelfand DH. In: PCR Protocols. A Guide to Methods and Applications. Innis MA, Gelfand DH, Sninsky JJ, White TJ, editors. San Diego: Academic Press, Inc.; 1990. pp. 3–12. [Google Scholar]
- 52.Rothstein R. Methods Enzymol. 1991;194:281–301. doi: 10.1016/0076-6879(91)94022-5. [DOI] [PubMed] [Google Scholar]
- 53.Kim K, Kim K-H, Storey MK, Voelker DR, Carman GM. J.Biol.Chem. 1999;274:14857–14866. doi: 10.1074/jbc.274.21.14857. [DOI] [PubMed] [Google Scholar]
- 54.Elabbadi N, Ancelin ML, Vial HJ. Biochem J. 1997;324:435–445. doi: 10.1042/bj3240435. [DOI] [PMC free article] [PubMed] [Google Scholar]
- 55.Kersting MC, Choi HS, Carman GM. J Biol.Chem. 2004;279:35353–35359. doi: 10.1074/jbc.M405704200. [DOI] [PubMed] [Google Scholar]
- 56.Schmitt ME, Brown TA, Trumpower BL. Nucleic Acids Res. 1990;18:3091–3092. doi: 10.1093/nar/18.10.3091. [DOI] [PMC free article] [PubMed] [Google Scholar]
- 57.Ausubel FM, Brent R, Kingston RE, Moore DD, Seidman JG, Smith JA, Struhl K. Current Protocols in Molecular Biology. New York: John Wiley & Sons, Inc.; 1993. [Google Scholar]
- 58.Gonzalez CI, Martin CE. J.Biol.Chem. 1996;271:25801–25809. doi: 10.1074/jbc.271.42.25801. [DOI] [PubMed] [Google Scholar]
- 59.Laemmli UK. Nature (London) 1970;227:680–685. doi: 10.1038/227680a0. [DOI] [PubMed] [Google Scholar]
- 60.Haid A, Suissa M. Methods Enzymol. 1983;96:192–205. doi: 10.1016/s0076-6879(83)96017-2. [DOI] [PubMed] [Google Scholar]
- 61.Oshiro J, Han G-S, Iwanyshyn WM, Conover K, Carman GM. J.Biol.Chem. 2003;278:31495–31503. doi: 10.1074/jbc.M305452200. [DOI] [PubMed] [Google Scholar]
- 62.Bradford MM. Anal.Biochem. 1976;72:248–254. doi: 10.1016/0003-2697(76)90527-3. [DOI] [PubMed] [Google Scholar]
- 63.Carman GM, Kelley MJ. Methods Enzymol. 1992;209:242–247. doi: 10.1016/0076-6879(92)09030-7. [DOI] [PubMed] [Google Scholar]
- 64.Carman GM, Bae-Lee M. Methods Enzymol. 1992;209:298–305. doi: 10.1016/0076-6879(92)09037-4. [DOI] [PubMed] [Google Scholar]
- 65.Carson MA, Emala M, Hogsten P, Waechter CJ. J.Biol.Chem. 1984;259:6267–6273. [PubMed] [Google Scholar]
- 66.Lamping E, Kohlwein SD, Henry SA, Paltauf F. J.Bacteriol. 1991;173:6432–6437. doi: 10.1128/jb.173.20.6432-6437.1991. [DOI] [PMC free article] [PubMed] [Google Scholar]
- 67.Gaynor PM, Carman GM. Biochim.Biophys.Acta. 1990;1045:156–163. doi: 10.1016/0005-2760(90)90145-n. [DOI] [PubMed] [Google Scholar]
- 68.Carman GM, Fischl AS. Methods Enzymol. 1992;209:305–312. doi: 10.1016/0076-6879(92)09038-5. [DOI] [PubMed] [Google Scholar]
- 69.Porter TJ, Kent C. Methods Enzymol. 1992;209:134–146. doi: 10.1016/0076-6879(92)09017-w. [DOI] [PubMed] [Google Scholar]
- 70.Bligh EG, Dyer WJ. Can.J.Biochem.Physiol. 1959;37:911–917. doi: 10.1139/o59-099. [DOI] [PubMed] [Google Scholar]
- 71.Parker R, Song H. Nat.Struct.Mol.Biol. 2004;11:121–127. doi: 10.1038/nsmb724. [DOI] [PubMed] [Google Scholar]
- 72.Traven A, Wong JM, Xu D, Sopta M, Ingles CJ. J.Biol.Chem. 2001;276:4020–4027. doi: 10.1074/jbc.M006807200. [DOI] [PubMed] [Google Scholar]
- 73.Meskauskas A, Ksenzenko V, Shlyapnikov M, Kryukov V, Citavicius D. FEBS Lett. 1985;182:413–414. doi: 10.1016/0014-5793(85)80344-6. [DOI] [PubMed] [Google Scholar]
- 74.Cause GF, Kusovkova LI. Experientia. 1970;26:209–210. doi: 10.1007/BF01895589. [DOI] [PubMed] [Google Scholar]
- 75.Garett RH, Grisham CM. Biochemistry. SECOND. Saunders College Publishing; 1999. Ref Type: Generic. [Google Scholar]
- 76.Mootha VK, Wei MC, Buttle KF, Scorrano L, Panoutsakopoulou V, Mannella CA, Korsmeyer SJ. EMBO J. 2001;20:661–671. doi: 10.1093/emboj/20.4.661. [DOI] [PMC free article] [PubMed] [Google Scholar]
- 77.Dowhan W, Bibus CR, Schatz G. EMBO J. 1985;4:179–184. doi: 10.1002/j.1460-2075.1985.tb02334.x. [DOI] [PMC free article] [PubMed] [Google Scholar]
- 78.Birner R, Burgermeister M, Schneiter R, Daum G. Mol.Biol.Cell. 2001;12:997–1007. doi: 10.1091/mbc.12.4.997. [DOI] [PMC free article] [PubMed] [Google Scholar]
- 79.Greenberg ML, Hubbell S, Lam C. Mol.Cell.Biol. 1988;8:4773–4779. doi: 10.1128/mcb.8.11.4773. [DOI] [PMC free article] [PubMed] [Google Scholar]
- 80.Li G, Chen S, Thompson MN, Greenberg ML. Biochim.Biophys.Acta. 2007;1771:432–441. doi: 10.1016/j.bbalip.2006.06.007. [DOI] [PubMed] [Google Scholar]
- 81.Gohil VM, Hayes P, Matsuyama S, Schagger H, Schlame M, Greenberg ML. J Biol.Chem. 2004;279:42612–42618. doi: 10.1074/jbc.M402545200. [DOI] [PubMed] [Google Scholar]
- 82.Zhong Q, Gohil VM, Ma L, Greenberg ML. J Biol.Chem. 2004;279:32294–32300. doi: 10.1074/jbc.M403275200. [DOI] [PubMed] [Google Scholar]
- 83.Schlame M, Rua D, Greenberg ML. Prog.Lipid Res. 2000;39:257–288. doi: 10.1016/s0163-7827(00)00005-9. [DOI] [PubMed] [Google Scholar]
- 84.Su X, Dowhan W. Mol.Cell Biol. 2006;26:743–753. doi: 10.1128/MCB.26.3.743-753.2006. [DOI] [PMC free article] [PubMed] [Google Scholar]
- 85.Zhang M, Mileykovskaya E, Dowhan W. J Biol.Chem. 2005;280:29403–29408. doi: 10.1074/jbc.M504955200. [DOI] [PMC free article] [PubMed] [Google Scholar]
- 86.McMillin JB, Dowhan W. Biochim.Biophys.Acta. 2002;1585:97–107. doi: 10.1016/s1388-1981(02)00329-3. [DOI] [PubMed] [Google Scholar]
- 87.Ostrander DB, Zhang M, Mileykovskaya E, Rho M, Dowhan W. J Biol.Chem. 2001;276:25262–25272. doi: 10.1074/jbc.M103689200. [DOI] [PubMed] [Google Scholar]
- 88.Gohil VM, Thompson MN, Greenberg ML. J Biol.Chem. 2005;280:35410–35416. doi: 10.1074/jbc.M505478200. [DOI] [PubMed] [Google Scholar]
- 89.Roberts GG, Hudson AP. Mol.Genet.Genomics. 2006;276:170–186. doi: 10.1007/s00438-006-0133-9. [DOI] [PubMed] [Google Scholar]
- 90.Lai LC, Kosorukoff AL, Burke PV, Kwast KE. Eukaryot.Cell. 2006;5:1468–1489. doi: 10.1128/EC.00107-06. [DOI] [PMC free article] [PubMed] [Google Scholar]
- 91.Vemula M, Kandasamy P, Oh CS, Chellappa R, Gonzalez CI, Martin CE. J.Biol.Chem. 2003;278:45269–45279. doi: 10.1074/jbc.M308812200. [DOI] [PubMed] [Google Scholar]
- 92.Martin CE, Oh CS, Jiang Y. Biochim.Biophys.Acta. 2007;1771:271–285. doi: 10.1016/j.bbalip.2006.06.010. [DOI] [PubMed] [Google Scholar]
- 93.Guhaniyogi J, Brewer G. Gene. 2001;265:11–23. doi: 10.1016/s0378-1119(01)00350-x. [DOI] [PubMed] [Google Scholar]
- 94.Vance JE. Trends Biochem Sci. 1998;23:423–428. doi: 10.1016/s0968-0004(98)01297-3. [DOI] [PubMed] [Google Scholar]
- 95.Hatfield L, Beelman CA, Stevens A, Parker R. Mol.Cell Biol. 1996;16:5830–5838. doi: 10.1128/mcb.16.10.5830. [DOI] [PMC free article] [PubMed] [Google Scholar]
- 96.Tucker M, Valencia-Sanchez MA, Staples RR, Chen J, Denis CL, Parker R. Cell. 2001;104:377–386. doi: 10.1016/s0092-8674(01)00225-2. [DOI] [PubMed] [Google Scholar]
- 97.Thomas B, Rothstein R. Cell. 1989;56:619–630. doi: 10.1016/0092-8674(89)90584-9. [DOI] [PubMed] [Google Scholar]
- 98.van Loon AP, Van Eijk E, Grivell LA. EMBO J. 1983;2:1765–1770. doi: 10.1002/j.1460-2075.1983.tb01655.x. [DOI] [PMC free article] [PubMed] [Google Scholar]
- 99.Sikorski RS, Hieter P. Genetics. 1989;122:19–27. doi: 10.1093/genetics/122.1.19. [DOI] [PMC free article] [PubMed] [Google Scholar]
- 100.Hill JE, Myers AM, Koerner TJ, Tzagoloff A. Yeast. 1986;2:163–167. doi: 10.1002/yea.320020304. [DOI] [PubMed] [Google Scholar]
- 101.He F, Peltz SW, Donahue JL, Rosbash M, Jacobson A. Proc.Natl.Acad.Sci.U S A. 1993;90:7034–7038. doi: 10.1073/pnas.90.15.7034. [DOI] [PMC free article] [PubMed] [Google Scholar]