

Abstract
Access to visual awareness is often determined by covert, voluntary deployments of visual attention. Voluntary orienting without eye movements requires decoupling attention from the locus of fixation, a shift to the desired location and maintenance of attention at that location. We used event-related fMRI to dissociate these components while observers shifted attention among three streams of letters and digits, one located at fixation and two in the periphery. Compared to holding attention at the current location, shifting attention between the peripheral locations was associated with transient increases in neural activity in the superior parietal lobule (SPL) and frontal eye fields (FEF), as in previous studies. The supplementary eye fields (SEF) and separate portions of SPL and FEF were more active for decoupling attention from fixation than for shifting attention to a new location. Large segments of precentral sulcus (PreCS) and posterior parietal cortex (PPC) were more active when attention was maintained in the periphery than when it was maintained at fixation. We conclude that distinct subcomponents of the dorsal frontoparietal network initiate redeployments of covert attention to new locations and disengage attention from fixation, while sustained activity in lateral regions of PPC and PreCS represents sustained states of peripheral attention.
Voluntary selective attention filters the sensory array according to the behavioral relevance of features and objects in the scene (e.g., Desimone and Duncan, 1995; Yantis, 2000; Luck & Vecera, 2002). Observers often explore the visual scene by moving their eyes; however, eye movements are relatively slow (~200ms/saccade). Therefore, search efficiency is greatly improved when rapid covert shifts of attention are directed to nonfoveal regions of the visual field to select relevant stimuli for future fixations (Wolfe, 1998). Deploying covert attention to locations and objects in the visual field is thought to increase search efficiency by resolving competition among cortical representations in cluttered scenes (Desimone & Duncan, 1995; Serences & Yantis, 2006) thereby allowing for the efficient selection of gaze targets. This notion is supported by studies demonstrating that the deployment of covert visual attention modulates activity in sensory cortex by increasing the strength and/or synchrony of neural activity for attended compared to ignored information (e.g., Moran & Desimone, 1985; Motter, 1993; Kastner et al., 1998; Tootell et al., 1998; O’Craven et al., 1999; Fries et al., 2001; Womelsdorf et al., 2006). Voluntary deployments of visual attention are thought to be controlled by subregions of the frontal eye fields (FEF), dorsomedial prefrontal cortex, and posterior parietal cortex (PPC) (Kastner & Ungerleider, 2000; Culham & Kanwisher, 2001; Corbetta & Shulman, 2002; Moore et al., 2003; Serences & Yantis, 2006).
Investigations of voluntary attentional control in humans using functional magnetic resonance imaging (fMRI) have revealed increased cortical activity in PPC and FEF when attention is shifted to a peripheral (nonfoveal) location following an instructional cue presented at fixation (e.g., Corbetta et al., 1998; Corbetta et al., 2000; Hopfinger et al., 2000; Giesbrecht et al., 2003). The activation observed in these studies is likely evoked by a combination of potentially distinct functions, including decoupling attention from fixation, shifting attention to the periphery, and maintaining attention in the periphery until the target appears (e.g., Posner et al., 1984; Giesbrecht & Mangun, 2005).
Other studies have examined covert shifts of attention between peripheral locations, when the loci of attention and fixation are continuously decoupled (Vandenberghe et al., 2001; Yantis et al. 2002). For example, Yantis et al. (2002) had observers shift attention between two peripheral locations while continually maintaining central fixation. Transient increases in cortical activity within the superior parietal lobule (SPL) were time-locked to the initiation of attention shifts. However, because attention was always decoupled from fixation, these results do not reveal the mechanisms responsible for decoupling attention from fixation.
The present study addressed this gap by requiring observers to shift attention among three locations: one at fixation and two in the periphery. This paradigm allowed us to investigate the potentially distinct operations of (a) decoupling attention from fixation, (b) maintaining attention at a nonfoveal location, (c) shifting attention between nonfoveal locations, and (d) returning attention to fixation.
Materials and Methods
Subjects
Sixteen neurologically intact young adults were recruited for this study. All provided informed consent approved by the Institutional Review Board of The Johns Hopkins Medical Institutions. Data from two subjects were excluded because of a failure to maintain fixation and poor behavioral performance (accuracy < %50), respectively. Data from the remaining 14 participants (ages 19–35, 8 women) were included in the analysis.
Behavioral Task
Alphanumeric characters were rendered in black on a white background. Twelve rapid serial visual presentation (RSVP) streams were arranged on a computer screen as shown in Figure 1. Each stream consisted of characters that subtended 1.04 × 1.28 degrees of visual angle from a viewing distance in the scanner of 65 cm. The characters in each stream changed identity simultaneously every 250 ms (no temporal gap). One target stream was located at fixation; two peripheral target streams were centered 4 degrees from fixation and 4 degrees apart, forming an equilateral triangle. Each target stream was flanked by distractor streams on three sides separated by 0.5 degrees, edge to edge. The distractor streams provided visual competition and thereby maximized attention effects.
Figure 1.
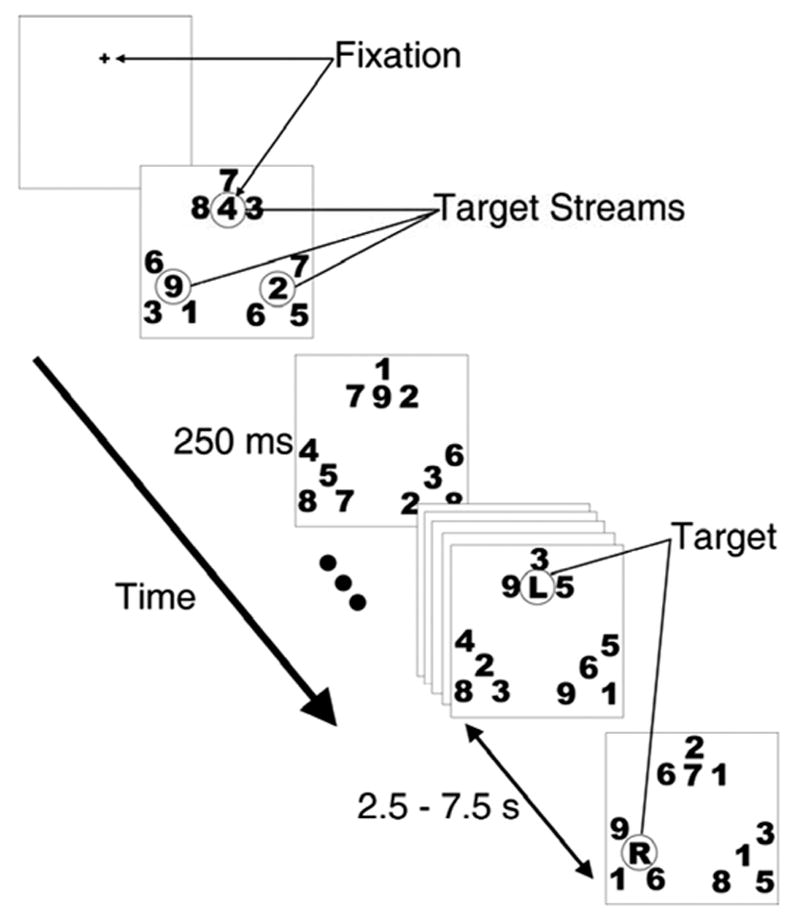
Rapid Serial Visual Presentation (RSVP) task. A fixation cross appeared for 1.5 seconds. Following the offset of the fixation cross, the three target and nine distractor streams appeared. One of the target streams appeared at fixation. Digits changed identity in each stream synchronously every 250 ms. The first target item, an “L”, a “C” or an “R”, appeared at fixation. Subjects pressed a button when a target was detected in the attended stream. The identity of the target cued the stream that should be attended next, requiring either a shift of attention or a hold. After a variable delay of 2.5 to 7.5 seconds (equaling 6 to 30 successive 250-ms stimulus frames), the next target appeared in the attended stream.
Subjects began each experimental run by attending to the central (fixated) target stream. The position of this stream was indicated by a fixation cross for 1.5 seconds prior to the onset of the RSVP streams. Subjects maintained fixation on this stream throughout the run (see below for eye tracking methods). When a letter appeared in the currently attended digit stream, the observer pressed a button to indicate that they had seen the letter (the letter did not have to be identified overtly in the response). The identity of the letter instructed subjects either to hold attention at that location or to shift to a new location. The letters were either “L,” “C,” or “R”; they indicated that the subject should now attend to the target stream in the left, center, or right location, respectively. If the letter indicated the currently attended location (for example, an “L” appearing in the attended lower left stream), attention was to be maintained at that location (a hold event). All other cue/stream combinations required a spatial attention shift (a shift event).
The nine possible event types included 3 hold events (hold left, center, and right) and 6 shift events (left-to-center, left-to-right, center-to-left, center-to-right, right-to-left and right-to-center). We denote the nine event types with two letters: the first letter indicates the location in which the target appeared (and to which attention was initially directed), and the second the location to which attention had to be directed (which was also the identity of the target letter). Thus, LL, CC, and RR represent the three hold events; LC and RC represent shifts from the left and right stream to the center; CL and CR represent shifts from the center to the left and right; and LR and RL represent shifts from left to right and from right to left, respectively.
Subjects participated in six to nine runs of the main experimental task. Each run lasted 290 seconds. A single run consisted of six seconds of fixation, 2.5 seconds of instruction (“Fixate and attend”), 1.5 seconds of fixation prior to stimulus onset, 272 seconds of the task, and 8 seconds of fixation at the end of the scan.
Although nontarget digits changed identity every 250 ms, the target letters were separated by an inter-target interval (ITI) that varied randomly between 2.5 and 7.5 seconds at 1-second intervals. Each interval appeared equally often in each run. The nine event types were counterbalanced with the 6 inter-target intervals, such that each event type was preceded by each of the ITIs once per run. This resulted in 54 target events during each run. Thus each event type occurred from 36 to 54 times for a given observer, depending on how many runs they completed. When a target was missed, that event was not included in the neuroimaging data analysis. Furthermore, subjects were instructed to maintain attention where it was until another target was detected there, even if they thought they had missed a target and were attending to the wrong stream. This could result in a string of missed targets (none of which would be included in the data analysis) until the task and the subject’s attention were in sync again.
Eye Tracking
To ensure that subjects were maintaining fixation and performing covert, rather than overt, shifts of attention, pupil position was monitored during the functional scans using a custom-built infrared camera and shielded closed-circuit video system. Data were recorded using the ViewPoint EyeTracker software (Arrington Research, Scottsdale, Arizona). Eleven of the fourteen subjects performed an additional run of the behavioral task (in which functional data were not acquired), during which they moved their eyes to the target positions in response to the target identity, rather than maintaining fixation and covertly shifting their attention as in the experimental runs. These eye-movement runs provided data on deliberate eye movements to the target stream locations, which formed a basis of comparison with the runs in which subjects were instructed to maintain fixation. For the purposes of counting the number of saccades made by each subject in each run, a saccade was defined as a the pupil position deviating from fixation by more than one degree for at least 200 ms.
Imaging Protocol
Imaging data were collected on a Philips 3T Intera scanner equipped with a SENSE (MRI Devices, Inc., Waukesha, Wisconsin) parallel-imaging head coil. Anatomical images were acquired using an MPRAGE T1-weighted sequence optimized for gray-white matter contrast, yielding images with a 1 mm isovoxel resolution (TR = 8.1 ms, TE = 3.7 ms, FA = 8°, time between inversions = 3 sec; inversion time =847 ms, SENSE factor = 2). Whole brain echoplanar functional images (EPI) were acquired in 30 transverse slices (TR = 2000 ms, TE = 30 ms, FA = 70°, matrix = 80 × 80, FOV = 240 mm, slice thickness = 3 mm, 1 mm gap, SENSE factor = 2). The data were analyzed using Brain Voyager v4.96 and Brain Voyager QX software (Brain Innovation, Maastricht, The Netherlands), and Matlab 6.5 software (MathWorks, Natick, Massachusetts). The images were slice-time and motion corrected and a high pass temporal filter was applied (3 cycles/run). The images were then spatially smoothed with a 4mm (FWHM) Gaussian kernel before being Talairach transformed and resampled into 3 mm isotropic voxels.
Separate model time series were created for each subject by convolving a 1-sec boxcar marking the temporal location of each target letter appearance with a gamma function (delta = 2.5, tau = 1.25, Boynton et al., 1996). These model time series were then used to compute a random effects general linear model (GLM) of the BOLD time course in each voxel. Except where noted in the Results, a minimum individual voxel threshold of p < 0.05 was adopted and a minimum cluster size of 44 contiguous voxels (1.188 mL) was used to correct for multiple comparisons (determined using the program AlphaSim (B.D. Ward, http://afni.nimh.nih.gov/afni/docpdf/ALPHASim.pdf), which was used to run 2000 Monte Carlo simulations that took into account the entire EPI acquisition matrix). The GLM produced beta weights for each voxel that represent the estimated magnitude of the BOLD response evoked by each of the nine event types. We excluded runs in which 50% or more of the events were missed; one run (out of six) was excluded from the data of each of three subjects, and four runs (out of nine) from one subject. It should be noted that the one subject who was excluded entirely from the analysis had poor performance on half of his scans, such that only three scans could have been included in the final analysis. All other runs were included in the analysis. As stated earlier, missed events were not included in the regressors.
Event-Related Time course Analysis
The event-related time course of BOLD activity within an activation region was generated by averaging the BOLD signal within a time window extending from 6 seconds prior to the onset of a target event to 16 seconds after the event, for all occurrences of that event. The percent signal change at each time point represents the raw BOLD signal at that time compared to the average of the BOLD signal level for the entire run (excluding periods of fixation at the beginning and end of each run, for a total of 136 TRs), averaged across all voxels within a region. Because these time courses are drawn from regions that showed a significant response to a given contrast, they will necessarily show the same pattern of activity as was shown by the GLM. They are included for illustrative purposes.
Results
Behavioral Results
Average detection performance across all subjects was 92% (range: 88%–98%), for the runs that were included in the functional analysis. Detection accuracy for each event type was computed across subjects; the mean accuracy and standard error of the mean are shown in Table 1. A 3×3 ANOVA (with factors target location and target identity) revealed a significant main effect of location (F(2,26) = 7.39, p < 0.003; all F tests reported in this article are corrected for sphericity). There was, however, no main effect of identity (F(2,26) = 2.34, p > 0.11), nor was there a significant interaction (F(4,52) = 1.01). A post-hoc contrast (using Scheffe’s correction) revealed that the main effect of location was driven by the higher accuracy at the center position compared to the other two positions (F(1,13) = 9.31, p < 0.01); however, the overall effect of location accounted for less than 2% of the total variance (ω2 = 0.019) in the behavioral data.
Table 1.
Mean Target Detection probability (and SEM) for Behavioral Task
| Target Location | Target Identity | |||
|---|---|---|---|---|
| L | C | R | Overall | |
| Left | 0.90 (0.03) | 0.89 (0.02) | 0.92 (0.02) | 0.90 (0.02) |
| Center | 0.94 (0.02) | 0.96 (0.01) | 0.95 (0.01) | 0.95 (0.01) |
| Right | 0.92 (0.01) | 0.90 (0.03) | 0.94 (0.01) | 0.92 (0.01) |
| Overall | 0.92 (0.01) | 0.91 (0.01) | 0.94 (0.01) | |
Neuroimaging Results
Contralateral Modulation of Extrastriate Cortex
To assess the effects of attention on the magnitude of neural activity in visual cortex, we contrasted hold left (LL) with hold right (RR) regressors. This analysis revealed that left and right extrastriate cortices in the occipital lobe were more active when attention was maintained in the contralateral visual hemifield (Figure 2 a). This confirms that attention was directed to the peripheral stream locations according to task instructions, and corroborates previous demonstrations of strong attentional modulations in extrastriate cortex (e.g. Tootell et al., 1998; Brefczynski & DeYoe, 1999; Kastner et al., 1999; Grill-Spector et al., 2000, Yantis et al., 2002). Furthermore, activity related to attending to the contralateral visual field extended into the parietal lobe (not shown in the figure). This is in agreement with previous studies showing spatially specific, attentionally driven activation in more dorsal regions of visual cortex, including IPS (Sereno et al., 2001; Silver et al., 2005; Schluppeck et al., 2006; Serences & Yantis, 2007).
Figure 2.
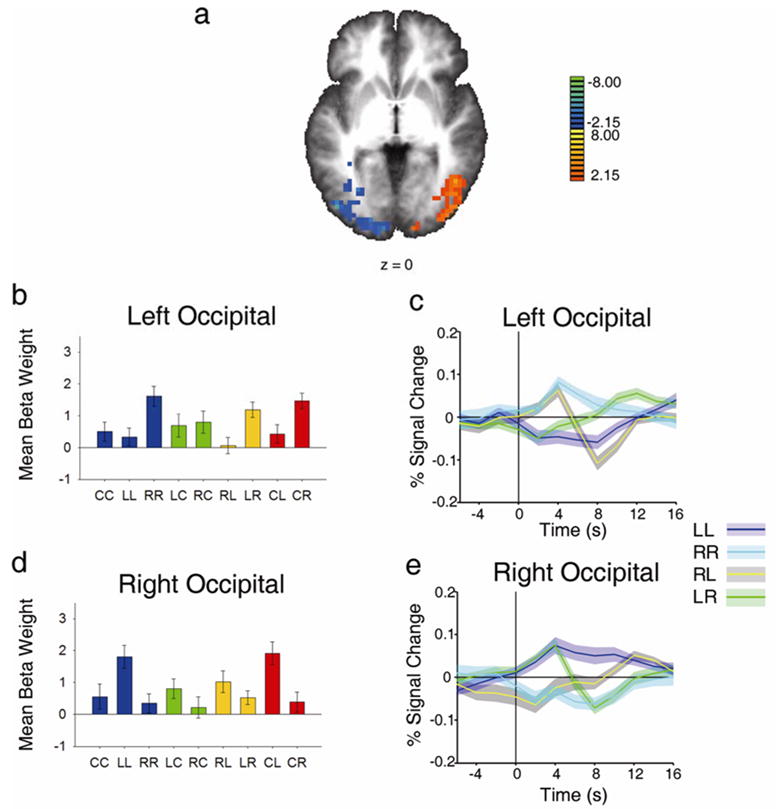
Attentional modulation of activity in extrastriate occipital cortex and parietal lobe (left side of the brain corresponds to left side of the image, for all figures). a Axial statistical t map showing activated regions of cortex, displayed on a group-averaged Talairach brain, for the contrast of LL vs. RR (warm colors represent activity related to attending left, and cool colors represent activity related to attending right). b and d, Beta weights for the nine event types in Left and Right Occipital lobe, respectively. All beta weights represent the mean of all voxels in a region, averaged across all subjects. c and e, Event-related time courses of LL, RR, LR and RL for Left and Right Occipital lobe, respectively. Shaded regions represent ± 1 SEM around each timepoint. Percent signal change at each time point is taken from the mean signal across all voxels, averaged across all subjects.
The magnitudes of the regression weights associated with all nine experimental conditions, extracted from the voxels exhibiting significant contrasts in left and right extrastriate cortex, are shown in Figure 2b and 2d, respectively. These plots show the mean of the beta weight for each event across all voxels within a region for all subjects included in the analysis. By virtue of the contrast used to identify this region, the magnitude of the RR regressor is greater than that of the LL regressor in left extrastriate cortex (Figure 2b, blue bars), and the reverse holds in right extrastriate cortex (Figure 2d). Similar patterns apply to some other relevant regressors. For example, in left extrastriate cortex the regressors reflecting shifts of attention to the right target stream (CR and LR) are greater than those reflecting shifts to the left target stream (CL and the RL); the reverse holds for right extrastriate cortex. Together, these results show that these occipital regions were more active when attention was directed to the contralateral side of the visual field.
Figure 2c depicts the event-related BOLD time course from the left extrastriate ROI. It shows that holding attention in the contralateral side of visual space (RR, cyan) produced a sustained, higher than baseline response, while holding attention on the ipsilateral side of space (LL) produced a sustained, lower than baseline response (blue). This pattern is to be expected given the contrast that generated these ROIs (hold contralateral > hold ipsilateral). Following a cue to shift attention from the contralateral to the ipsilateral visual field (RL), the BOLD time course exhibited a sharp event-locked decrease in activity (yellow); a complementary increase in activity accompanied a shift of attention from the ipsilateral to the contralateral visual field (LR, green). The pattern in left extrastriate cortex is inverted in right extrastriate cortex (Figure 2e). This pattern closely mirrors a similar crossover pattern reported by Yantis et al. (2002).
Maintenance of Peripheral Attention
The behavioral task used in this experiment allowed us to observe cortical activity during the maintenance of attention separately for attending to fixation and attending to the periphery. To examine this difference, we contrasted the regressors for LL and RR with the regressor for CC. All three of these cues required that attention be maintained at its current location; they differed only in whether attention must be held away from fixation or not. The active regions identified by this contrast are listed in Table 2, based on an alpha level of 0.005 (and a corresponding decreased minimum cluster size of 12); because of the magnitude of response to this contrast, a more conservative threshold was used so that we could define more spatially specific ROIs. This contrast revealed that bilateral posterior parietal cortex (PPC, including intraparietal sulcus (IPS) and superior parietal lobule (SPL)), precentral sulcus (PreCS, subsuming FEF and extending both dorsally and ventrally along the sulcus), and medial frontal/superior frontal gyri (SMA/SEF) were more active while holding attention in the periphery than while holding attention at fixation (Figure 3a).
Table 2.
Regions Showing Greater Activity for Hold in Periphery (LL & RR) than for Hold at Fixation (CC) (p < 0.005; Minimum cluster size = 12; coordinates represent center of mass of ROI)
| Area | Side | Size (ml) | Talairach Coordinates | t |
|---|---|---|---|---|
| Precentral Sulcus | Left | 4.536 | −16, −3, 52 | 4.09 |
| Precentral Sulcus | Right | 7.074 | 24, −1, 46 | 4.10 |
| Medial Frontal Gyrus/Superior Frontal Gyrus (SMA) | Left/Right | 1.845 | 4,7,51 | 4.09 |
| Posterior Parietal Cortex | Left | 16.875 | −26, −57, 36 | 4.42 |
| Posterior Parietal Cortex | Right | 9.207 | 29, −51, 43 | 4.12 |
| Middle Occipital Gyrus | Right | 0.837 | 35, −69, 16 | 4.14 |
| Ventral Precentral Gyrus | Right | 2.052 | 46, 12, 13 | 4.13 |
Figure 3.
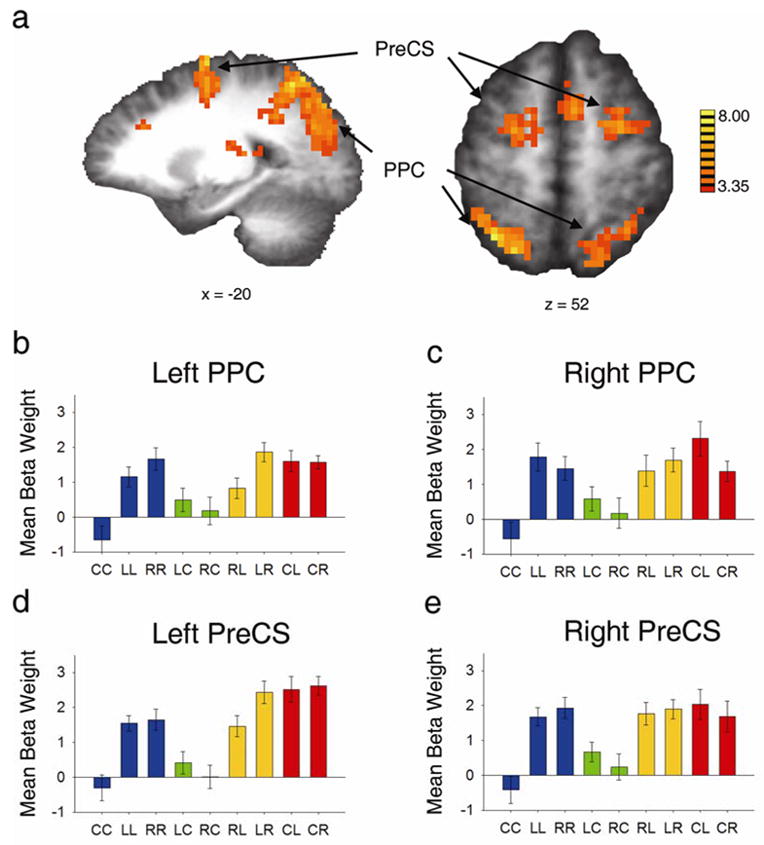
Increased cortical response for maintaining attention in the periphery compared to maintaining attention at fixation. a, Sagittal and axial views of statistical t map of regions active for LL and RR > CC in bilateral posterior parietal cortex (PPC) and precentral sulcus (PreCS) (refer to Table 2 for Talairach coordinates). b-e, Beta weights for the nine event types in left and right PPC and PreCS, respectively (see Figure 4 for the corresponding time courses).
Figure 3 b–e shows the beta weights for each condition extracted from these regions. Along with the pattern of greater activity for attending to the periphery than to fixation (LL and RR > CC), these plots also show greater activity in these regions for shifting attention from fixation to the periphery (CL and CR, red bars) than for shifting from the periphery to fixation (LC and RC, green bars). Furthermore, the beta weights show that there was greater activity during shifts of attention to the contralateral side of visual space in left PPC and left PreCS. This preference is manifested in the difference between LR and RL (left PPC: F(1,13) = 10.50, p < 0.007; left PreCS: F(1,13) = 15.67, p< 0.002). In addition, right PPC exhibited a preference for shifts to the contralateral side of visual space when attention was decoupled from fixation (CL > CR) (F(1,13) = 5.05, p < 0.05). These data reveal lateralized attention effects in these attentional control regions, echoing similar findings reported previously (Sereno et al., 2001; Silver et al.; 2005; Hagler & Sereno, 2006; Schluppeck et al., 2006; Serences & Yantis, 2007). Figure 4a and c shows the event-related time courses for LL, RR and CC in right PPC and left PreCS. CC events (black lines) are associated with less sustained activity in PPC and PreCS than either of the hold periphery events (blue and cyan), reflecting the pattern as seen in the beta weight plots.
Figure 4.
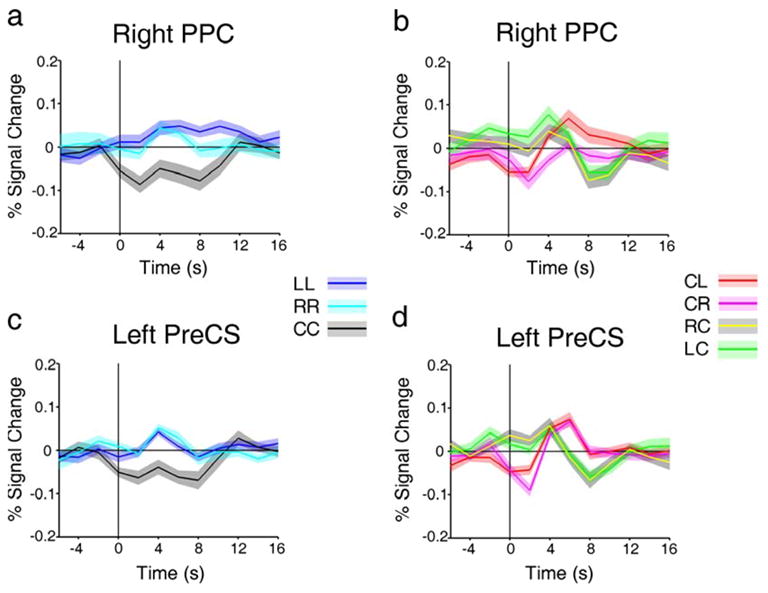
Event-related time courses extracted from some of the ROIs depicted in Figure 3. a and c, Event-related time courses of LL, RR and CC in right PPC and left PreCS, respectively, showing same pattern of activity as beta weight plots (c.f. Figure 3). b and d, Event-related time courses of CL, CR, LC and RC in right PPC and left PreCS, respectively.
Figure 4b and d shows the event-related time courses associated with CL (yellow), CR (green), LC (magenta) and RC (red) events taken from the hold-periphery vs. hold-fixation defined ROIs shown in Figure 3. At time zero (i.e. the time of event onset), there was more activity if attention began in the periphery (LC and RC) than at fixation (CL and CR), and this was followed by decreased activity for shifts from periphery to fixation and increased activity for shifts from fixation to periphery. These regions were active while attention was maintained in the periphery: they came online when attention was decoupled from fixation, and went offline when attention returned to fixation. This pattern of activity likely reflects a combination of maintenance of attention at the peripheral location and suppression of eye movements to the attended location.
Control of Peripheral Shifts of Attention
We next contrasted shifting attention among peripheral locations with holding attention at one of the peripheral locations (i.e., (RL and LR) > (RR and LL)). These events are behaviorally equivalent to the event types used by Yantis et al. (2002), and provide a measure of purely shift-related activity, because (a) these conditions did not entail the act of decoupling attention from fixation, and (b) both conditions involved maintaining attention in the periphery, so activity associated with maintaining the separation of attention and fixation was not reflected in this contrast.
The contrast of (LR and RL) > (LL and RR) revealed activation in left and right SPL and right FEF (Figure 5 a, Table 3). The parietal activation replicates the findings of Yantis et al.(2002), and the FEF activity mirrors that seen in previous studies carried out in other laboratories (e.g. Corbetta et al., 1998; Corbetta et al., 2000; Hopfinger et al., 2000; Giesbrecht et al., 2003).
Figure 5.
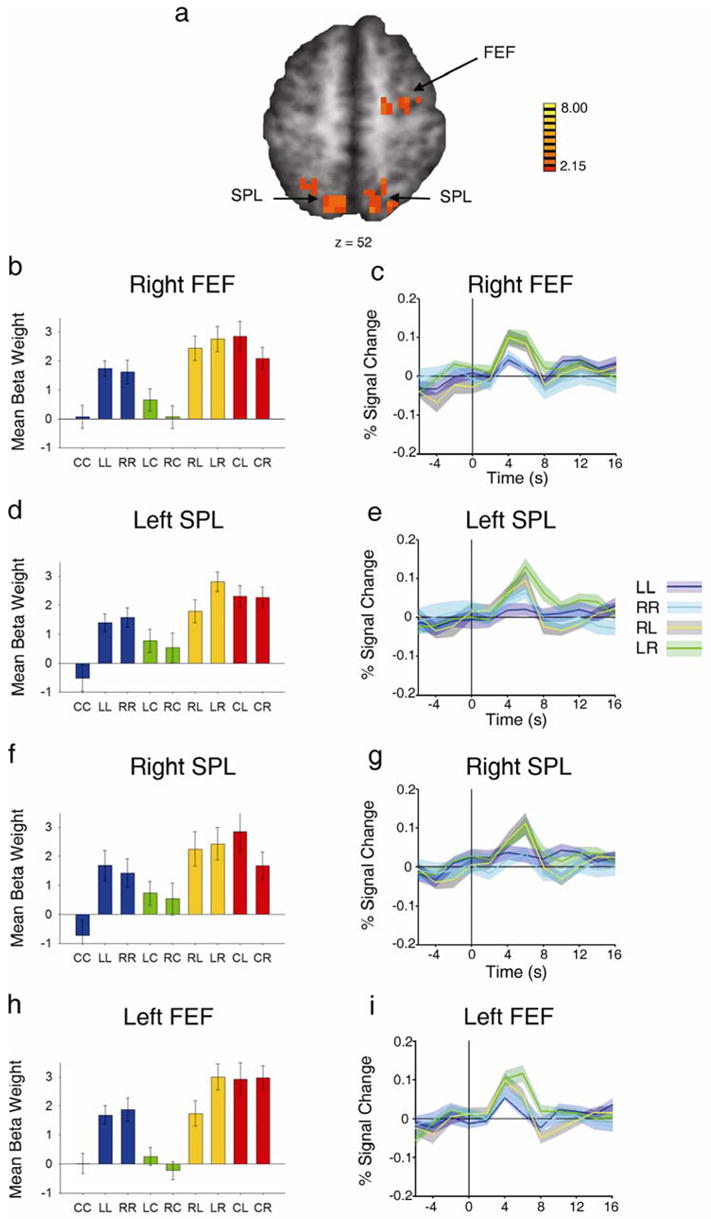
Increased cortical response to shift vs. hold targets. a, Statistical t map of regions active for RL and LR > LL and RR, revealing SPL and FEF activity (refer to Table 3 for Talairach coordinates). b, d,and f Beta weights for the nine event types in right FEF and left and right SPL, respectively. c, e and g, Event-related time courses of LL, RR, RL and LR for right FEF and left and right SPL, respectively. h and i, Plots of the beta weights for the nine event types and event-related time courses for LL, RR, RL and LR. These data were extracted from a portion of left prefrontal cortex defined by the mirror of the right FEF ROI.
Table 3.
Regions Exhibiting Greater Activity for Shift between Peripheral Locations (LR & RL) than for Hold in Periphery (LL & RR) (p< 0.05, Minimum cluster size = 24; coordinates represent center of mass of ROI).
| Area | Side | Size (ml) | Talairach Coordinates | t |
|---|---|---|---|---|
| Frontal Eye Fields | Right | 1.701 | 25, −10, 54 | 2.71 |
| Superior Parietal Lobule | Left | 2.025 | −14, −58, 50 | 2.76 |
| Superior Parietal Lobule | Right | 1.431 | 13, −57, 52 | 2.69 |
The magnitudes of the beta weights for all nine conditions extracted from the significant SPL and FEF activations are shown in Figure 5 b, d and f. The contrast reveals voxels in which the LR and RL weights (yellow bars) are larger than the LL and RR weights (blue bars), indicating greater activity in these regions for shifting attention to a new location. Within these activated clusters, the beta weights when holding attention in the periphery (LL and RR) are greater than the weight for holding attention at fixation (CC, blue bar). This difference shows that these regions were active both during shifts of attention to a new location and during sustained peripheral attention. There is also a contralateral shift preference in SPL in both hemispheres. Similar to what was described before in PPC, left SPL showed a preference for shifting to the contralateral side of the periphery from the ipsilateral side (F(1,13) = 8.40, p < 0.02) while right SPL showed greater activity for shifting to the contralateral side of space from fixation (F(1,13) = 11.97, p < 0.005). Right FEF showed a similar trend, but this difference did not exceed our statistical threshold (F(1,13) = 4.03, p < 0.067).
The event-related time courses (Figure 5c, e and g) exhibit a transient increase in activity time locked to the initiation of a shift of attention when compared to the maintenance of attention at that location. These data corroborate the findings of Yantis et al. (2002).
In addition to the areas listed above, the contrast (LR & RL) > (LL & RR) also revealed activity in left FEF; however, the active region did not meet the minimum cluster size threshold. Nevertheless, we wished to determine whether activity in this region mirrored that observed in right FEF. We used the coordinates from the functionally defined ROI of right FEF, and defined a corresponding left hemisphere ROI, (based on the assumption that the position of FEF should be roughly symmetrical in the two hemispheres). The pattern of beta weights and the event-related averages were similar to those observed in right FEF, including a preference for shifting attention to the contralateral hemifield ((F(1,13) = 25.76, p < 0.0002); these data are shown in Figure 5h and i).
Decoupling Attention from Fixation
To isolate activity related to shifting the locus of attention away from fixation (i.e., decoupling attention from fixation), we contrasted the shift to periphery (CL and CR) events with the shift among peripheral locations (LR and RL) events. In this case, all events required a shift of attention to a new spatial location; however, the CL and CR conditions also required that attention be decoupled from where the eyes were pointing. This contrast revealed activation in left SPL, left FEF, a portion of the medial anterior wall corresponding to the human supplementary eye fields (SEF; Petit et al., 1998; Grosbras et al., 1999) (Figure 6a), and right dorsal posterior IPS (Figure 6b; see also Table 4).
Figure 6.
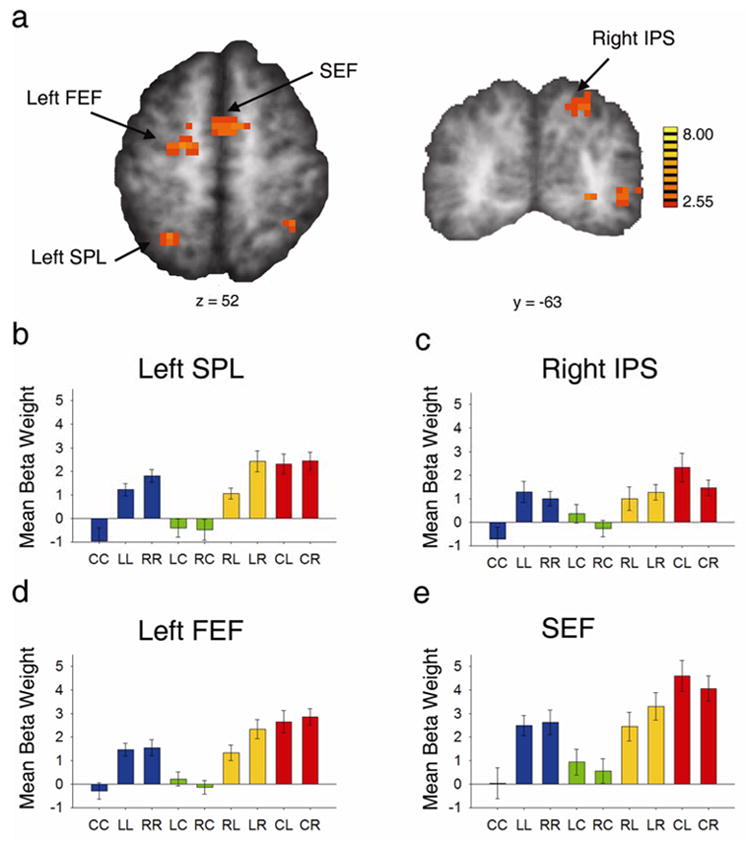
Increased cortical response to shift from fixation to periphery vs. shift from one peripheral location to the other (CL and CR > LR and RL). a, Axial view of statistical t map, showing left SPL, left FEF, and SEF (refer to Table 4 for Talairach coordinates). b, Coronal view of the same contrast, showing right dorsal posterior IPS. c-f, Beta weights for the nine event types in left SPL, right IPS, left FEF, and SEF, respectively (see Figure 7 for the corresponding time courses).
Table 4.
Regions Showing Greater Activity for Shift from Fixation to Periphery (CL & CR) than for Shift between Peripheral Location (LR & RL) (p< 0.05, Minimum cluster size = 24; coordinates represent center of mass of ROI).
| Area | Side | Size (ml) | Talairach Coordinates | t |
|---|---|---|---|---|
| Frontal Eye Fields | Left | 2.052 | −18, −8,53 | 2.78 |
| Supplementary Eye Fields | Left/Right | 1.620 | 3,1,52 | 2.73 |
| Superior Parietal Lobule | Left | 1.191 | −23, −50,46 | 3.22 |
| Dorsal Posterior Intraparietal Sulcus | Right | 1.323 | 20, −59,40 | 2.89 |
Figure 6b–e shows the beta weights for the nine event types in each of these ROIs. As required by this contrast, the beta weights for CL and CR (red bars) are greater than those for RL and LR (yellow bars), showing that these regions were more active for shifting attention from fixation to the periphery than for shifting attention between points in the periphery. Furthermore, in three of the four regions, a laterality difference is evident in the shift conditions. In left SPL and left FEF, shifting attention from the ipsilateral to the contralateral side of space (LR) resulted in greater activity than shifting from the contralateral to the ipsilateral side (RL, yellow bars) (F(1,13) = 6.90, p < 0.03; F(1,13) = 16.70, p < 0.01, respectively). Note that a similar trend was seen in the portion of left SPL that was more responsive for shifts than holds (Fig 5d, yellow bars). In right IPS, there was a trend toward a preference for shifting from fixation to the contralateral side of space (CL) rather than the ipsilateral side (CR, red bars) (F = 4.05, p = 0.065); though not statistically significant, this is similar to trends found in right SPL (Figure 5f) and larger portions of IPS (Figure 3c). Thus, these regions exhibited the largest response when attention and fixation were decoupled, with a slight preference for attention shifts towards the contralateral hemifield.
Figure 7 shows the event related time courses for shift from fixation to periphery and shift within the periphery for the activated regions depicted in Figure 6. In all four regions, the yellow and green lines, which represent the time course of RL and LR, respectively, show that these events produced transient increases in activity similar to the pattern seen in the shift-selective regions. The red and magenta lines show the time courses for CL and CR; these events also produced a transient increase in activity. The transient increases observed here, though, followed an initial period of decreased activity at time t = 0. This initial level of decreased activity resulted from attention being directed to fixation at the outset of the CL and CR events, as described earlier. Following this initial level of decreased activity, CL and CR events produced sharp, transient increases in activity. These data show that SPL, FEF and SEF are implicated in separating the locus of attention from the locus of fixation.
Figure 7.
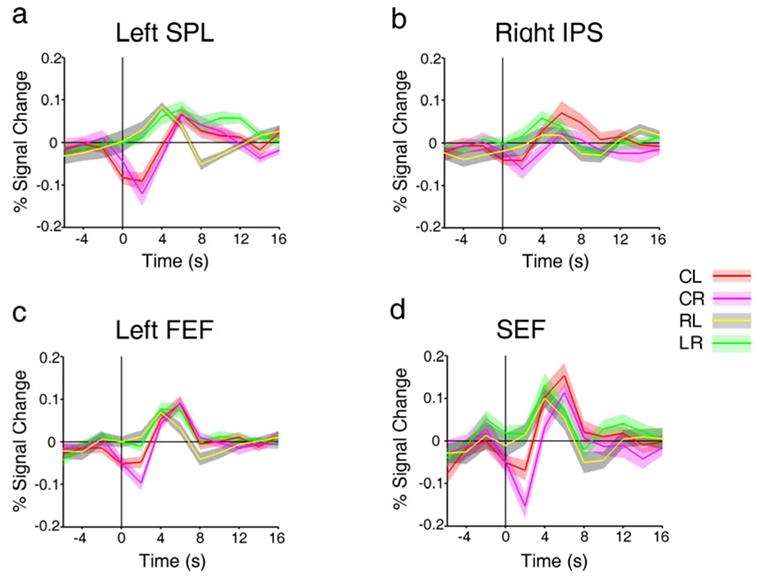
a-d, Event-related time courses of CL, CR, LR and RL in left SPL, left FEF, right IPS and SEF, respectively.
Eye Tracking
Supplementary Figure S1 shows the time course of eye position for one representative subject during a run of the attention shift experiment when fixation was maintained (a and b) and during a run in which the subject was instructed to move their eyes deliberately among the three target locations in accordance with the letter cues (c and d). The color overlay indicates the locus of attention at that point in time during the run (red = left, green = center, blue = right). These two plots show that eye position during the experimental runs remained stable (within 1 deg of the central stream), and that any perturbations in the locus of fixation were not correlated with the locus of attention. On average, subjects made 10 saccades per run (range: 1 to 48). Only three of the subjects made more than 10 saccades per run on average; excluding these subjects from the functional analysis did not qualitatively change the pattern of results. It should be noted that although the subjects did not suppress all saccades, the saccades they did make were brief deviations away from the center stream, rather than shifts of gaze to one of the other target locations. In contrast, the subject that was excluded from the analysis because of failure to maintain fixation (see Methods), made overt, rather than covert, attention shifts among the RSVP streams.
The data from instructed eye movement runs were used to generate a 95% confidence interval in each subject for locus of gaze following a hold center (CC) event. This provided a range of coordinates within which subjects’ gaze should be expected to stay if they were maintaining fixation during the functional runs. The number of samples falling outside the 95% confidence interval during the 2-sec interval following each event was submitted to a 3×3 (target location vs. identity) within-subjects ANOVA. There was no main effect of cue location or of cue identity, nor was there a significant interaction (Table 5, all p’s > 0.1). Thus eye position did not differ for the various event types, and in particular did not depend on whether attention was to be shifted or maintained, or directed to fixation or to the periphery. Therefore, it is unlikely that the production of saccades is a significant source of variance in the BOLD signal. There was little correlation between individual subject performance and number of saccades (r2 = 0.14, p > 0.3), indicating that ill-timed saccades were unlikely to have led to many errors.
Table 5a.
Proportion of the 2s time period following an event when pupil position was outside of the 95% confidence interval for horizontal axis, averaged across subjects.
| Target Location | Target Identity | |||
|---|---|---|---|---|
| L | C | R | ||
| Left | 0.05 | 0.09 | 0.02 | 0.05 |
| Center | 0.08 | 0.05 | 0.05 | 0.06 |
| Right | 0.03 | 0.05 | 0.02 | 0.03 |
| 0.05 | 0.06 | 0.03 | ||
Discussion
A frontoparietal network for the control of spatial attention shifts has been documented in a number of previous studies (Kastner & Ungerleider, 2000; Culham & Kanwisher, 2001; Corbetta & Shulman, 2002; Moore et al., 2003; Serences & Yantis, 2006). Voluntary orienting to a spatial location requires decoupling of attention from fixation followed by the initiation of a covert attention shift. No previous study has been designed to distinguish between these operations and none has compared cortical activity during the maintenance of attention at foveal and non-foveal locations, respectively. By including conditions that required subjects to attend to both foveal and peripheral locations, we were able to decompose the control of attention into its cognitive subcomponents.
Large portions of bilateral PPC (including IPS and SPL), precentral sulcus (including FEF), and posterior medial frontal gyrus (including SEF) were more active while attention was maintained in the periphery than at the fovea; these regions comprise the well-known dorsal frontoparietal attentional control network. Portions of this network (SPL and FEF) were transiently active when attention was shifted between peripheral locations, mirroring results reported by Yantis et al. (2002). When attention was decoupled from fixation, different subregions of SPL and FEF, as well as SEF, were activated. This control-related activity was accompanied by attentional modulation in extrastriate visual cortex, as has been reported in several previous studies (e.g., Tootell et al., 1998; Brefczynski & DeYoe, 1999; Kastner et al., 1999; Grill-Spector et al., 2000, Hopfinger et al., 2000; Yantis et al., 2002; Giesbrecht et al, 2003). Figure 8 shows the spatial relationship of the control related regions described above. ROIs defined by the group average contrasts of hold periphery > hold fixation (blue), shift within the periphery > hold periphery (red), and decouple > shift within periphery (green), are projected onto the inflated cortical surface of a single subject. This figure illustrates the extensive overlap of the regions active for maintaining attention in the periphery with the shift related regions. It also illustrates the lack of overlap between the regions active for shifting in the periphery, and those active for decoupling attention from fixation.
Figure 8.
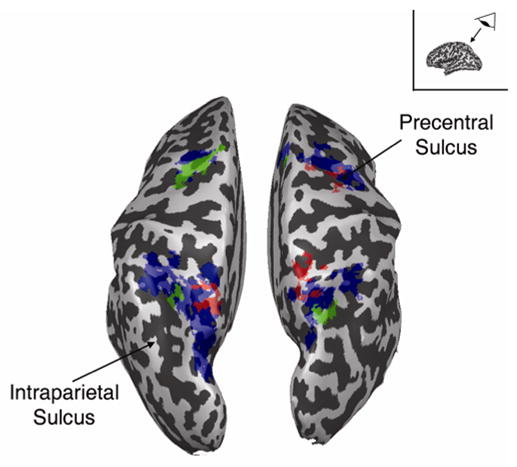
Regions of interest shown in Figures 3, 5 and 6, projected onto the inflated cortical surface of a single subject, for the purpose of spatial comparison. Blue represents regions more active while attention was maintained in the periphery (LL and RR > CC); red represents areas that were transiently active for peripheral shifts of attention (RL and LR > LL and RR); green represents areas that were transiently active for decoupling attention from fixation (CL and CR > RL and LR). Of importance here is the lack of spatial overlap between the red and green areas.
The dorsal attention control network overlaps extensively with the oculomotor control network, both in humans (Corbetta et al., 1998; Gitelman et al., 1999, 2000; Munoz & Everling, 2004; Krauzlis, 2005; Awh, Armstrong and Moore, 2006; Lynch & Tian, 2006) and in non-human primates (Schall 2002; Munoz & Everling, 2004; Krauzlis, 2005; Awh, Armstrong and Moore, 2006; Lynch & Tian, 2006). SEF neurons exhibit activity that depends on the degree to which the ongoing cognitive task involves response conflict, reward, error detection, or planning in conjunction with eye movement control (e.g., Stuphorn et al., 2000; Coe et al., 2002; Schall et al., 2002, in monkeys; Nachev et al., 2005, in humans). Studies of neural connectivity in monkeys have shown that IPS, FEF and SEF project to saccade-generating and fixation-maintaining neurons in various subcortical regions, including the superior colliculus (SC) (Shook et al., 1990; Seagraves, 1992; Munoz, 2002), a region that is critical in the planning and execution of saccades.
These oculomotor control regions of cortex also participate in the covert reorienting of attention. In the monkey, sub-threshold micro-stimulation of saccade-generating neurons in both the FEF and SC lead to spatial shifts of attention, resulting in improved behavioral performance and modulated neural responses in extrastriate cortex, without a saccadic eye movement to the attended region (Moore and Armstrong, 2003; Moore and Fallah, 2004; Juan et al., 2004; Müller et al., 2005). Similarly, in humans, transcranial magnetic stimulation of the FEF facilitates detection of peripheral targets without overt eye movements (Grosbas & Paus, 2002; Ruff et al., 2006). Furthermore, Juan et al. (2004) showed that in monkeys, neural activity in FEF associated with covert deployments of attention does not inevitably lead to saccade preparation, undermining strong versions of premotor theories of attention.
Our results offer further insight into how this network functions to produce covert shifts of attention. The act of making a covert shift of attention, especially one that separates the locus of attention from fixation, requires a proper balance of signals between normally saccade-generating neurons and fixation-maintaining neurons, rather than simply planning and failing to execute a saccade (see Thompson et al. (2005) for evidence of the disjunction between saccade generation and covert attention as observed in FEF). Such a balance of neural activity would include signals from areas shown to be involved in both oculomotor control and the control of covert attention, and which are connected to other parts of the dorsal frontoparietal network for the control of attention and the oculomotor control circuit; this describes regions such as SEF, FEF and SPL. These regions are capable of emitting the proper directional and control signals that shift attention to a peripheral location without causing a corresponding eye movement.
The sustained activity observed throughout dorsal frontoparietal cortex during the maintenance of attention in the periphery (compared to attending at fixation) echoes studies examining the spatial organization of attentional modulation in IPS and FEF (Sereno et al., 2001; Silver et al.; 2005; Hagler & Sereno, 2006; Serences and Yantis, 2007). These previous findings, along with the present results, suggest that these regions are important for maintaining the focus of attention to specific locations in space Similar patterns of sustained activity have been observed in studies of delayed-saccade execution in monkeys (as reviewed in Andersen & Buneo, 2002; Goldberg et al., 2002; Glimcher, 2003) and humans (e.g. Connolly et al., 2002; Astafiev et al., 2003; Curtis et al., 2004; Curtis and D’Esposito, 2006; Schluppeck et al., 2006). These studies reported sustained activity in both PPC and FEF during the delay between a cue to make a saccade to a specific location and the instruction to execute the saccade. This delay-period activity is thought to involve motor planning, working memory for the cued location, and attention to the cued location. Our study isolates the attentional maintenance component by comparing behavioral states in which only the locus of sustained attention varied (i.e. attend to fixation vs. attend to the periphery). This reinforces the idea that attentional maintenance is a component of the delay period activity.
Along with maintaining the current locus of attention, the use of multiple RSVP streams required subjects to simultaneously inhibit local distractors. We included competition from distractors in order to require subjects to rigorously focus their attention on the target stream, and to maximize attention effects. This raises the question of whether the sustained activity observed in PreCS and PPC is related to the continuous suppression of the distractor streams, facilitation of the target streams, or both. Because the distractor streams surrounded all three target streams, all nine event types included a local suppression component. Thus, any comparison of event types (e.g. shift vs. hold, decouple vs. shift, hold fixation vs. hold periphery) would have canceled out this component, making it unobservable in the present results. We suspect, however, that suppression and facilitation both play a role (Awh et al., 2003; Serences et al., 2004).
The maintenance of a sustained state of nonfoveal attention likely requires coordinated activity in multiple regions, some of them responsible for suppressing (or delaying the execution of) a saccade. At least part of the observed activity is likely the result of fixation neurons continuously working to ensure that a saccade is not made to the current locus of (peripheral) attention. These neurons, which have been found in FEF and SEF as well as SC and the brainstem (see Hanes et al., 1998, and Munoz & Wurtz, 1993, for reviews) are tonically active while fixation is maintained, and are thought to inhibit saccades. Thompson et al. (2005) showed that visually responsive neurons in FEF, but not saccade generating neurons, are also tonically active when attention is maintained in a specific region of space. The present results suggest similar patterns of activity may be observed for visually responsive neurons in PPC.
The maintenance related activity observed here extends along portions of PreCS that lie beyond what are thought to be the borders of FEF in humans (i.e. the junction of PreCS with superior frontal sulcus). This activity approached the junction of PreCS with the inferior frontal sulcus (a region that has been labeled inferior frontal junction or IFJ; Brass et al., 2005). IFJ is selectively active during various forms of cognitive control (see Brass et al, 2005, for a review). This activity may well reflect the application of control on the part of the subjects to countermand the typical behavior of fixating the locus of attention, and vice-versa.
Though the current results have been interpreted in terms of decoupling the locus of attention from the locus of fixation, it should be pointed out that subjects’ gazes were fixed at the horizontal center of the display, which closely corresponded to subjects’ head and body midlines. Therefore, subjects were also shifting attention away from, and across, the head and body midlines. It is known that neurons in various parts of monkey PPC have retina-, head-, hand- and body-centered coordinate systems, and these subregions of PPC are thought to coordinate these various frames of reference (see, e.g., Andersen and Buneo, 2002). As the present study did not vary the locus of gaze, it remains an open empirical question as to whether shifts of attention away from a fixation point that is not aligned with the head or body midline would produce similar patterns of activation.
One final trend in the data that is worth noting involves the laterality differences occurring in dorsal control regions. As noted in the Results section, there was a fairly consistent pattern of greater activity for shifts of attention to the contralateral hemifield. In the left hemisphere, this was manifested as greater activity for shifting from the ipsilateral to the contralateral periphery (i.e., LR > RL). In the right hemisphere, there was greater activity for shifts to the contralateral hemifield when attention was being decoupled from fixation (i.e., CL > CR). These findings do not suggest simple dominance by the right hemisphere, as a contralateral visual field preference exists in both hemispheres. This interesting pattern merits investigation in future studies of control of visuospatial attention.
Our findings support a more detailed understanding of how different regions of the frontoparietal attention network participate in the control of visuospatial attention. They suggest that SEF, FEF and SPL play prominent roles in managing the excitatory and inhibitory signals that together produce covert shifts of attention, especially when decoupling attention from fixation. Medial regions of FEF and SPL generate signals to initiate a shift of attention, while more lateral regions of FEF and IPS represent maintained states of spatial attention. These findings contribute to a growing body of evidence concerning how the oculomotor and cognitive control systems coordinate the control of both overt and covert shifts of visual attention.
Table 5b.
Proportion of the 2s time period following an event when pupil position was outside of the 95% confidence interval for vertical axis, averaged across subjects.
| Target Location | Target Identity | |||
|---|---|---|---|---|
| L | C | R | ||
| Left | 0.01 | 0 | 0.05 | 0.02 |
| Center | 0.03 | 0.01 | 0.02 | 0.02 |
| Right | 0.05 | 0.03 | 0.09 | 0.06 |
| 0.03 | 0.01 | 0.05 | ||
Acknowledgments
We would like to think S. Courtney and V. Stuphorn for helpful comments and discussions. This work was supported by NIH grant R01-DA13165 (PI: SY).
Keywords
- (fMRI)
functional magnetic resonance imaging
- (PPC)
posterior parietal cortex
- (IPS)
intraparietal sulcus
- (SPL)
superior parietal lobule
- (FEF)
frontal eye fields
- (SEF)
supplementary eye fields
References
- Andersen RA, Buneo CA. Intentional maps in posterior parietal cortex. Annu Rev Neurosci. 2002;25:189–220. doi: 10.1146/annurev.neuro.25.112701.142922. [DOI] [PubMed] [Google Scholar]
- Astafiev SV, Shulman GL, Stanley CM, Snyder AZ, Van Essen DC, Corbetta M. Functional organization of human intraparietal and frontal cortex for attending, looking, and pointing. J Neurosci. 2003;23:4689–4699. doi: 10.1523/JNEUROSCI.23-11-04689.2003. [DOI] [PMC free article] [PubMed] [Google Scholar]
- Awh E, Matsukura M, Serences JT. Top-down control of biased competition during covert spatial orienting. J Exp Psychol Hum Percept Perform. 2003;29:52–63. doi: 10.1037//0096-1523.29.1.52. [DOI] [PubMed] [Google Scholar]
- Awh E, Armstrong KM, Moore T. Visual and oculomotor selection: links, causes and implications for spatial attention. Trends Cog Sci. 2006;10:124–130. doi: 10.1016/j.tics.2006.01.001. [DOI] [PubMed] [Google Scholar]
- Boynton GM, Engel SA, Glover GH, Heeger DJ. Linear systems analysis of functional magnetic resonance imaging in human V1. J Neurosci. 1996;16:4207–4221. doi: 10.1523/JNEUROSCI.16-13-04207.1996. [DOI] [PMC free article] [PubMed] [Google Scholar]
- Brass M, Derrfuss J, Forstmann B, Yves von Cramon D. The role of the inferior frontal junction area in cognitive control. Trends Cog Sci. 2005;9:314–316. doi: 10.1016/j.tics.2005.05.001. [DOI] [PubMed] [Google Scholar]
- Brefczynski JA, DeYoe EA. A physiological correlate of the “spotlight” of visual attention. Nat Neurosci. 1999;2:370–374. doi: 10.1038/7280. [DOI] [PubMed] [Google Scholar]
- Coe B, Tomihara K, Matsuzawa M, Hikosaka O. Visual and anticipatory bias in three cortical eye fields of the monkey during an adaptive decision-making task. J Neurosci. 2002;22:5081–5090. doi: 10.1523/JNEUROSCI.22-12-05081.2002. [DOI] [PMC free article] [PubMed] [Google Scholar]
- Connolly JD, Goodale MA, Menon RS, Munoz DP. Human fMRI evidence for the neural correlates of preparatory set. Nat Neurosci. 2002;5:1345–1352. doi: 10.1038/nn969. [DOI] [PubMed] [Google Scholar]
- Corbetta M. Frontoparietal cortical networks for directing attention and the eye to visual locations: Identical, independent, or overlapping neural systems? Proc Natl Acad Sci U S A. 1998;95:831–838. doi: 10.1073/pnas.95.3.831. [DOI] [PMC free article] [PubMed] [Google Scholar]
- Corbetta M, Shulman GL. Control of goal-directed and stimulus-driven attention in the brain. Nat Rev Neurosci. 2002;3:201–215. doi: 10.1038/nrn755. [DOI] [PubMed] [Google Scholar]
- Corbetta M, Akbudak E, Conturo TE, Snyder AZ, Ollinger JM, Drury HA, Linenweber MR, Peteren SE, Raichle ME, Van Essen DC, Shulman GL. A common network of functional areas for attention and eye movements. Neuron. 1998;21:761–733. doi: 10.1016/s0896-6273(00)80593-0. [DOI] [PubMed] [Google Scholar]
- Corbetta M, Kincade JM, Olinger JM, McAvoy MP, Shulman GL. Voluntary orienting is dissociated from target detection in human poster parietal cortex. Nat Neurosci. 2000;3:292–297. doi: 10.1038/73009. [DOI] [PubMed] [Google Scholar]
- Culham JC, Kanwisher NG. Neuroimaging of cognitive functions in human parietal cortex. Curr Opin Neurobiol. 2001;11:157–163. doi: 10.1016/s0959-4388(00)00191-4. [DOI] [PubMed] [Google Scholar]
- Curtis CE, D’Esposito M. Selection and maintenance of saccade goals in the human frontal eye fields. J Neurophysiol. 2006;95:3923–3927. doi: 10.1152/jn.01120.2005. [DOI] [PubMed] [Google Scholar]
- Curtis CE, Rao VY, D’Esposito M. Maintenance of spatial and motor codes during oculomotor delayed response task. J Neurosci. 2004;24:3944–3952. doi: 10.1523/JNEUROSCI.5640-03.2004. [DOI] [PMC free article] [PubMed] [Google Scholar]
- Desimone R, Duncan J. Neural mechanisms of selective visual attention. Annu Rev Neurosci. 1995;18:193–222. doi: 10.1146/annurev.ne.18.030195.001205. [DOI] [PubMed] [Google Scholar]
- Fries P, Reynolds JH, Rorie AE, Desimone R. Modulation of oscillatory neuronal synchronization by selective visual attention. Science. 2001;291:1560–1563. doi: 10.1126/science.1055465. [DOI] [PubMed] [Google Scholar]
- Giesbrecht B, Mangun GR. Identifying the neural systems of top-down attentional control: A meta-analytic approach. In: Itti L, Rees G, Tsotsos J, editors. Neurobiology of Attention. New York: Academic Press/Elsevier; 2005. pp. 53–56. [Google Scholar]
- Giesbrecht B, Woldorff MG, Song AW, Mangun GR. Neural mechanisms of top-down control during spatial and feature attention. Neuroimage. 2003;19:496–512. doi: 10.1016/s1053-8119(03)00162-9. [DOI] [PubMed] [Google Scholar]
- Gitelman DR, Nobre AC, Parrish TB, LaBar KS, Kim YH, Meyer JR, Mesulam M. A large-scale distributed network for covert spatial attention: further anatomical delineation based on stringent behavioral and cognitive controls. Brain. 1999;122:1093–1106. doi: 10.1093/brain/122.6.1093. [DOI] [PubMed] [Google Scholar]
- Gitelman DR, Parrish TB, LaBar KS, Mesulman NM. Real-time monitoring of eye movements using infrared video-oculography during functional magnetic resonance imaging of the frontal eye fields. Neuroimage. 2000;11:58–65. doi: 10.1006/nimg.1999.0517. [DOI] [PubMed] [Google Scholar]
- Glimcher PW. The neurobiology of visual-saccadic decision making. Annu Rev Neurosci. 2003;26:133–179. doi: 10.1146/annurev.neuro.26.010302.081134. [DOI] [PubMed] [Google Scholar]
- Goldberg ME, Bisley J, Powell KD, Gottlieb J, Kusunoki M. The role of the lateral intraparietal area of the monkey in the generation of saccades and visuospatial attention. Ann N Y Acad Sci. 2002;956:205–215. doi: 10.1111/j.1749-6632.2002.tb02820.x. [DOI] [PubMed] [Google Scholar]
- Grill-Spector K, Kushnir T, Hendler T, Malach R. The dynamics of object-selective activation correlate with recognition performance in humans. Nat Neurosci. 2000;3:837–843. doi: 10.1038/77754. [DOI] [PubMed] [Google Scholar]
- Grosbras M-H, Paus T. Transcranial magnetic stimulation of the human frontal eye field: Effects on visual perception and attention. J Cog Neurosci. 2002;14:1109–1120. doi: 10.1162/089892902320474553. [DOI] [PubMed] [Google Scholar]
- Grosbras M-H, Lobel E, Van de Moortele P-F, LeBihan D, Berthoz A. An anatomical landmark for the supplementary eye fields in human revealed with functional magnetic resonance imaging. Cereb Cortex. 1999;9:705–711. doi: 10.1093/cercor/9.7.705. [DOI] [PubMed] [Google Scholar]
- Hagler DJ, Sereno MI. Spatial maps in frontal and prefrontal cortex. Neuroimage. 2006;29:567–577. doi: 10.1016/j.neuroimage.2005.08.058. [DOI] [PubMed] [Google Scholar]
- Hanes DP, Patterson WF, II, Schall JD. Role of frontal eye fields in countermanding saccades: visual, movement, and fixation activity. J Neurophysiol. 1998;79:817–834. doi: 10.1152/jn.1998.79.2.817. [DOI] [PubMed] [Google Scholar]
- Hillyard SA, Vogel EK, Luck SJ. Sensory gain control. amplification. as a mechanism of selective attention: electro-physiological and neuroimaging evidence. Philos Trans R Soc Lond B Biol Sci. 1998;353:1257–1270. doi: 10.1098/rstb.1998.0281. [DOI] [PMC free article] [PubMed] [Google Scholar]
- Hopfinger JB, Buonocore MH, Mangun GR. The neural mechanism of top down attentional control. Nat Neurosci. 2000;3:284–291. doi: 10.1038/72999. [DOI] [PubMed] [Google Scholar]
- Juan C, Shorter-Jacobi SM, Schall JD. Dissociation of spatial attention and saccade preparation. Proc Natl Acad Sci U S A. 2004;101:15541–15544. doi: 10.1073/pnas.0403507101. [DOI] [PMC free article] [PubMed] [Google Scholar]
- Kastner S, Ungerleider LG. Mechanisms of Visual Attention in the Human Cortex. Annu Rev Neurosci. 2000;23:315–341. doi: 10.1146/annurev.neuro.23.1.315. [DOI] [PubMed] [Google Scholar]
- Kastner S, De Weerd P, Desimone R, Ungerleider LG. Mechanisms of directed attention in the human extrastriate cortex as revealed by functional MRI. Science. 1998;282:108–111. doi: 10.1126/science.282.5386.108. [DOI] [PubMed] [Google Scholar]
- Kastner S, Pinsk MA, De Weerd P, Desimone R, Ungerleider LG. Increased activity in human visual cortex during directed attention in the absence of visual stimulation. Neuron. 1999;22:751–761. doi: 10.1016/s0896-6273(00)80734-5. [DOI] [PubMed] [Google Scholar]
- Krauzlis RJ. The Control of Voluntary Eye Movements: New Perspectives. Neuroscientist. 2005;11:124–137. doi: 10.1177/1073858404271196. [DOI] [PubMed] [Google Scholar]
- Liu T, Slotnick SD, Serences JT, Yantis S. Cortical mechanisms of feature based attentional control. Cereb Cortex. 2003;13:1334–1343. doi: 10.1093/cercor/bhg080. [DOI] [PubMed] [Google Scholar]
- Luck SJ, Vecera SP. Attention. In: Yantis S, Pashler H, editors. Stevens’ Handbook of Experimental Psychology, Volume 1: Sensation and Perception. 3. Vol. 1. New York: John Wiley & Sons; 2002. pp. 235–386. [Google Scholar]
- Lynch JC, Tian J-R. Cortico-cortical networks and cortico-subcortical loops for the higher control of eye movements. Prog Brain Res. 2006;151:461–501. doi: 10.1016/S0079-6123(05)51015-X. [DOI] [PubMed] [Google Scholar]
- Mangun GR, Hillyard SA. Modulation of sensory-evoked brain potentials provide evidence for changes in perceptual processing during visual-spatial priming. J Exp Psychol Hum Percept Perform. 1991;17:1057–1074. doi: 10.1037//0096-1523.17.4.1057. [DOI] [PubMed] [Google Scholar]
- Moore T, Armstrong KM. Selective gating of visual signals by microstimulation of frontal cortex. Nature. 2003;421:370–373. doi: 10.1038/nature01341. [DOI] [PubMed] [Google Scholar]
- Moore T, Fallah M. Microstimulation of the frontal eye field and its effects on covert spatial attention. J Neurophysiol. 2004;91:152–162. doi: 10.1152/jn.00741.2002. [DOI] [PubMed] [Google Scholar]
- Moore T, Armstrong KM, Fallah M. Visuomotor origins of covert spatial attention. Neuron. 2003;40:671–683. doi: 10.1016/s0896-6273(03)00716-5. [DOI] [PubMed] [Google Scholar]
- Moran J, Desimone R. Selective attention a gates visual processing in the extrastriate cortex. Science. 1985;29:782–784. doi: 10.1126/science.4023713. [DOI] [PubMed] [Google Scholar]
- Motter BC. Focal attention produces spatially selective processing in visual cortical areas V1, V2, and V4 in the presence of competing stimuli. J Neurophysiol. 1993;70:309–319. doi: 10.1152/jn.1993.70.3.909. [DOI] [PubMed] [Google Scholar]
- Müller JR, Philiastides MG, Newsome WT. Microstimulation of the superior colliculus focuses attention without moving the eyes. Proc Natl Acad Sci U S A. 2005;102:524–529. doi: 10.1073/pnas.0408311101. [DOI] [PMC free article] [PubMed] [Google Scholar]
- Munoz DP. Commentary: Saccadic eye movements: overview of neural circuitry. Prog Brain Res. 2002;140:89–96. doi: 10.1016/S0079-6123(02)40044-1. [DOI] [PubMed] [Google Scholar]
- Munoz DP, Everling S. Look away: the anti-saccade task and the voluntary control of eye movement. Nat Rev Neurosci. 2004;5:218–228. doi: 10.1038/nrn1345. [DOI] [PubMed] [Google Scholar]
- Munoz DP, Wurtz RH. Fixation cells in monkey superior colliculus I. Characteristics of cell discharge. J Neurophysiol. 1993;70:559–575. doi: 10.1152/jn.1993.70.2.559. [DOI] [PubMed] [Google Scholar]
- Nachev P, Rees G, Parton A, Kennard C, Husain M. Volition and conflict in human medial frontal cortex. Curr Biol. 2005;15:122–128. doi: 10.1016/j.cub.2005.01.006. [DOI] [PMC free article] [PubMed] [Google Scholar]
- O’Craven KM, Downing PE, Kanwisher N. FMRI evidence for objects as the units of attentional selection. Nature. 1999;401:584–587. doi: 10.1038/44134. [DOI] [PubMed] [Google Scholar]
- Petit L, Courtney SM, UngerLeider LG, Haxby JV. Sustained activity in the medial wall during working memory delays. J Neurosci. 1998;18:9429–9437. doi: 10.1523/JNEUROSCI.18-22-09429.1998. [DOI] [PMC free article] [PubMed] [Google Scholar]
- Pierrot-Deseilligny C, Müri RM, Nyffeler T, Milea D. The role of the human dorsolateral prefrontal cortex in ocular motor behavior. Ann N Y Acad Sci. 2005;1039:239–251. doi: 10.1196/annals.1325.023. [DOI] [PubMed] [Google Scholar]
- Posner MI, Walker JA, Friedrich FJ, Rafal RD. Effects of parietal injury on covert orienting of attention. J Neurosci. 1984;4:1863–1874. doi: 10.1523/JNEUROSCI.04-07-01863.1984. [DOI] [PMC free article] [PubMed] [Google Scholar]
- Ruff CC, Blankenburg F, Bjoertomt O, Bestmann S, Freeman E, Haynes J-D, Rees G, Josephs O, Deichmann R, Driver J. Concurrent TMS-fMRI and psychophysics revea l frontal influences on human retinotopic visual cortex. Curr Biol. 2006;16:1479–1488. doi: 10.1016/j.cub.2006.06.057. [DOI] [PubMed] [Google Scholar]
- Schall JD. The neural selection and control of saccades by the frontal eye field. Philos Trans R Soc Lond B Biol Sci. 2002;357:1073–1082. doi: 10.1098/rstb.2002.1098. [DOI] [PMC free article] [PubMed] [Google Scholar]
- Schall JD, Stuphorn V, Brown JW. Monitoring and control of action by the frontal lobes. Neuron. 2002;36:309–322. doi: 10.1016/s0896-6273(02)00964-9. [DOI] [PubMed] [Google Scholar]
- Schluppeck D, Curtis CE, Glimcher PW, Heeger DJ. Sustained activity in topographic areas of human posterior parietal cortex during memory-guided saccades. J Neurosci. 2006;26:5098–5108. doi: 10.1523/JNEUROSCI.5330-05.2006. [DOI] [PMC free article] [PubMed] [Google Scholar]
- Seagraves MA. Activity of monkey frontal eye field neurons projecting to oculomotor regions of the pons. J Neurophysiol. 1992;68:1967–1985. doi: 10.1152/jn.1992.68.6.1967. [DOI] [PubMed] [Google Scholar]
- Serences JT, Yantis S. Selective visual attention and perceptual coherence. Trends Cog Sci. 2006;10:38–45. doi: 10.1016/j.tics.2005.11.008. [DOI] [PubMed] [Google Scholar]
- Serences JT, Yantis S. Spatially selective representation of voluntary and stimulus-driven attentional priority in human occipital, parietal, and frontal cortex. Cereb Cortex. 2007;17:284–293. doi: 10.1093/cercor/bhj146. [DOI] [PubMed] [Google Scholar]
- Serences JT, Yantis S, Culberson A, Awh E. Preparatory activity in visual cortex indexes distractor suppression during covert spatial orienting. J Neurophysiol. 2004;92:3538–3545. doi: 10.1152/jn.00435.2004. [DOI] [PubMed] [Google Scholar]
- Sereno MI, Pitzalis S, Martinez A. Mapping of contralateral space in retinotopic coordinates by a parietal cortical area in humans. Science. 2001;294:1350–1354. doi: 10.1126/science.1063695. [DOI] [PubMed] [Google Scholar]
- Silver MA, Ress D, Heeger DJ. Topographic maps of visual spatial attention in human parietal cortex. J Neurophysiol. 2005;94:1358–1371. doi: 10.1152/jn.01316.2004. [DOI] [PMC free article] [PubMed] [Google Scholar]
- Shook BL, Schlag-Ray M, Schlag J. Primate supplementary eye field: I. Comparative aspects of mesencephalic and pontine connections. J Comp Neurol. 1990;301:618–642. doi: 10.1002/cne.903010410. [DOI] [PubMed] [Google Scholar]
- Stuphorn V, Taylor TL, Schall JD. Performance monitoring by the supplementary eye field. Nature. 2000;408:857–860. doi: 10.1038/35048576. [DOI] [PubMed] [Google Scholar]
- Thompson KG, Biscoe KL, Sato TR. Neuronal basis of covert spatial attention in the frontal eye field. J Neurosci. 2005;25:9479–9487. doi: 10.1523/JNEUROSCI.0741-05.2005. [DOI] [PMC free article] [PubMed] [Google Scholar]
- Tootell RBH, Hadjikhani N, Hall EK, Marrett S, Vanduffel W, Vaughan JT, Dale AM. The retinotopy of visual spatial attention. Neuron. 1998;21:1409–1422. doi: 10.1016/s0896-6273(00)80659-5. [DOI] [PubMed] [Google Scholar]
- Vandenberghe R, Gitelman DR, Parrish TB, Mesulam MM. Location- or feature-based targeting of peripheral attention. Neuroimage. 2001;14:37–47. doi: 10.1006/nimg.2001.0790. [DOI] [PubMed] [Google Scholar]
- Woldorff MG, Hazlett CJ, Fichtenholtz HM, Weissman DH, Anders AM, Song AW. Functional parcellation of attentional control regions of the brain. Journal J Cog Neurosci. 2004;16:149–165. doi: 10.1162/089892904322755638. [DOI] [PubMed] [Google Scholar]
- Wolfe JM. Visual Search. In: Pashler H, editor. Attention. London, UK: University College London Press; 1998. pp. 13–73. [Google Scholar]
- Womelsdorf T, Fries P, Mitra PP, Desimone R. Gamma-band synchronization in visual cortex predicts speed of change detection. Nature. 2006;439:733–736. doi: 10.1038/nature04258. [DOI] [PubMed] [Google Scholar]
- Yantis S. Goal-directed and stimulus-driven determinants of attentional control. In: Monsell S, Driver J, editors. Attention and Performance. Vol. 18. Cambridge, MA: MIT Press; 2000. pp. 73–103. [Google Scholar]
- Yanits S, Schwarzbach J, Serences JT, Carlson RL, Steinmetz MA, Pekar JJ, Courtney SM. Transient neural activity in human parietal cortex during spatial attention shifts. Nat Neurosci. 2002;5:995–1002. doi: 10.1038/nn921. [DOI] [PubMed] [Google Scholar]