

Abstract
Recent studies have shown that Blood Oxygen Level Dependent (BOLD) response amplitude during short periods of breath holding (BH) measured by functional Magnetic Resonance Imaging (fMRI) can be an effective metric for intersubject calibration procedures. However, inconsistency in the depth of inspiration during the BH scan may account for a portion of BOLD variation observed in such scans, and it is likely to reduce the effectiveness of the calibration measurement. While modulation of BOLD signal has been correlated with end-tidal CO2 and other measures of breathing, fluctuations in performance of BH have not been studied in the context of their impact on BOLD signal. Here, we studied the degree to which inspiration depth corresponds to BOLD signal change, and tested the effectiveness of a method designed to control inspiration level through visual cues during the BH task paradigm. We observed reliable differences in BOLD signal amplitude corresponding to the depth of inspiration. It was determined that variance in BOLD signal response to BH could be significantly reduced when subjects were given visual feedback during task inspiration periods. The implications of these findings for routine BH studies of BOLD-derived neurovascular response are discussed.
Keywords: hypercapnia, breath-holding, BOLD, calibration, variability
Introduction
One of the primary methodological challenges facing fMRI is that the blood oxygen level dependent (BOLD) signal is only an indirect measure of neuronal activity, because it derives from neurovascular processes (Ogawa et al., 1990). There is concern that inferences regarding cerebral activation may be confounded by regional variation in brain vasculature and by differences in the cerebral vascular system amongst subjects or between different subject groups. For example, acute ingestion of caffeine is known to reduce cerebral blood flow (CBF) in healthy volunteers (Mulderink et al., 2002). Moreover, several studies have documented age-related decline in neurovascular reactivity and elasticity with age (Hajdu et al., 1990; Kastrup et al., 1998a; Mann et al., 1986; Reich and Rusinek, 1989), while another showed greater proportions of noise in children’s BOLD response relative to that in adults (Thomason et al., 2005). Additionally, studies of global BOLD response in children and adults have demonstrated variations in BOLD response across different brain regions (Kastrup et al., 1999a; Thomason et al., 2005). Variations in BOLD response may be related to differences in baseline cerebral blood flow and/or volume, to vascular composition (Jennings et al., 1998), or even to rate of breathing or heart rate (Birn et al., 2006). Thus, inferences drawn from BOLD imaging will benefit from methods developed to better discriminate fMRI signal components related to neural activity from those that result from intrinsic properties of the local vasculature. The coupling of neural events to BOLD signal can be tightened if the neurovascular response is obtained routinely during scanning and included in signal analysis (Bandettini and Wong, 1997; Cohen et al., 2004; Handwerker et al., in press; Thomason et al., 2007).
At present, there are two predominant ways to query global, hypercapnia-based neurovascular response in a human fMRI session, CO2/O2 inhalation (Bandettini and Wong, 1997; Cohen et al., 2004; Cohen et al., 2002; Corfield et al., 2001; Davis et al., 1998; Reich and Rusinek, 1989; Rostrup et al., 2000; Schwarzbauer and Heinke, 1999; Schwarzbauer and Hoehn, 2000; Vazquez et al., 2006), and breath holding (BH) (Kastrup et al., 1999a; Kastrup et al., 1999b; Kastrup et al., 1998b; Li et al., 2000; Li et al., 1999a; Li et al., 1999b; Liu et al., 2002; Nakada et al., 2001; Riecker et al., 2003; Stillman et al., 1995; Thomason et al., 2005). In 2001, Kastrup and colleagues demonstrated cerebrovascular reactivity resulting from both techniques was similar (Kastrup et al., 2001). BH does not require use of tight-fitting masks to deliver air-mixtures and is non-invasive, giving it a natural advantage for routine use over methods requiring the administration of CO2 or O2 during a scanning session. Furthermore, the process of collecting BH data is similar to that of scanning during cognitive tasks from the standpoint of the subject and requires acquisition parameters that are typical in most fMRI studies of human cognition. Much like a cognitive paradigm, the timing of the holding and the regular-breathing periods is indicated by visual cues. Additionally, the neurovascular calibration data and the cognitive task of interest may be collected with the same slice prescription and other scan parameters. Already studies have demonstrated good compliance by elderly subjects and children to short periods (~20s) of BH for the express purpose of measuring neurovascular response during BOLD fMRI (Riecker et al., 2003; Thomason et al., 2005).
The BH task can be carried out either by holding one’s breath after inspiration or after expiration. Both have proven to be effective methods for measuring neurovascular reactivity and the measurements derived from these methods have proven to be comparable (Kastrup et al., 1999b; Kastrup et al., 1998b; Leoni et al., 2007). One important difference, however, is end-inspiration (holding one’s breath after inspiration) is easier to perform and thus may be easier for a wide range of subjects to perform, particularly aged or infirm volunteers. In their study, Kastrup and colleagues (1998b) used shorter periods of holding breath following expiration in order to counter this difference between the tasks.
BH-induced BOLD calibration is an emergent method for correction of vascular reactivity-induced effects in the BOLD signal. Researchers are using measurements taken during BH to identify individual- and region-specific differences in hemodynamic responsivity, and applying correction for these differences to cognitive paradigms. Handwerker and colleagues used end-expiration BH data to calibrate individual subject activations during a visuomotor saccade task (Handwerker et al., in press). Thomason and colleagues used end-inspiration BH data to calibrate individual subject activations during a working memory task, and reported that BH-derived calibration data applied on a voxel-wise basis effectively reduced intersubject variability by 24.8% (Thomason et al., 2007). In both studies the hypercapnia tasks accounted for a significant amount of the BOLD signal variability observed during the cognitive tasks.
Past studies of BH-induced BOLD signal change have focused on duration of hold rather than depth of inspiration or fullness of expiration. Recent work has drawn attention to the influence of breath volume and rate on BOLD signal change. Wise and colleagues have described correlations between resting state BOLD signal and changes in end-tidal CO2 (etCO2) levels and breathing states (Wise et al., 2004). They demonstrated BOLD signal is affected by breath inspiration level, and in that study the authors recommended caution in interpreting results in designs that alter breathing conditions. More recent results from the same group (Wise et al., 2007) suggested that feedback based on etCO2 levels could provide improved precision in mapping of CO2 reactivity. In addition, Birn and colleagues (2006) recently demonstrated that significant variance in resting state BOLD response was accounted for by breathing volume patterns, suggesting the sensitivity of BOLD signal to the breathing patterns, themselves. Therefore, we hypothesize that active control of the BH inspiration level will lead to improved mapping of BOLD BH-induced percent signal change.
The goals of the present study were to test the hypothesis that inspiration depth will impact BOLD signal amplitude, and to examine whether a paradigm that includes feedback cueing subjects to inspire to a controlled depth is a significant improvement over BH paradigms without feedback. The results of this study may help to optimize methods for collecting BH data for routine use in scan protocols.
Methods
Subjects
Data were collected from 13 healthy adults from Stanford University and the surrounding community (6 females, 7 males; mean age 30, range 23 to 64 years) after giving informed consent as approved by the Stanford Institutional Review Board. Because they should have no effect on neurovascular reactivity, handedness and native language were not controlled during subject selection. Data from two subjects were discarded due to poor behavioral performance of the task (did not achieve target inspiration levels consistently).
Respiration monitor
Subjects wore a respiratory monitoring belt (TSD 201, Biopac Systems, Santa Barbara, CA) placed snugly around their upper thorax. The belt’s electrical conductance is nominally proportional to the belt circumference and thus varied as the subject breathed. The belt was energized by a 5 volt power supply through a 24KΩ resistor and connected to a custom-made analog to digital (A/D) converter, which in turn was connected to the stimulus presentation computer as a parallel device. During the 3s inspiration phase of the task, the A/D was strobed at 10 Hz, and the reading at the end of the 3s period was taken as the inspiration level for that trial. During a preliminary setup step, subjects were instructed to first take in a deep breath, during which the value was recorded, and then let their breath out while a second recording was made. The subject’s range of breathing obtained during this calibration was used to normalize all subsequent readings between 0 and 100 percent of these nominal calibration points.
Breath-holding Task
Subjects performed 8 repetitions of alternating periods of breath holding after inspiration and self-paced breathing. Task blocks were cued by differently-colored squares presented sequentially on a black screen, as shown in Fig. 1A. A green square was presented for 13.5s, signifying normal breathing. The square turned yellow for 3s, during which time the subjects were to take in a breath in preparation to hold. Then the square turned red for 13.5s, signifying the breath-holding maintenance period. The total cycle time was thus 30s, and an additional 16s regular breathing block was appended to make the total scan time 256s exclusive of 6s of dummy NMR equilibrium scans at the beginning. The task was programmed in EPrime (http://www.pstnet.com).
Figure 1. Experimental design.

Baseline (green) and experimental (red) period stimuli were unchanged across c, nc and v BH tasks. Between condition types only the preparation period was modified to either include feedback (stimuli changed at threshold chest expansion) or no feedback (remained yellow for full 3 seconds regardless of extent chest expansion). The primary task (A) was performed by all subjects. The alternate design (B) was performed on the last subject only.
In order to study the effect of inspiratory level on BOLD signal, three versions of the task were performed. The three versions were performed twice each, for a total of six scans. In the first version, a constant inspiratory level feedback control was provided (type “c” scan). During the yellow inspiratory phase, the square color turned red when the subject’s inspiration level reached a 95±8% set point as measured by the belt. The subject was instructed to breathe in until the square turned red and then hold at that level. If the level exceeded the set point, the square color turned to magenta, cueing the subject to let out a little breath to obtain the red cue again. If the subject did not reach the set point during the 3s yellow inspiratory phase, the square also turned red, in order to maintain a constant hold duration across designs and subject runs. However, the subjects were trained well practicing both in and outside of the scanner, so that they could steadily increase air volume in their lungs across the inspiratory phase, and attain the threshold goal by the onset of the hold period. During a second type of variable feedback scan, termed a “v” scan, the set point for each trial varied, so that while subjects were cued to perform the task exactly as before for the c scan, covertly 3 different inspiratory level set points were interleaved. In this way the relationship between depth of inspiration and BOLD signal was studied by including variable inspiration levels. For most subjects the set points for the 8 trials in v scans were set to 75, 85, 95, 75, 85, 95, 75, 85; however for subject 1 the set points for the v scan were 50, 75, 100, 50, 75, 100, 50, 75. Finally, the third scan used no feedback control (type “nc”). During the yellow phase subjects were instructed to breathe in to their own level comfortable for breath-holding. They were not given feedback on the depth to which they inspired. Thus, while the inspiratory levels were recorded, the 3s yellow cue was constant across the nc scan. Nc and c scans were compared directly, whereas the v scan was used to examine the relationship between BOLD signal change and inspiration depth.
Subjects were instructed on the task outside the magnet and practiced it in the magnet until they were able to perform it properly, before commencing the functional scans. It was a strength of the present experiment that the set point for a given subject run (all scans) was tailored to that subject’s own comfortable preparatory hold level rather than one standard depth being applied across all. Thus, when a subject received no feedback he or she was told only to breathe to the comfortable level, probably close to the same level that dictated the set points for his or her run. Correctness was assessed as a subject’s ability to accurately reach his or her own target inspiration level. Subjects were not taught to distinguish between the v and c scans because instructions did not differ between these, and instead the distinction made was that scans would either include feedback (v and c scans) or not (nc scans).
For one subject an alternate task design (shown in Fig. 1B) was run to determine whether a different type of feedback would provide more informative feedback without increasing cognitive load. The alternate design included the same task timing and acquisition parameters, but utilized rectangular cues, and during the yellow preparation/inspiration phase a blue horizontal bar moved up the screen until it was held in the red zone of the yellow rectangle. The expansion of the belt around the subject’s abdomen caused the horizontal bar to rise, and again, the subject controlled the bar reaching and maintaining the red target through their own movement. The main difference between the primary and alternate task designs was that feedback for chest expansion was given when a target was reached, or continuously during chest expansion, respectively.
MRI Acquisitions
Magnetic resonance imaging was performed on a 3.0T whole-body scanner (Signa, rev 12M5, GE Healthcare Systems, Milwaukee, WI) using a custom quadrature birdcage head coil. Head movement was minimized with foam padding and clamps attached to the coil. Thirty contiguous axial slices were obtained with 4-mm slice thickness. High-resolution T2-weighted fast spin echo structural images (TR = 3000ms, TE = 68ms, ETL=12, FOV = 22 cm, matrix 192 × 256) were acquired for anatomical reference. A T2*-sensitive gradient echo spiral in/out pulse sequence (Glover and Law, 2001; Glover and Lai, 1998) was used for functional imaging (TR = 2000ms, TE = 30ms, flip angle = 77°, matrix 64 × 64, same slice prescription as the anatomic images). A high-order shimming procedure was used to reduce Bo heterogeneity prior to the functional scans (Kim et al., 2002). Importantly, a frequency navigation correction was employed during reconstruction of each image to eliminate blurring from breathing-induced changes in magnetic field. No bulk misregistration occurs in spiral imaging from off-resonance (Pfeuffer et al., 2002).
For each subject, 6 functional scans were performed in counterbalanced order across the scan session and across subjects. For all subjects two nc (no control) scans were obtained, and for all but subjects 2 and 3, two v (variable) and two c (constant) scans were performed. Subject 13 performed only 2 scans of the alternate task presented in Fig. 1B and 2 scans of the primary c scan used across all other subjects.
Figure 2. Activation maps.
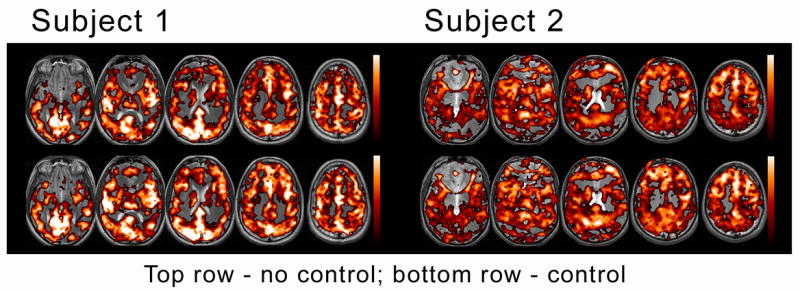
BOLD response for two representative subjects is displayed for no-control and control scans. Greater overall magnitude and extent was demonstrated in the controlled feedback scans (bottom rows).
Data Analysis
fMRI data
Activation maps were generated for each scan by correlating linearly detrended image timeseries data with sine and cosine waveforms having period equal to that of the task (30s). Using both sine and cosine correlates allowed the temporal phase as well as maximum correlation magnitude to be determined without assuming a hemodynamic response model. Because the task blocks were only 15s long, higher order harmonics were largely attenuated due to filtering by the hemodynamic response. A sigma filter (Glover and Lai, 1998) was used to cluster voxels in a 3×3 region to reject noisy single voxels. Briefly, for each target voxel this filter computes the standard deviation (std) in a 3×3 neighborhood around the target and replaces the target value with the average of those voxels whose deviation from the target voxel is less than 1 std. The process therefore tends to average voxels when it is possible without reducing spatial resolution of the activation. The threshold for activation was set to p = 0.0003, uncorrected. To avoid blurring, image co-registration was not performed.
Both whole-brain functional ROIs and three region-specific ROIs were employed in order to generate timeseries for analysis. The activation map for the first functional scan was used to create a whole-brain region-of-interest (ROI) mask, from which an average timeseries response was obtained for each functional scan. In addition, ROIs were hand-drawn as rectangular parallelpipeds (4×4 voxels × 3 slices, 13.7×13.7×12 mm3) on each subject’s T2*-weighted average image obtained from the first scan. These ROIs were located in left superior temporal cortex (TC), right parietal (PC) and posterior cingulate cortex (PCC) gray matter regions and were positioned to avoid the lateral extent of the brain surface to minimize variations that could be caused by task-correlated motion (see Fig. 5). Regional masks were created as the conjunction of these ROIs with the activation map from the first scan. Averaged over all subjects, the conjunction resulted in 36±6, 35±9 and 42±5 (ave±std) voxels out of the possible 48 voxels in the TC, PC and PCC, respectively. Response within these 3 masks and the whole brain mask were used for ROI comparisons across the 6 functional scans. The timeseries thus obtained were submitted to the quantitative analyses described next; the activation maps played no further role.
Figure 5. BOLD variability.
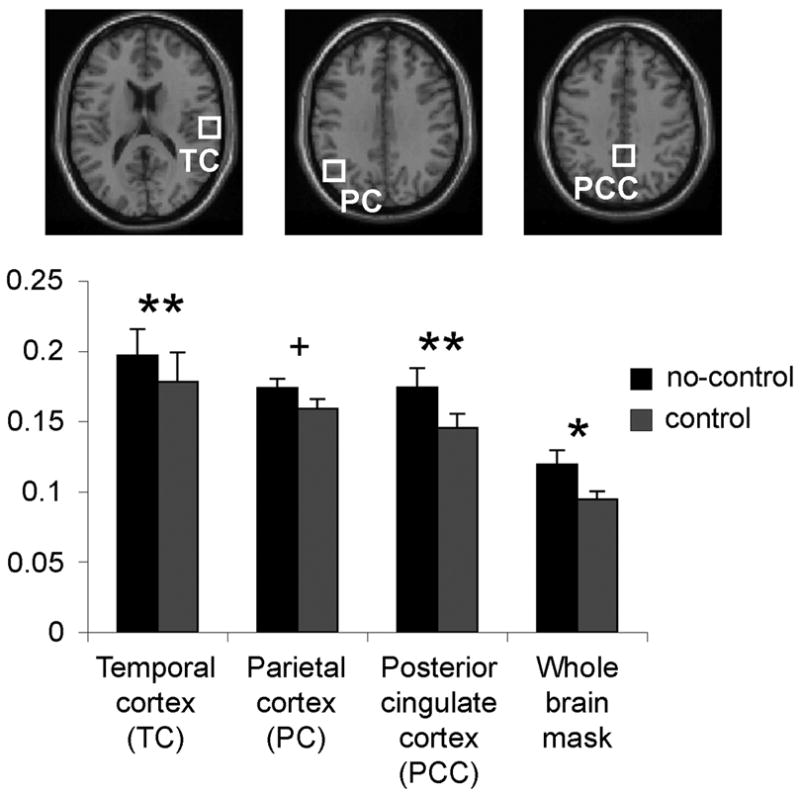
Variance in physiological BOLD data was normalized to obtain normalized variance or yfluc = σresid/ypp. For controlled feedback scans, variability was significantly reduced (**p ≤ 0.001; *p ≤ 0.01; + n.s. trend p = .07) as compared to scans in which subjects received no feedback cuing target inspiration depth.
A whole-brain functional ROI and regional ROIs were used for different reasons. In the whole-brain functional ROI noise is reduced because the estimated timeseries is taken by averaging across a large number of voxels. The fact that there is spatial heterogeneity in the BH response is unimportant in utilizing this average measure for demonstrating inter-trial consistency. Additionally, in whole-brain ROIs, physiological noise from cardiovascular-related brain perturbations will be reduced, because such noise sources tend to be localized to a small fraction of the brain volume (Glover et al., 2000) and thus are significantly attenuated by the averaging. The regional ROIs, while having more noise because of the far fewer volume of voxels included, were employed to examine whether regional differences in vasoreactivity (Kastrup et al., 1999a; Thomason et al., 2005) would alter the conclusions, and to exclude the potential for bulk head motion to contribute false activation at the brain periphery. Each timeseries for each scan was first quadratically detrended; denote this zero-mean waveform as ymeas(n), where n indicates time frame, 1 ≤ n ≤ N=128. A fourth-order complex (sine/cosine) Fourier series ymodel(n) was fit to ymeas, and the residual extracted, yres(n) = ymeas(n) − ymodel(n). The root-mean-square (RMS) signal amplitude was obtained by direct calculation from ymodel, and expressed as an approximate peak-to-peak signal ypp by multiplying by 2√2 (this is only accurately a measure of peak-to-peak amplitude if the waveform is sinusoidal, which is approximately true, but that is of no consequence as relative values are preserved across scans). Thus,
| (1) |
The standard deviation across the time series σresid was computed from yres to obtain a measure of the BOLD signal fluctuation during the scan (note that ymodel and therefore yres are zero-mean:
| (2) |
This measure includes residual variance from all sources in addition to that from inter-trial variation, such as thermal noise, model inaccuracy and physiological noise. However, the fit of the Fourier model to the measured data was extremely good, with correlation coefficients of 0.95 or greater for scans with constant feedback, so that contributions of model inaccuracy can be neglected. Furthermore, the respiratory noise was minimal during the BH half of the scans due to the task and negligible during free breathing due to the navigation correction during reconstruction (described above). Thus, most of the variance accounted for in σresid is from inter-trial fluctuation and to a smaller extent respiratory noise, and thus σresid was taken as a reasonable measure to compare the BOLD variation averaged for a given scan across the three psychophysical control conditions. To control for differences across control conditions within and across subjects, this measure was normalized by the peak to peak BOLD signal to obtain yfluc = σresid/ypp. Finally, using the whole brain mask a crude estimate of trial-to-trial variation within a scan was made by direct examination of ymeas, tabulating minimum and maximum values within each of the 8 trial periods (after accounting for a 5 second hemodynamic delay).
The integrated measure of timeseries amplitude (Eq. 1) and calculation of residual to estimate variability uses all the measurements in the timeseries rather than only the peak-to-peak values, and is therefore less subject to noise. In addition, by comparison with peak-to-peak values, such an integrated measure may be more germane to the ultimate goal of estimating vasoreactivity. Thus for each scan, we obtained 4 values of yfluc (whole-brain and regional ROIs) and the 8 peak-to-peak estimates of BOLD signal for each trial. The yfluc values were averaged separately for the 4 ROIs and for the 3 control types (c, v, nc) for a given subject (as stated previously, for most subjects there were 2 scans contributing to each average; subjects 2 and 3 had no v scans and 4 c scans). We hypothesized that these measurements would be correlated with corresponding measures of respiration performance for each control type and would differ across the three control conditions.
Six head motion parameters were estimated for each scan using conventional methods (Friston et al., 1996). The three rotational components were then converted to worst-case translations by multiplying each timeseries angle by 68 mm. This value was selected because it is the geometric mean radius of the maximum extent for X, Y and Z axes for the SPM2 average brain mask. This measure is thus highly conservative because it represents the rotational motion at the brain periphery. The 3 translational and 3 rotational timeseries expressed in mm were then separately analyzed for peak-to-peak excursion, RMS fluctuation after linear detrending, and task-correlated motion. The latter was determined by cross-correlation of each timeseries with a boxcar design depicting the BH periods, and multiplying RMS fluctuation by that correlation coefficient. Finally, summary statistics were obtained for task-correlated motion and for RMS excursion and peak excursion as the maximum of the 6 axes.
Behavioral data
Values of inspiration level during each of the 8 breath holding trials were recorded from the respiration belt. The mean and standard deviation of these values were obtained for each scan and then averaged separately for each subject for the 3 control conditions as in the fMRI data case. We recorded a value xfluc as the standard deviation of inspiration level normalized by the mean, as a measure of variation in holding one’s breath. The overall accuracy of performing the task was obtained by computing the standard deviation of (measured inspiration level – set point) over the 8 trials of a c or v scan. For c scans the set point was constant (95%), but it varied for v scans, as previously described.
Tests for significance of differences in various quantities were performed using Student’s 2-tailed t-tests, implemented using analytic software, SPSS (www.spss.com), where the quantities were paired within a subject, and reported below.
Results
Behavioral data
All subjects were able to hold their breath as described by the study protocol. On average subjects (n=10) were above 92% accurate (x = 92.25%) across c and v scans at attaining the cued target inspiration set points. xfluc, or variation across trials in holding one’s breath, was significantly different between controlled-feedback (xfluc = 0.062) and no-feedback scans (xfluc = 0.094), t (10) = 3.33, p < 0.01. Variation in breath depth was reduced with controlled feedback.
The BOLD results for the task design using the vertical scale for feedback (Fig. 1B) were very similar to those obtained using the square boxes (data not shown). To examine whether any BOLD differences resulted from potentially different cognitive processing during the two-types of feedback, a two-tailed paired t-test was performed on the BH activation maps for the two types of feedback. No significant voxels were observed (p = 0.8), demonstrating that there was no increase in focal cognitive processing using the more complex cues. Our subject reported that the vertical scale for feedback (Fig. 1B) was easier to understand.
Movement
The peak and RMS maximum excursions in head motion averaged across all scans were (1.29 ± 0.92) mm and (0.56 ± 0.24) mm, respectively (average ± std); the task-correlated component was (0.19 ± 0.13) mm (see Table 1 for details). There was no significant difference in motion between c (x = 1.37) and nc (x = 1.41) for peak excursion, t (10) = 0.18, p = 0.86, between c (x = 0.59) and nc (x = 0.58) for RMS excursion, t (10) = 0.07, p = 0.95, or between c (x = 0.22) and nc (x = 0.17) for task correlated motion, t (10) = 1.2, p = 0.25. Furthermore, subject identity proved to be the most reliable predictor of movement; paired-samples correlations were significant between c and nc for peak excursion (r = 0.78, p < 0.01), RMS excursion (r = 0.68, p < 0.05), and task-correlated motion (r = 0.65, p < 0.05),
Table 1.
Motion summary. All values have been converted to mm. Individual averages across two scans for each subject are provided
| Motion (mm)
| |||||
|---|---|---|---|---|---|
| peak excursion | RMS excursion | task-correlated | |||
| mot d nc | mot d c | mot r nc | mot r c | mot t nc | mot t c |
| 1.51 | 1.15 | 0.77 | 0.66 | 0.38 | 0.47 |
| 0.77 | 1.10 | 0.54 | 0.48 | 0.19 | 0.20 |
| 1.40 | 2.77 | 0.36 | 0.80 | 0.09 | 0.38 |
| 1.84 | 0.98 | 0.83 | 0.55 | 0.15 | 0.15 |
| 0.65 | 0.67 | 0.35 | 0.38 | 0.07 | 0.09 |
| 0.54 | 0.72 | 0.28 | 0.31 | 0.04 | 0.06 |
| 4.15 | 3.70 | 1.07 | 1.15 | 0.44 | 0.32 |
| 0.97 | 1.22 | 0.68 | 0.88 | 0.10 | 0.27 |
| 1.73 | 0.67 | 0.58 | 0.32 | 0.18 | 0.14 |
| 0.60 | 0.80 | 0.39 | 0.36 | 0.08 | 0.07 |
fMRI activation maps
Consistent with past studies of BH (Kastrup et al., 1999a; Li et al., 2000; Stillman et al., 1995) a typical pattern of global BOLD response, localized primarily in grey matter voxels, was observed for all BH scans. The extent of activation for the whole-brain ROI at p < 0.0003 ranged from 3725 to 13453 significant voxels across subjects. Where individual subjects stood within this range was consistent within subjects across BH control-types (see Table 2). BH elicited average peak-to-peak signal intensities of 3.96 ± 0.55 and 4.16 ± 0.61 percent for uncontrolled and controlled scans, respectively, an increase of 4.8% (non-significant, t (10) = 1.7, p = 0.12). More importantly, greater overall activation extent was demonstrated for controlled scans (10061 ± 3250 voxels) vs. uncontrolled scans (9081 ± 3455 voxels), a significant increase of 10.8%, t (10) = 2.5, p < 0.05. These improvements were also evident in activation maps, as seen in Fig. 2.
Table 2.
Whole-brain voxel counts and percent signal change for no control and control (with feedback) scans. Individual averages across two scans for each subject are given.
| Whole-brain voxel counts | % signal change | ||
|---|---|---|---|
| no control | control | no control | control |
| 15472 | 16317 | 3.9 | 4.1 |
| 8402 | 8159 | 4.0 | 4.3 |
| 13454 | 12625 | 3.7 | 4.8 |
| 10267 | 12077 | 5.0 | 5.2 |
| 5434 | 7261 | 3.2 | 3.0 |
| 8566 | 8782 | 3.2 | 3.5 |
| 8013 | 8662 | 4.5 | 4.3 |
| 9726 | 10566 | 3.9 | 4.0 |
| 3726 | 4755 | 4.3 | 4.3 |
| 7745 | 11408 | 3.9 | 4.1 |
Inspiration depth and BOLD response
The correlation between whole-brain trial-to-trial BOLD percent signal change and inspiration depth was significant. This is illustrated in Fig. 3 timecourse data for Subject 1 performing the variable task. The variable scan demonstrates this most clearly, but the relationship retained significance even when considered across all subject scan runs. The linear correlation coefficient computed across all trials for all scans for all subjects (480 measurements) was R = 0.347, p < 0.0001 (Fig. 4). Greater breathing depths reliably resulted in greater BOLD percent signal change.
Figure 3. Timecourse plots.
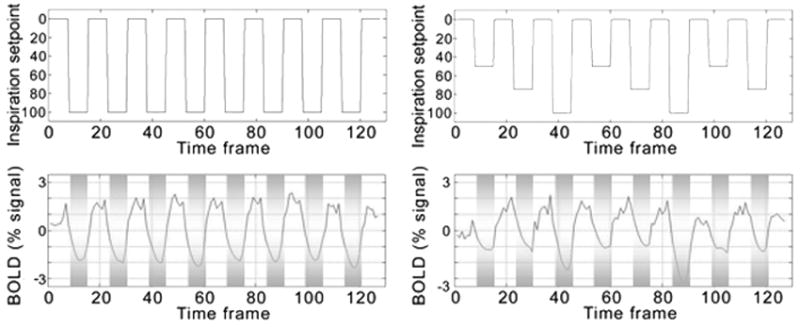
The task models for a constant depth of inspiration and for a variable depth of inspiration across trials are modeled in the upper two panels. In the bottom two panels the response to each task design is plotted. BOLD magnitude changes with inspiration depth. Zero is the mean of the timecourse.
Figure 4. Inspiration depth correlated with BOLD response.
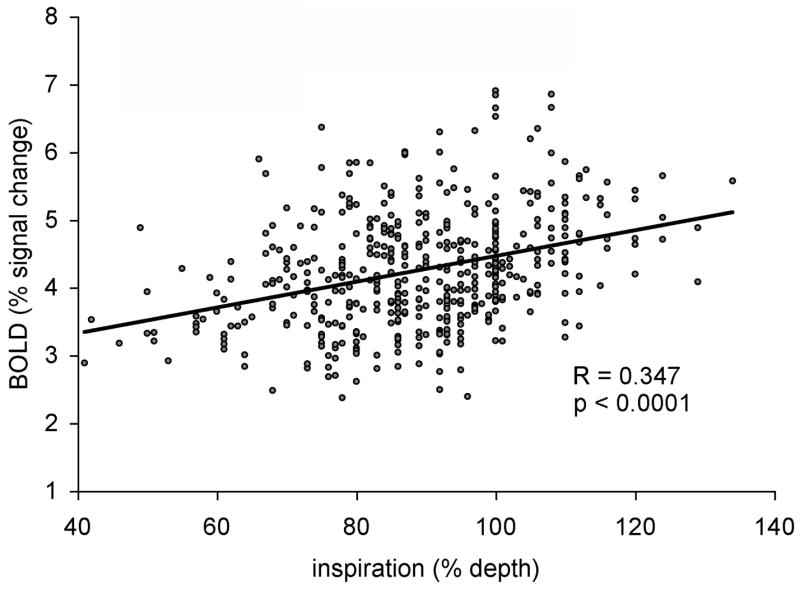
Data points represent peak-to-peak measurements of BOLD response and the respiration depth for all trials for all subjects (8 trials per scan × 6 scans × 10 subjects).
Reduced variability with controlled feedback
Variance in BOLD signal amplitude, yfluc, was reduced by providing subjects with feedback during BH scanning. The control-depth scans resulted in less variation in BOLD response than that of the no-control scans in the temporal cortex (control yfluc = 0.178, no-control yfluc = 0.197, t (10) = 4.7, p ≤ 0.001), the parietal cortex (control yfluc = 0.159, no-control yfluc = 0.173, t (10) = 2.03, p = 0.073), and the posterior cingulate cortex (control yfluc = 0.145, no-control yfluc = 0.174, t (10) = 6.25, p < 0.001) masked ROIs, as well as, the whole brain ROI (control yfluc = 0.095, no-control yfluc = 0.119, t (10) = 3.07, p < 0.05). Thus, differences were significant in whole-brain, TC and PCC regions and showed a trend for reduced variance in the PC ROI (Fig. 5).
Discussion
The approach presented herein extends the precision of the BH method for obtaining rapid, global systemic BOLD calibration data. The present study demonstrated that depth of inspiration affects BOLD signal change amplitude (Figs. 3 and 4). These results were not affected by task-correlated motion, as these components were found to amount to only 0.19 ± 0.13 pixel in-plane. The correspondence between inspiration depth and BOLD signal change was highly significant and is likely related to a combination of the blood kinetics deriving from the peripheral nervous system and interactions with the pulmonary system. The three phases of BOLD signal change during the hold period, following inspiration, adapted from (Nakada et al., 2001; Thomason et al., 2005), are: (1) chest expansion → decreased intrathoracic pressure → reduced vascular resistance → increased blood flow to the heart, (2) autonomic regulation by baroreceptors → reduced HR → decreased blood flow to brain → increased paramagnetic Hb → reduced signal intensity (SI), (3) Increase in CO2 → increased CBF in brain → drop in paramagnetic Hb → rise in oxyHb and SI. We have demonstrated that when subjects inspire more deeply in the initial phases, 1 and 2, the result is greater reduction in BOLD SI, and overall greater difference between valley and peak in the BH-induced BOLD signal waveform. This characterization highlights the advantage that may be gained by controlling inspiration depth.
The present study was designed to control inspiration level during a novel task paradigm. Unlike paradigms we have employed in past studies (Thomason et al., 2005; Thomason et al., 2007), the present study uses easy to remember, non-verbal, minimally-cognitive visual cues. Modeled after the cues of a stop light, where green is breathe normally, yellow is preparation (take in a breath), and red is stop breathing, the evolved paradigm is easy to learn, and subject compliance was near perfect in 10 of 12 subjects. Two subjects were excluded from the analysis because their behavioral performance was found after scanning to be outside the tight limits imposed for our rigorous test of controlled inspiration (target ± 8%). Their “c” scans nevertheless showed reduced BOLD variance relative to their “nc” scans. The subjects held their breath only ~15 seconds which was reported by all to be a comfortable duration. An alternative cue design using a visual slider giving quantitative feedback during the inspiration phase was anecdotally found (one subject) to not differ in the BOLD activation obtained (i.e. the additional cognitive load did not significantly alter signal in any brain regions) but was reported to be easier to understand.
The primary goal of the present work was to ascertain whether greater precision in BH-induced BOLD measurement would be attained if subjects were given inspiration depth feedback. To participate in this study was essentially to have a subject-determined target depth provided in addition to standard cues. As hypothesized, variance in (a) inspiration depth (a performance measure) and (b) BOLD signal variation were both greater when feedback was not utilized. For all subjects, inspiration depth variation and BOLD signal variation were reduced with feedback that cued subjects to the appropriate inspiration depth. This is not to say that this is the only method that may be used to achieve these results. Now that it is shown that variance in the number of voxels activated during the BH task is reduced when subjects inspire to a controlled level and that signal variance increased, the aim of controlling breath depth may be attained through other means that may simply include better training of subjects.
In conclusion, the present findings indicate that with inspiration-depth feedback the BH paradigm achieves greater inter-trial reliability by reducing measurement variance and suggests that BH may indeed satisfy the goals for a robust calibration method. Refinement of the BH method is seated within the larger goal of designing a fast and reliable measure for taking routine neurovascular response data during an fMRI scan. In studies of young children, patients, and healthy elderly as compared to young adults, the possible confound of differences in neurovascular response is often considered. Future directions will extend these studies to establish the comparability of correction for breath volume during scanning (Birn et al., 2006) as compared to BH derived neurovascular responsivity. This is an important area for future work, as breathing-related BOLD signal calibration techniques gain increased use.
Acknowledgments
We are grateful to several members of the fBIRN consortium, specifically Lee Friedman, Tom Liu and Doug Greve for valuable discussions, to anonymous reviewers for constructive comments, and to the NIH for funding: P41 RR09784 and M01 RR000827.
Footnotes
Publisher's Disclaimer: This is a PDF file of an unedited manuscript that has been accepted for publication. As a service to our customers we are providing this early version of the manuscript. The manuscript will undergo copyediting, typesetting, and review of the resulting proof before it is published in its final citable form. Please note that during the production process errors may be discovered which could affect the content, and all legal disclaimers that apply to the journal pertain.
References
- Bandettini PA, Wong EC. A hypercapnia-based normalization method for improved spatial localization of human brain activation with fMRI. NMR Biomed. 1997;10:197–203. doi: 10.1002/(sici)1099-1492(199706/08)10:4/5<197::aid-nbm466>3.0.co;2-s. [DOI] [PubMed] [Google Scholar]
- Birn RM, Diamond JB, Smith MA, Bandettini PA. Separating respiratory-variation-related neuronal-activity-related fluctuations in fluctuations from fMRI. Neuroimage. 2006;31:1536–1548. doi: 10.1016/j.neuroimage.2006.02.048. [DOI] [PubMed] [Google Scholar]
- Cohen ER, Rostrup E, Sidaros K, Lund TE, Paulson OB, Ugurbil K, Kim SG. Hypercapnic normalization of BOLD fMRI: comparison across field strengths and pulse sequences. Neuroimage. 2004;23:613–624. doi: 10.1016/j.neuroimage.2004.06.021. [DOI] [PubMed] [Google Scholar]
- Cohen ER, Ugurbil K, Kim SG. Effect of basal conditions on the magnitude and dynamics of the blood oxygenation level-dependent fMRI response. J Cereb Blood Flow Metab. 2002;22:1042–1053. doi: 10.1097/00004647-200209000-00002. [DOI] [PubMed] [Google Scholar]
- Corfield DR, Murphy K, Josephs O, Adams L, Turner R. Does hypercapnia-induced cerebral vasodilation modulate the hemodynamic response to neural activation? Neuroimage. 2001;13:1207–1211. doi: 10.1006/nimg.2001.0760. [DOI] [PubMed] [Google Scholar]
- Davis TL, Kwong KK, Weisskoff RM, Rosen BR. Calibrated functional MRI: mapping the dynamics of oxidative metabolism. Proc Natl Acad Sci U S A. 1998;95:1834–1839. doi: 10.1073/pnas.95.4.1834. [DOI] [PMC free article] [PubMed] [Google Scholar]
- Friston KJ, Williams S, Howard R, Frackowiak RS, Turner R. Movement-related effects in fMRI time-series. Magn Reson Med. 1996;35:346–355. doi: 10.1002/mrm.1910350312. [DOI] [PubMed] [Google Scholar]
- Glover G, Law C. Spiral-in/out BOLD fMRI for increased SNR and reduced suceptibility artifacts. Magn Reson Med. 2001;46:515–522. doi: 10.1002/mrm.1222. [DOI] [PubMed] [Google Scholar]
- Glover GH, Lai S. Self-navigated spiral fMRI: interleaved versus single-shot. Magn Reson Med. 1998;39:361–368. doi: 10.1002/mrm.1910390305. [DOI] [PubMed] [Google Scholar]
- Glover GH, Li TQ, Ress D. Image-based method for retrospective correction of physiological motion effects in fMRI: RETROICOR. Magn Reson Med. 2000;44:162–167. doi: 10.1002/1522-2594(200007)44:1<162::aid-mrm23>3.0.co;2-e. [DOI] [PubMed] [Google Scholar]
- Hajdu MA, Heistad DD, Siems JE, Baumbach GL. Effects of aging on mechanics and composition of cerebral arterioles in rats. Circ Res. 1990;66:1747–1754. doi: 10.1161/01.res.66.6.1747. [DOI] [PubMed] [Google Scholar]
- Handwerker DA, Gazzaley A, Inglis BA, D’Esposito M. Reducing vascular variability of fMRI data across aging populations using a breathholding task. Human Brain Mapping. doi: 10.1002/hbm.20307. in press. [DOI] [PMC free article] [PubMed] [Google Scholar]
- Jennings JR, Muldoon MF, Ryan CM, Mintun MA, Meltzer CC, Townsend DW, Sutton-Tyrrell K, Shapiro AP, Manuck SB. Cerebral blood flow in hypertensive patients: an initial report of reduced and compensatory blood flow responses during performance of two cognitive tasks. Hypertension. 1998;31:1216–1222. doi: 10.1161/01.hyp.31.6.1216. [DOI] [PubMed] [Google Scholar]
- Kastrup A, Dichgans J, Niemeier M, Schabet M. Changes of cerebrovascular CO2 reactivity during normal aging. Stroke. 1998a;29:1311–1314. doi: 10.1161/01.str.29.7.1311. [DOI] [PubMed] [Google Scholar]
- Kastrup A, Kruger G, Glover GH, Neumann-Haefelin T, Moseley ME. Regional variability of cerebral blood oxygenation response to hypercapnia. Neuroimage. 1999a;10:675–681. doi: 10.1006/nimg.1999.0505. [DOI] [PubMed] [Google Scholar]
- Kastrup A, Kruger G, Neumann-Haefelin T, Moseley ME. Assessment of cerebrovascular reactivity with functional magnetic resonance imaging: comparison of CO(2) and breath holding. Magn Reson Imaging. 2001;19:13–20. doi: 10.1016/s0730-725x(01)00227-2. [DOI] [PubMed] [Google Scholar]
- Kastrup A, Li TQ, Glover GH, Moseley ME. Cerebral blood flow-related signal changes during breath-holding. AJNR Am J Neuroradiol. 1999b;20:1233–1238. [PMC free article] [PubMed] [Google Scholar]
- Kastrup A, Li TQ, Takahashi A, Glover GH, Moseley ME. Functional magnetic resonance imaging of regional cerebral blood oxygenation changes during breath holding. Stroke. 1998b;29:2641–2645. doi: 10.1161/01.str.29.12.2641. [DOI] [PubMed] [Google Scholar]
- Kim DH, Adalsteinsson E, Glover G, Spielman D. Regularized higher-order in vivo shimming. Magn Reson Med. 2002;48:715–722. doi: 10.1002/mrm.10267. [DOI] [PubMed] [Google Scholar]
- Leoni R, Mazzeto-Betti K, Andrade K, de Araujo D. BOLD latency mapping using auto-regressive method for breath-holding fMRI. Organization for Human Brain Mapping; Chicacgo, IL: 2007. [Google Scholar]
- Li TQ, Kastrup A, Moseley ME, Glover GH. Changes in baseline cerebral blood flow in humans do not influence regional cerebral blood flow response to photic stimulation. J Magn Reson Imaging. 2000;12:757–762. doi: 10.1002/1522-2586(200011)12:5<757::aid-jmri14>3.0.co;2-4. [DOI] [PubMed] [Google Scholar]
- Li TQ, Kastrup A, Takahashi AM, Moseley ME. Functional MRI of human brain during breath holding by BOLD and FAIR techniques. Neuroimage. 1999a;9:243–249. doi: 10.1006/nimg.1998.0399. [DOI] [PubMed] [Google Scholar]
- Li TQ, Moseley ME, Glover G. A FAIR study of motor cortex activation under normo- and hypercapnia induced by breath challenge. Neuroimage. 1999b;10:562–569. doi: 10.1006/nimg.1999.0496. [DOI] [PubMed] [Google Scholar]
- Liu HL, Huang JC, Wu CT, Hsu YY. Detectability of blood oxygenation level-dependent signal changes during short breath hold duration. Magn Reson Imaging. 2002;20:643–648. doi: 10.1016/s0730-725x(02)00595-7. [DOI] [PubMed] [Google Scholar]
- Mann DM, Eaves NR, Marcyniuk B, Yates PO. Quantitative changes in cerebral cortical microvasculature in ageing and dementia. Neurobiol Aging. 1986;7:321–330. doi: 10.1016/0197-4580(86)90158-2. [DOI] [PubMed] [Google Scholar]
- Mulderink TA, Gitelman DR, Mesulam MM, Parrish TB. On the use of caffeine as a contrast booster for BOLD fMRI studies. Neuroimage. 2002;15:37–44. doi: 10.1006/nimg.2001.0973. [DOI] [PubMed] [Google Scholar]
- Nakada K, Yoshida D, Fukumoto M, Yoshida S. Chronological analysis of physiological T2* signal change in the cerebrum during breath holding. J Magn Reson Imaging. 2001;13:344–351. doi: 10.1002/jmri.1049. [DOI] [PubMed] [Google Scholar]
- Ogawa S, Lee TM, Kay AR, Tank DW. Brain magnetic resonance imaging with contrast dependent on blood oxygenation. Proc Natl Acad Sci U S A. 1990;87:9868–9872. doi: 10.1073/pnas.87.24.9868. [DOI] [PMC free article] [PubMed] [Google Scholar]
- Pfeuffer J, Van de Moortele PF, Ugurbil K, Hu X, Glover GH. Correction of physiologically induced global off-resonance effects in dynamic echo-planar and spiral functional imaging. Magn Reson Med. 2002;47:344–353. doi: 10.1002/mrm.10065. [DOI] [PubMed] [Google Scholar]
- Reich T, Rusinek H. Cerebral cortical and white matter reactivity to carbon dioxide. Stroke. 1989;20:453–457. doi: 10.1161/01.str.20.4.453. [DOI] [PubMed] [Google Scholar]
- Riecker A, Grodd W, Klose U, Schulz JB, Groschel K, Erb M, Ackermann H, Kastrup A. Relation between regional functional MRI activation and vascular reactivity to carbon dioxide during normal aging. J Cereb Blood Flow Metab. 2003;23:565–573. doi: 10.1097/01.WCB.0000056063.25434.04. [DOI] [PubMed] [Google Scholar]
- Rostrup E, Law I, Blinkenberg M, Larsson HB, Born AP, Holm S, Paulson OB. Regional differences in the CBF and BOLD responses to hypercapnia: a combined PET and fMRI study. Neuroimage. 2000;11:87–97. doi: 10.1006/nimg.1999.0526. [DOI] [PubMed] [Google Scholar]
- Schwarzbauer C, Heinke W. Investigating the dependence of BOLD contrast on oxidative metabolism. Magn Reson Med. 1999;41:537–543. doi: 10.1002/(sici)1522-2594(199903)41:3<537::aid-mrm16>3.0.co;2-v. [DOI] [PubMed] [Google Scholar]
- Schwarzbauer C, Hoehn M. The effect of transient hypercapnia on task-related changes in cerebral blood flow and blood oxygenation in awake normal humans: a functional magnetic resonance imaging study. NMR Biomed. 2000;13:415–419. doi: 10.1002/1099-1492(200011)13:7<415::aid-nbm662>3.0.co;2-3. [DOI] [PubMed] [Google Scholar]
- Stillman AE, Hu X, Jerosch-Herold M. Functional MRI of brain during breath holding at 4 T. Magn Reson Imaging. 1995;13:893–897. doi: 10.1016/0730-725x(95)00037-h. [DOI] [PubMed] [Google Scholar]
- Thomason ME, Burrows BE, Gabrieli JD, Glover GH. Breath holding reveals differences in fMRI BOLD signal in children and adults. Neuroimage. 2005;25:824–837. doi: 10.1016/j.neuroimage.2004.12.026. [DOI] [PubMed] [Google Scholar]
- Thomason ME, Foland LC, Glover GH. Calibration of BOLD fMRI using breath holding reduces group variance during a cognitive task. Hum Brain Mapp. 2007;28:59–68. doi: 10.1002/hbm.20241. [DOI] [PMC free article] [PubMed] [Google Scholar]
- Vazquez AL, Cohen ER, Gulani V, Hernandez-Garcia L, Zheng Y, Lee GR, Kim SG, Grotberg JB, Noll DC. Vascular dynamics and BOLD fMRI: CBF level effects and analysis considerations. Neuroimage. 2006;32:1642–1655. doi: 10.1016/j.neuroimage.2006.04.195. [DOI] [PubMed] [Google Scholar]
- Wise RG, Ide K, Poulin MJ, Tracey I. Resting fluctuations in arterial carbon dioxide induce significant low frequency variations in BOLD signal. Neuroimage. 2004;21:1652–1664. doi: 10.1016/j.neuroimage.2003.11.025. [DOI] [PubMed] [Google Scholar]
- Wise RG, Pattinson KT, Bulte DP, Chiarelli PA, Mayhew SD, Balanos GM, O’Connor DF, Pragnell TR, Robbins PA, Tracey I, Jezzard P. Dynamic forcing of end-tidal carbon dioxide and oxygen applied to functional magnetic resonance imaging. J Cereb Blood Flow Metab. 2007 doi: 10.1038/sj.jcbfm.9600465. [DOI] [PubMed] [Google Scholar]