Abstract
A processing of recent experimental data by Nagib and Hites [Nagib, H. & Hites, M. (1995) AIAA paper 95-0786, Reno, NV) shows that the flow in a zero-pressure-gradient turbulent boundary layer, outside the viscous sublayer, consists of two self-similar regions, each described by a scaling law. The results concerning the Reynolds-number dependence of the coefficients of the wall-region scaling law are consistent with our previous results concerning pipe flow, if the proper definition of the boundary layer Reynolds number (or boundary layer thickness) is used.
The currently dominant engineering theory of the zero-pressure-gradient turbulent boundary layer was proposed by Coles (1). An exposition, closely following the original work, can be found in Monin and Yaglom (2) and a discussion can be found in the instructive paper by Fernholz and Finley (3). We do not reproduce this theory here, noting only that beside some invariance assumptions, common to semi-empirical theories of turbulence, Coles’ theory introduces additional parameters and approximations, convenient for engineering calculations but without a direct physical meaning. An instructive survey of the general properties of turbulent boundary layers can be found in Sreenivasan (4).
In the present paper we start by a very simple processing of recent experimental data of Nagib and Hites (5, 6). Our study indicates that the flow outside of the viscous sublayer consists basically of two self-similar regions: the inner region (wall region) and an outer region. In both regions the mean velocity distribution can be very accurately described by scaling (power) laws, different for the inner and the outer regions. The boundaries between the inner and outer regions and the boundary between the outer region of the boundary layer and the free stream flow are rather sharp. We show further that the scaling law for the inner region is almost identical to the scaling law proposed for pipes (7, 8). However, to reveal this identity a redefinition of the Reynolds number for the boundary layer was needed.
Processing of the Experimental Data
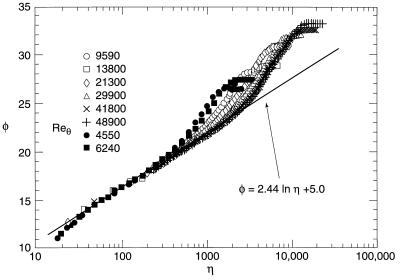
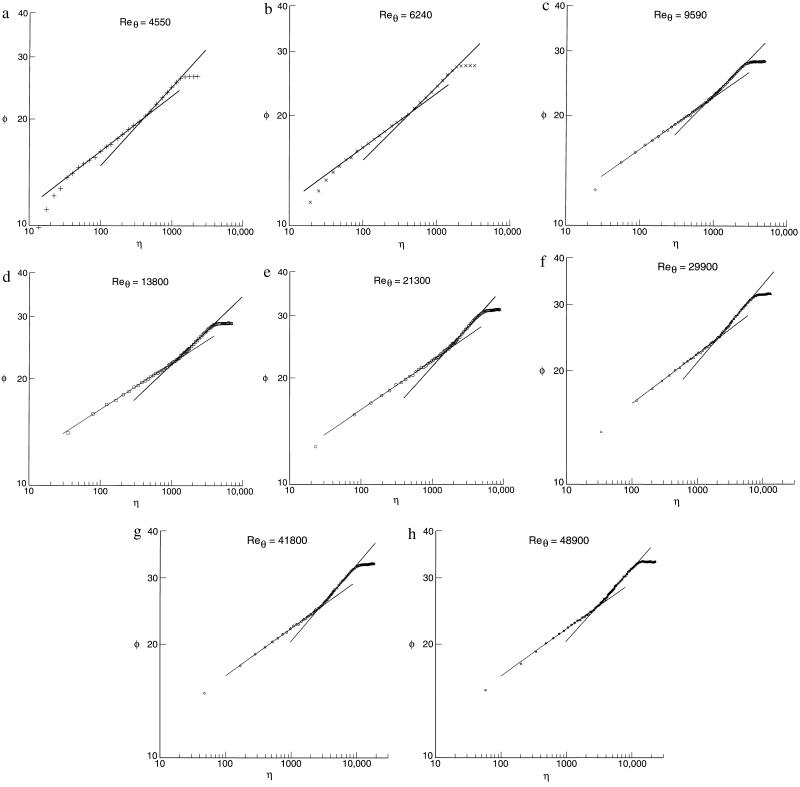
The experimental data of Nagib and Hites (5, 6) as well as earlier data of Naguib (6), are presented in Fig. 1. (We are most grateful to H. Nagib and M. Hites who supplied us with tables.) To reveal the scaling laws, we simply presented their results in double-logarithmic rather than the semi-logarithmic coordinates which are commonly used for processing such data. The results are presented in Fig. 2 a–h. The instructive common feature of these figures is that outside the viscous sublayer the velocity distribution in the flow is represented by a broken line—a combination of two different scaling (power) laws separated by a sharp boundary.
Figure 1.
The data of Nagib, and Hites and Naguib in the original semi-logarithmic coordinates. Open symbols correspond to the data and Nagib and Hites, the closed ones to the data of Naguib. (Reproduced with permission from Ref. 6, copyright 1995.)
Figure 2.
The same data in double-logarithmic coordinates reveal two self-similar regions in the boundary layer separated by sharp boundaries. (a) Reθ = 4550; (b) Reθ = 6240; (c) Reθ = 9590; (d) Reθ = 13,800; (e) Reθ = 21,300; (f) Reθ = 29,900; (g) Reθ = 41,800; (h) Reθ = 48,900.
The parameters of the scaling laws are presented in Table 1: the scaling law in the inner region is assumed to have the form θ = Aηα; in the outer region the assumption is θ = Bηβ. Here the standard notations are used:
 |
1 |
where u is the mean velocity; u∗ is  , the dynamic or friction velocity; τ is the shear stress at the wall; ν is the kinematic viscosity; ρ is the density of the fluid; θ is the momentum displacement thickness; and U is the free-stream velocity.
Table 1.
Parameters in the scaling laws
| Reθ | A | α | B | β | B′ |
|---|---|---|---|---|---|
| 4,550 | 7.87 | 0.156 | 5.31 | 0.221 | 2.75 |
| 6,240 | 8.24 | 0.148 | 5.98 | 0.200 | 3.08 |
| 9,590 | 8.37 | 0.143 | 5.47 | 0.206 | 2.80 |
| 13,800 | 8.94 | 0.131 | 5.79 | 0.193 | 2.97 |
| 21,300 | 8.61 | 0.138 | 4.69 | 0.220 | 2.36 |
| 29,900 | 8.99 | 0.130 | 5.14 | 0.204 | 2.57 |
| 41,800 | 9.30 | 0.124 | 5.05 | 0.201 | 2.52 |
| 48,900 | 9.28 | 0.124 | 5.37 | 0.192 | 2.67 |
We see that the slope α and the coefficient of the inner scaling law A are slightly Re-dependent. For the outer scaling law the Re dependence, if it exists, is weaker. The power β is close to 0.2 = 1/5. The evidence therefore shows that the boundary layer between the viscous sublayer and the free stream consists of two different self-similar regions.
A Comparison with the Wall Law of the Flow in the Pipes and an Effective Reynolds Number for the Turbulent Boundary Layer
To interpret our result we turn to the scaling for the intermediate region of pipe flow—the region between the viscous sublayer and close vicinity of the axis (7, 8). It has the form
 |
2 |
where ū is the average velocity (total discharge divided by the cross-section’s area) and d is the diameter of the pipe.
Intuitively it is clear that at moderate values of η the scaling law (2) and the scaling law for the inner region of the turbulent boundary layer should coincide. The problem is to establish a correspondence between the well-defined Re of pipe flow and the ill-defined quantity Reθ.
If such a correspondence does exist, then with a redefined Reynolds number of the boundary layer Re the scaling law (2) should be valid for the boundary layer. Therefore two Reynolds numbers for zero-pressure-gradient turbulent boundary layer were introduced, ReBL(1) and ReBL(2), obtained by processing experimental data in the following way:
 |
3 |
The question is whether ln ReBL(1) and ln ReBL(2) are close; the results are presented in Table 2.
Table 2.
Processed parameters
| Reθ | ln ReBL(1) | ln ReBL(2) | ln Re |  |
 |
|---|---|---|---|---|---|
| 4,550 | 9.59 | 9.30 | 9.45 | 0.36 | 26.5 |
| 6,240 | 10.13 | 9.94 | 10.03 | 0.27 | 27.4 |
| 9,590 | 10.47 | 10.16 | 10.32 | 0.32 | 28.3 |
| 13,800 | 11.45 | 11.10 | 11.31 | 0.17 | 28.8 |
| 21,300 | 10.88 | 10.59 | 10.74 | 0.46 | 31.2 |
| 29,900 | 11.50 | 11.25 | 11.37 | 0.34 | 32.0 |
| 41,800 | 12.08 | 11.78 | 11.93 | 0.27 | 32.6 |
| 48,900 | 12.07 | 11.75 | 11.91 | 0.33 | 33.2 |
As we can see, the logarithms of ReBL(1) and ReBL(2) are close. (Only the logarithms should be compared because the small parameter of the theory is 1/ln Re.) Therefore, we introduce the effective Reynolds number Re for the turbulent boundary layer by the formula
 |
4 |
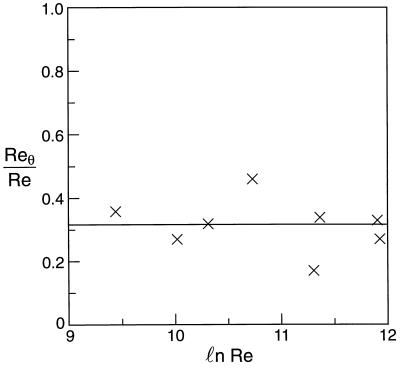
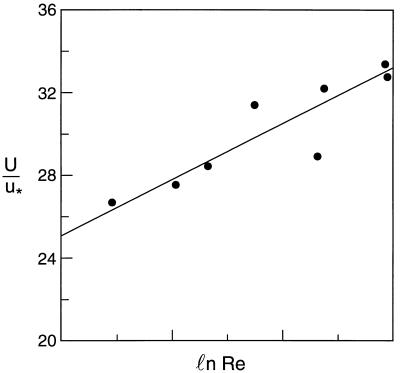
as a basic Reynolds number. The ratio Reθ/Re, i.e., the ratio of the momentum thickness θ of the boundary layer to the effective length scale, is of primary interest. Table 2 and Fig. 3 suggest that basically this ratio is a constant, approximately equal to 1/3. The most important point is the very existence of the effective length scale. Another point of interest is the ratio of the free stream velocity U to the friction velocity u∗. Table 2 and Fig. 4 show that basically U/u∗ is a linear function of ln Re, as is the ratio ū/u∗ in pipe flow. We should mention that in the zero-pressure-gradient turbulent boundary layer problem there is an uncontrollable parameter: the level of turbulence in the outer flow. The scatter in the values of B might be due to the influence of this parameter.
Figure 3.
The ratio Reθ/Re is basically constant.
Figure 4.
The ratio U/u∗ is basically a linear function of ln Re.
Conclusions
We have shown that the structure of the zero-pressure-gradient boundary layer consists of two self-similar flows having different scaling laws. Both laws reveal incomplete similarity in a basic parameter. The introduction of the effective Reynolds number of the boundary layer allowed us to establish a correspondence between the scaling law in the inner part of the boundary layer and the scaling wall law in a pipe. The experiment of Nagib and Hites, as well as earlier experiments of Naguib, suggest that a properly defined effective Reynolds number for boundary layer flow gives an appropriate characterization of the flow regime. The ratio of the effective length scale to the momentum thickness of the boundary layer seems to be a constant, approximately equal to 3. The ratio of the free stream velocity to the friction velocity is a linear function of the logarithm of the effective Reynolds number. The scaling relationship for the second regime can also be represented in the form
 |
5 |
if we prefer the external velocity U to be the basic variable in the second regime. The values of B′ are presented in Table 1. The scatter remains practically the same, and may support our opinion that it is due to the uncontrolled parameter.
It seems of interest to verify all these conclusions using other experimental data.
Acknowledgments
We acknowledge with gratitude the cooperation of Prof. H. M. Nagib, Dr. M. Hites, and Prof. C. Wark. This work was supported in part by the Applied Mathematical Sciences subprogram of the Office of Energy Research, U.S. Department of Energy, under contract DE-AC03-76-SF00098, and in part by the National Science Foundation Grants DMS94-14631 and DMS89-19074.
References
- 1.Coles D. J Fluid Mech. 1956;1:191–226. [Google Scholar]
- 2.Monin A S, Yaglom A M. Statistical Fluid Mechanics. Vol. 1. Boston: MIT Press; 1971. [Google Scholar]
- 3.Fernholz H H, Finley P J. Prog Aerospace Sci. 1996;32:245–311. [Google Scholar]
- 4.Sreenivasan K R. In: Frontiers in Experimental Fluid Mechanics. Gad-el-Hak M, editor. Berlin: Springer; 1989. pp. 159–209. [Google Scholar]
- 5.Hites M. Ph.D. thesis. Chicago: Illinois Institute of Technology; 1997. [Google Scholar]
- 6.Nagib, H. & Hites, M. (1995) AIAA paper 95-0786, Reno, NV.
- 7.Barenblatt G I. C R Acad Sci Paris Ser II. 1991;313:307–312. [Google Scholar]
- 8.Barenblatt G I, Chorin A J, Prostokishin V M. Appl Mech Rev. 1997;50:413–429. [Google Scholar]


