

Abstract
Research connects stressful events with altered immune regulation, but the role of subjective stress is uncertain. Using a longitudinal design, we provide a statistically powerful test of the relationship between subjective stress (perceived stress, emotional distress) and immunity (T cell blastogenesis, natural killer cell cytotoxicity, [NKCC]) as individuals adjust to a severe stressor, a cancer diagnosis and its treatments. Women with regional breast cancer (N = 113) were assessed at diagnosis/surgery and reassessed 4, 8, 12, and 18 months later. Latent growth curve analysis tested two hypotheses: (1) initial levels of subjective stress will correlate inversely with initial levels of immunity, and (2) rate of change in subjective stress will correlate inversely with rate of change in immunity. As predicted by Hypothesis 1, participants with high initial subjective stress showed poor initial blastogenesis. As predicted by Hypothesis 2, participants exhibiting an early, rapid decline in subjective stress also showed rapid improvement in NKCC. Follow-up analyses revealed perceived stress to be strongly related to immune function, while emotional distress was not. This is the first study to investigate trajectories in stress and immunity during recovery from a major stressor. Results imply that NK and T cells are sensitive to different aspects of the stress response. While T cell blastogenesis correlated with initial (peak) subjective stress, NKCC correlated with change (improvement) in subjective stress. These data highlight the importance of subjective stress, particularly stress appraisals, in the immune response to a major stressor.
Keywords: Stress, Immunity, Psychoneuroimmunology, Breast cancer, Lymphocytes, T cell blastogenesis, Natural killer cell cytotoxicity, Latent growth curve analysis, Individual differences
1. Introduction
More than two decades of research have established an association between psychological stressors and changes in immune function (Herbert and Cohen, 1993; Segerstrom and Miller, 2004). This research body has overwhelmingly defined stress as the presence of a stressful event or circumstance, but a shift is now occurring. Rather than treating stressors as monotonic, there is a greater emphasis on studying individual variability in the stress response (see, for example, the 2003 special issue in Brain, Behavior and Immunity; e.g., Segerstrom, 2003). Investigating individual variability has far-reaching implications, from elucidating the mechanisms by which psychological factors could affect immune function to understanding why stress reducing interventions may (or may not) affect immunity. The present study examines individual variability in subjective stress and immunity during adjustment to a severe stressor: a cancer diagnosis and treatment.
Stressors are thought to produce immune change via cognitive appraisals of stress and increased emotional distress. Specifically, when an event is appraised as stressful, this appraisal elicits emotional distress, and these cognitive and emotional changes initiate a series of central nervous system and endocrine events which ultimately impact the immune system (see Kiecolt-Glaser et al., 2002). One implication of this theory is that the strength of the psychological response (perceived stress, distress) should correlate with the physiological response (e.g., immune function), yet the data supporting this relationship are weak. To investigate this issue in a naturalistic setting, a sample of individuals responding to a similar stressor is needed, and the reports must include correlations between subjective stress and immune function. In a recent meta-analysis, nine studies provided relevant data (Segerstrom and Miller, 2004), but the overlap in immune measures permitted the meta-analysis of only three immune parameters: numbers of circulating T-helper cells and T-cytotoxic cells and natural killer (NK) cell cytotoxicity. Only natural killer cell cytotoxicity (NKCC) showed a consistent correlation with subjective stress (r = −.15, p = .02). Authors of the meta-analysis cite a small number of studies and methodological issues as a potential explanation for the null results.
Meta-analytic results lead to the puzzling conclusion that stressful events are consistently related to immune function (Herbert and Cohen, 1993; Segerstrom and Miller, 2004), while the hypothetical causal factor, perceived stress, is not (see Thornton and Andersen, 2006) for a discussion. Two features of research in subjective stress might explain this discrepancy. First, studies designed to examine stressful events enjoy greater statistical power than studies of subjective stress by virtue of their study designs. Studies of stressful events maximize the potential for finding effects by specifically comparing participants in a “stress” condition (when subjective stress is presumably high) to those in a “no stress” condition (when subjective stress is presumably low). In contrast, studies examining subjective stress typically sample participants from the general population (e.g., a survey of working adults, similar to the “non-stress” condition; Theorell et al., 1990) or participants who are experiencing a common stressor (e.g., hurricane victims, similar to the “stress” condition; Ironson et al., 1997). Within these naturally occurring groups, there is less inter-individual variability in subjective stress than is seen in designs contrasting “stress” and “non-stress” conditions. Consequently, statistical power is reduced. Second, the relationship between subjective stress and immunity may be complex. Self-reports of subjective stress could be influenced not only by changes in response to the stressor, but also by persistent individual differences in the ways people interpret and report stress (see Segerstrom, 2003). Individual differences could obscure relationships between subjective stress and immunity in cross-sectional analysis.
A longitudinal study offers the possibility of controlling for design limitations. Because each subject serves as his or her own control, differences between subjects can be differentiated from change within subjects over time. Further, when longitudinal studies follow participants through high and low stress periods, the range of subjective stress observed is increased, enhancing statistical power. Only three studies have offered such an analysis. The first examined perceived stress. Maes and colleagues measured students’ perceived stress and immune function at two time-points, mid-semester and during an examination period (Maes et al., 1999). The difference in perceived stress across the two time-points correlated with the difference in immune cell counts and in the T-helper/suppressor ratio. Students whose perceived stress increased the most also showed the greatest change in immunity. The second and third studies examined mood over time. Stone and colleagues asked students to rate their mood on 25 occasions over weeks. They discovered that students had lower antibody titers to a harmless protein on days when their negative mood was high relative to days with low negative mood (Stone et al., 1987). Shimamiya and colleagues asked subjects to provide daily mood ratings during a 10-day confinement period. Participants who showed the greatest mood change showed greater immune change across all measures (percentages of granulocytes, natural killer cells, and CD69 positive cells; Shimamiya et al., 2005). Data from these three studies suggest that within-subject change in subjective stress is an important determinant of immune function. Longitudinal studies offer the possibility of studying both within and between subject differences, yielding greater power and flexibility.
1.1. Stress and immunity in the context of cancer
It is extensively reported that individuals experience stress upon learning of a cancer diagnosis (e.g., Compas and Luecken, 2002). It is also known that patients vary in their initial psychological response and recovery. While most patients report declines from their initial high distress (Edgar et al., 1992), some continue to report distress years later (Ganz et al., 1996). One four-year longitudinal study of quality of life after breast cancer diagnosis found that, while most patients’ mental functioning either remained steady (43%) or improved (45%), a substantial minority reported declines in quality of life related to mental functioning (Helgeson et al., 2004). Thus, data suggest considerable individual variation in psychological adjustment following a cancer diagnosis.
The present study examines subjective stress and immune trajectories in the first 18 months following a cancer diagnosis. Recruited an average of 37 days after surgical treatment, a primary stressor for these individuals is the diagnosis and early treatment of breast cancer. We have previously reported that those with the highest stress at diagnosis/surgery have the poorest immune function (Andersen et al., 1998) and show reductions in emotional distress from a psychological intervention (Andersen et al., 2004). Here we extend those findings with longitudinal observations. We examine the interim steps between the stressor and immune change: stress appraisals and emotional distress. Although we have differentiated these two constructs in other contexts (Andersen et al., 2004), in this naturalistic study, we expect that stress and distress (a) both arise from a stressful experience, (b) arise in the same individuals (i.e., they correlate), and (c) should hypothetically show similar relationships with immune function. Thus, we examine stress and distress in parallel, as indicators of the subjective response to stress.
Design features of this study offer advantages over prior investigations of subjective stress and immunity. The longitudinal design allows the examination of within-subject change in stress and its relationship with change in immune function. In addition, participants are recruited into the study during a period of very high stress (after diagnosis and surgical treatment) and they are followed as stress declines over an 18-month follow-up period.
We use an analysis suited to the examination of within and between-subject differences over time. Latent growth curve analysis (Meredith and Tisak, 1990) treats change over time as an underlying latent process that is reflected in repeated measures data. In the present study, data are summarized in terms of three latent variables: intercept, linear slope, and quadratic change. Fig. 1 illustrates these concepts and our hypotheses. The upper panel of Fig. 1 illustrates the subjective stress trajectories of four hypothetical individuals. First, consider the starting points (intercepts) for each of the four individuals. Persons A and B enter the study with high subjective stress, Person C enters the study with moderate stress, and D reports low subjective stress. The lower panel illustrates the immunological trajectories of the same individuals over time. We hypothesize that greater subjective stress at study entry will correspond to poorer concurrent immune function (a between-subjects effect). Thus, the figure denotes Persons A and B with the poorest initial immunity, C is slightly higher, and D is depicted with the highest initial immunity. In latent growth curve analysis, Intercept latent variables utilize data from all assessment points to estimate initial levels of stress and immunity. This allows us to test the concurrent relationship between stress and immunity with greater statistical power than cross sectional studies. We expect that the Intercepts of stress will correlate inversely with the Intercepts of immunity (Hypothesis 1). Second, consider the different patterns of change over time. Person A shows no improvement over time, B and C show linear decreases in stress over time, and D shows curvilinear change over time (i.e., denoting the involvement of a quadratic change variable). We hypothesize that rate of change in subjective stress will correspond to rate of change in immunity. Thus, the figure illustrates patterns of change in immunity that mirror those of subjective stress. In the latent curve models, we expect Slope of subjective stress to correlate inversely with Slope of immunity (Hypothesis 2).
Fig. 1.
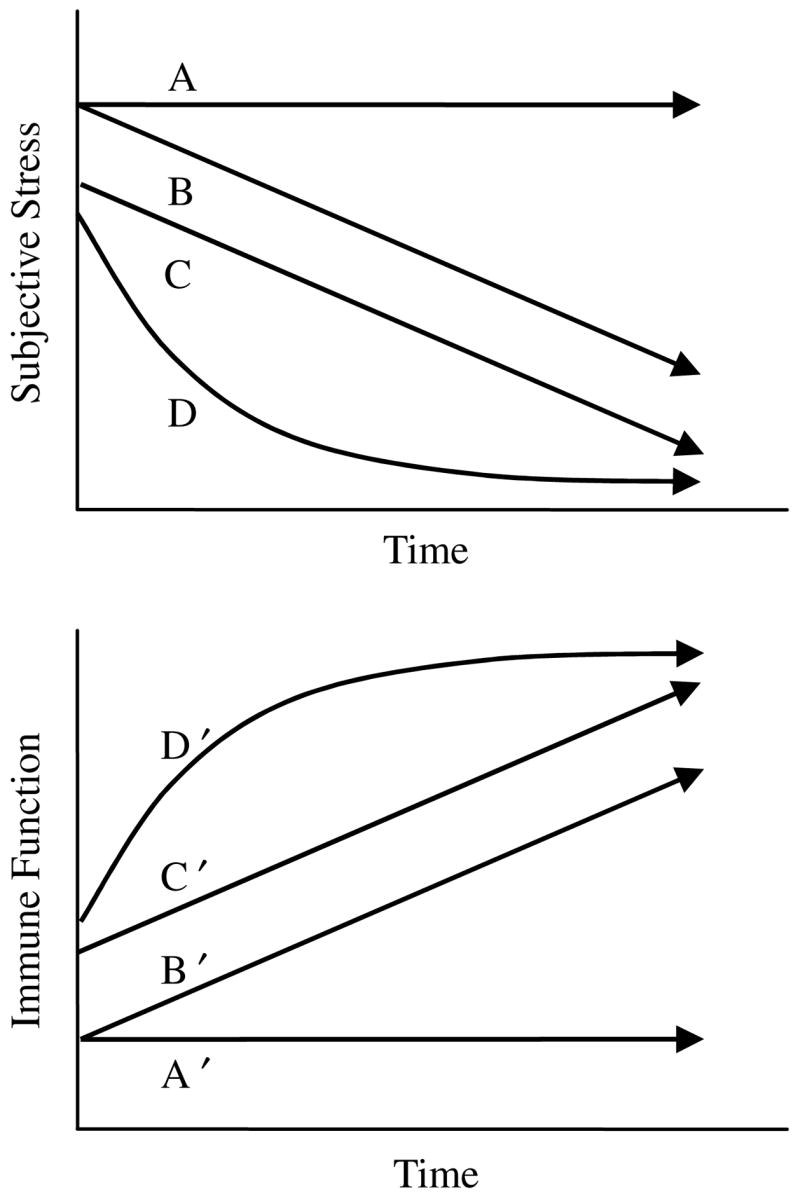
Potential patterns of change in the subjective experience of stress and immune function following a severe stressor. These hypothetical individuals illustrate individual differences in rate of change (i.e., linear slope; see Person A vs. B), level (i.e., intercept; see Person B vs. C), and shape of trajectory (i.e., quadratic change; see Person C vs. D). Panel 2 shows the hypothesized immunity for these patterns in stress.
2. Method
2.1. Participants and procedures
Participants (N = 113) were regional breast cancer patients in the control arm of a randomized clinical trial testing a psychological intervention. Detailed eligibility and accrual information have been published (Andersen et al., 2004). As reported previously, participants did not differ from eligible non-participants on sociodemographics, disease and prognostic characteristics, or recommended treatment (Andersen et al., 2004). The sociodemographic and disease data were similar to State and National databases (Ohio Department of Health, 2002; SEER, 2000). Patients were randomized between Intervention with Assessment (n = 114) versus Assessment-only (n = 113) arms, and there were no differences between participants in the two arms (Andersen et al., 2004). As the intent here is to investigate the naturalistic relationship of stress and immunity following a cancer diagnosis, data from the Assessment-only participants are used. Data from the Intervention group are not discussed further.
Women diagnosed with regional breast cancer, surgically treated within the past three months (M = 37 days, SD = 16), and awaiting adjuvant therapy were recruited. Participants were 30 to 75 years old (M = 51.2; SD = 10.8), had 6 to 22 years of education (M = 14.3, SD = 2.6), and reported an annual family income of 5 to 400 thousand dollars (median = $50K). The majority were employed (69%), had a spouse or partner (71%), and were Caucasian (90%; African American = 9%; Hispanic = 1%). Participants were diagnosed with either Stage II (92%) or Stage III (8%) disease. All received either segmental (55%) or modified radiacal mastectomy (45%), and most received adjuvant treatments (chemotherapy, 85%; radiation, 52%; hormonal therapy, 80%).
Assessments consisted of an in-person structured interview, question-naire completion, chart review, and a 60mL blood draw. Follow-up assessments were conducted at 4, 8, 12, and 18 months. Participants were followed in the present study only as long as they remained disease-free.
2.2. Measures
2.2.1. Subjective stress
Subjective Stress was operationalized as the composite of two scales, weighted equally. (a) The Perceived Stress Scale-10 Item Version (PSS- 10; Cohen et al., 1983; Golden-Kreutz et al., 2004) measures an individual’s appraisal of the demands of her environment relative to her perceived resources to meet those demands. Participants rate the degree to which they perceive their lives to be unpredictable, uncontrollable, and over-whelming. Total scores range from 0 to 40, with higher scores indicating greater stress. Coefficient alpha reliability was .87 in this sample; four-month test-retest reliability was .73. (b) The Profile of Mood States (POMS; McNair et al., 1971) is a 65-item self-report inventory of mood over the past week. A Total Mood Disturbance score summarizes psychological distress, including anxiety, depression, anger, vigor, fatigue, and confusion. Scores range from −32 to 200 with higher scores representing greater distress. Coefficient alpha reliability for the Total Mood Disturbance scale in this sample was .95; four-month test-retest reliability was .78. Cross-sectional correlations between the PSS and POMS scores ranged from .74 to .85. Equal weight of the PSS and the POMS total mood disturbance score was achieved by transforming the two scales into z-scores and computing their mean to form the Subjective Stress composite.
2.2.2. Immune function
2.2.2.1. Quantification of immune cells
Natural killer and T cells were quantified to determine their relative proportions in the functional assays. Peripheral blood leukocytes (PBLs) were labeled with florescent-conjugated monoclonal antibodies (MAbs) specific for the following cell surface markers: total T cells (CD3, fluorescein isothiocyanate), T4 subset (CD4, rhodamine), T8 subset (CD8, fluorescein isothiocyanate), and NK cells (CD56, rhodamine). MAbs were purchased from Coulter Corp. An aliquot of PBLs was treated with erythrocyte lysis buffer, resuspended in Dulbecco’s PBS, and centrifuged for 5 minutes at 585g. Cells (0.5 × 10⁶) were incubated with the appropriate MAb for 15 min in the dark on ice. After the incubation, the cells were washed, and the labeled blood cells were fixed with Dulbecco’s PBS containing 2% formaldehyde. Dual-labeled immunoglobulin was used to determine nonspecific immunofluorescence binding. Samples were analyzed with a FACS Calibur Flow Cytometer (Becton, Dickinson, and Company, Franklin Lakes, NJ).
2.2.2.2. Natural killer cell cytotoxicity
We tested NK cell activity against K562 using a standard chromium release assay, as described previously (Andersen et al., 1998; Andersen et al., 2004). PBLs were seeded in triplicate together with 51Cr-labeled target cells into 96-well V-bottom microtiter plates in a volume sufficient to provide effector to target (E:T) cell ratios of 100:1, 50:1, 25:1, 12.5:1, 6.25:1, and 3.125:1. After five hours in 5% CO2 at 37 °C, 100 μl of supernatant was harvested and counted using a CobraII Auto-Gamma counter (Packard, Downers Grove, IL). Minimum and maximum 51Cr release were determined utilizing target cells that had been incubated in complete medium or 5% SDS detergent solution, respectively. Cytotoxicity was calculated using the following equation: [Experimental 51Cr release − Minimum release/Maximum release − Minimum release] × 100%. To summarize data across E:T ratios, we calculated lytic units per 107 cells according to the method of Bryant and colleagues (Bryant et al., 1992). One lytic unit was defined as the number of effector cells killing 20% of the target cells. Data were log-transformed prior to statistical analysis, as recommended (Bryant et al., 1992).
2.2.2.3. Blastogenic response to phytohemagluttinin (PHA) and concanavalin A (Con A)
PBLs, resuspended in supplemented RPMI without phenol red, were seeded in triplicate at 0.5 × 10⁵ per well and incubated for 68 h at 37 °C, with 5% CO2, in sterile 96-well flat-bottomed plates. Wells were pulsed for the final 4 h with MTS, i.e., 3-(4,5-dimethylthiazol-2-yl)-5-(3-carboxymethoxyphenyl)-2-(4-sulfophenyl)-2H-tetrazolium, inner salt (Promega Corp., Madison, WI) and PMS (phenazine methosulfate), an electron-coupling reagent, to measure proliferative response. The MTS assay is a nonradioactive calorimetric procedure that labels metabolically active cells via reduction of a colored substrate. The amount of proliferation was determined via optical density readings of the suspension in the well compared to cells and media alone, using a VERSAmax microplate reader (Molecular Devices, Sunnyvale, CA) at a determination wavelength of 492 nm and a reference wavelength of 690 nm. The serial dilutions for PHA and Con A were 2.5, 5.0, and 10.0 μg/mL. To summarize data across assays, a Blastogenesis composite score was computed by transforming each of the six variables into z-scores and computing their mean. The coefficient alpha reliability of the Blastogenesis composite was .94.
2.2.3. Demographic, prognostic, and treatment variables
Demographic variables included age, race (Caucasian vs. minority), presence of spouse/partner (no vs. yes), and annual household income. Stage of disease (II vs. III), hormone receptor status (positive vs. negative), tumor size (cm), number of positive lymph nodes, extent of surgery (lumpectomy vs. mastectomy), and type of adjuvant treatment received (chemotherapy, radiation, and hormone therapy; no vs. yes) were included as relevant disease/treatment variables.
2.3. Analytic strategy
Preliminary analyses provide summary statistics for each variable. Examination of histograms and skewness statistics identified non-normal data.
Latent growth curve analysis (Meredith and Tisak, 1990) tested the longitudinal relationship between stress and immune function. AMOS (Arbuckle, 2003) was used to estimate the models. This software employs the full information maximum likelihood (FIML; Arbuckle, 1996) procedure, which utilizes all available data and produces consistent, efficient estimates (Arbuckle, 1997), unlike other methods (e.g., listwise deletion, pairwise deletion, and mean imputation). FIML also requires less stringent assumptions about the patterns of missing data (i.e. data need not be Missing Completely At Random; Arbuckle, 1997; Little and Rubin, 2002). Models were evaluated based on the Root Mean Square Error of Approximation (RMSEA; Browne and Cudeck, 1992) and its confidence interval (CI), the Tucker–Lewis Index (TLI; Tucker and Lewis, 1973), and the Comparative Fit Index (CFI; Hu and Bentler, 1995).
The latent growth curve analyses were conducted in three steps, as recommended (MacCallum et al., 1997). Step 1 produced a model for each variable of interest (i.e., Subjective Stress, NKCC, and Blastogenesis). The observed variables are indicators of latent factors (intercept, slope, and quadratic change) that define the underlying pattern of change. Intercept captures the initial level of the observed variable. This is accomplished by fixing all path weights from Intercept to the observed variables at one. Linear Slope captures rate of change in the observed variable. Again, all path weights from Slope to observed variables are fixed, but here the time elapsed from the start of the study (i.e., 0, 4, 8, 12, and 18) determines the weights. If the pattern of change across time is not linear, an additional Quadratic variable can be added, with path weights set at the square of time elapsed (i.e., 0, 16, 64, 144, and 324). For every model, Intercept and Slope variables were included. For each, we tested whether adding a Quadratic variable improved model fit using a chi-square difference test of nested models.
After successfully producing a latent curve model for each measure, the mean values of the Intercept, Slope, and Quadratic latent variables (i.e., fixed effects) describe the average trajectory of change across all participants in the study. Variability in Intercept, Slope, and Quadratic factors (i.e., random effects) indicate individual variability in trajectories of change.
Step 2 of the analysis paired the Subjective Stress model with each of the immunity models (Blastogenesis and NKCC) and tested for significant relationships between them. Covariances among the Intercept, Slope, and Quadratic factors test our hypotheses, as described above.
Step 3 introduced control variables. Sociodemographic, prognostic, and treatment factors that correlated with the immune measures at p < .10 were entered into the models. These control variables were entered individually, with a directional path emitted to each of the Intercept, Slope, and Quadratic factors. Paths that approached significance (p < .10) were retained for a final model. We also considered T and NK cell percentages as additional controls. Correlations between the cell percentages and functional measures at each time point were examined, and those that consistently correlated with functional measures were included as controls. When cell percentages were included in the model, they emitted a directional path to the concurrent cell function variable (rather than the latent variables). For example, the percentage of NK cells in the assay at 4 months would be entered with a directional path emitted to NKCC at 4 months.
3. Results
3.1. Data availability
Table 1 describes the sample sizes for each of the five assessment points. During the follow-up period, eight women (7%) experienced a cancer recurrence and/or died. Twelve women (11%) discontinued participation. Additional loss of data was due to patient non-compliance with a single assessment. Importantly, there were no differences on any measures used here (i.e., sociodemographic, prognostic, treatment, stress, or immunity; all ps ⩾ .078) between participants who remained in the study at 18 months (n = 93) and those who were no longer in the study (n = 20).
Table 1.
Descriptive data for stress and immune measures
| Initial (n = 113)
|
4-months (n = 91)
|
8-months (n = 91)
|
12-months (n = 86)
|
18-months (n = 81)
|
||||||
|---|---|---|---|---|---|---|---|---|---|---|
| M | SD | M | SD | M | SD | M | SD | M | SD | |
| PSS | 18.1 | 6.9 | 15.4 | 7.0 | 14.5 | 6.6 | 14.6 | 6.5 | 14.8 | 6.9 |
| POMS | 31.2 | 32.1 | 23.3 | 30.9 | 19.9 | 32.7 | 19.0 | 30.7 | 15.8 | 30.1 |
| NKCC | 34.9 | 15.6 | 37.6 | 18.7 | 40.7 | 16.2 | 42.8 | 15.9 | 48.7 | 17.9 |
| Con A | 0.18 | 0.12 | 0.16 | 0.12 | 0.18 | 0.10 | 0.14 | 0.11 | 0.21 | 0.16 |
| PHA | 0.28 | 0.15 | 0.22 | 0.14 | 0.25 | 0.14 | 0.20 | 0.13 | 0.30 | 0.19 |
Note: PSS, Perceived Stress Scale; POMS, Profile of Mood States; NKCC, natural killer cell cytotoxicity (lytic units); Con A, concanavalin A (optical density at 5 μg/mL); and PHA, phytohemaggluttinin (optical density at 5 μg/mL).
3.2. Latent curve analysis
3.2.1. Preliminary analyses
Means and standard deviations for all stress and immune measures are provided in Table 1.1 Group means of the PSS and POMS confirm that participants were experiencing substantial stress when enrolled in the study. The initial assessment means of PSS (M = 18.1) and POMS (M = 31.2) were higher than samples of US adults (PSS mean = 13.0, SD = 6.4; Cohen and Williamson, 1988) and relatives of breast cancer patients (POMS mean = 14.7, SD = 36.5; Cassileth et al., 1985), respectively. As predicted, during the follow-up period, group means declined significantly [repeated measures analysis of variance for PSS: F(4,272) = 7.00, p < .001; POMS: F(4,268) = 5.52, p < .001].
We next examined group means of the primary variables to observe patterns of change over time. The group means for Subjective Stress implied a curvilinear pattern of change, as change was greatest soon after diagnosis and appeared to stabilize after the 8-month assessment. In contrast, NKCC group means implied a linear improvement over time, and mean values for Blastogenesis showed an inconsistent pattern with a slight tendency to increase over time. Histograms and skewness statistics indicated approximately normal distributions for Subjective Stress, Blastogenesis, and NKCC.
3.2.2. Step 1: Developing univariate models
We successfully fit models to patient trajectories across all variables. These models are summarized in Table 2. Consistent with the group means, the final model for Subjective Stress was curvilinear (i.e., a Quadratic latent variable was employed), and this model showed good fit to the data [χ2(7) = 3.54, p = .83; RMSEA = .00 90% CI = .00, .07; TLI = 1.02; CFI = 1.00]. Also consistent with the group means, the final model for NKCC was linear (i.e., Slope and Intercept variables only), and the model fit the data well [χ2 (11) = 7.21, p = .78; RMSEA = .00, 90% CI = .00, .07; TLI = 1.08; CFI = 1.00].
Table 2.
Summary of parameter estimates for latent curve models created in Step 1
| Mean | Variance | |
|---|---|---|
| Subjective Stress | ||
| Intercept | 0.194* | 0.553*** |
| Linear slope | −0.062*** | 0.005* |
| Quadratic | 2.4 × 10⁻³*** | 1.3 × 10⁻⁵ |
| NKCC | ||
| Intercept | 5.259*** | 0.363*** |
| Linear slope | 0.043*** | 0.002* |
| Blastogenesis | ||
| Intercept | 0.564** | 0.324* |
| Linear slope | −0.150*** | 0.022** |
| Quadratic | 6.7 × 10⁻³*** | 5.1 × 10⁻⁵* |
Note: NKCC, natural killer cell cytotoxicity (lytic units).
p < .05.
p < .01.
p < .001.
The model for T cell blastogenesis required additional efforts. While a quadratic model showed better fit than linear, the overall fit was poor (RMSEA = .11). We hypothesized that underlying trajectories in T cell blastogenesis might be obscured by the effects of cancer treatments. We tested whether statistically removing the effects of treatment might allow us to model the underlying trajectories.2 We examined correlations between T cell blastogenesis and treatment factors (i.e., surgery, radiation, or chemotherapy). Based on these data, we included extent of surgery (segmental mastectomy = 0; modified radical mastectomy = 1) as a control on the initial time-point (the initial assessment occurred soon after surgery) and receipt of chemotherapy (no = 0; yes = 1) as a control on the 4-month time-point (most participants were receiving chemotherapy at the time of the 4-month assessment). This modification improved model fit considerably [χ2(14) = 11.70, p = .63; RMSEA = .00, 90% CI = .00, .08; TLI = 1.25; CFI = 1.00], and we were able to model the underlying patient trajectories in T cell blastogenesis after partialling out the effects of surgery and chemotherapy.
3.2.3. Step 2: Combining models into joint trajectory models
To test the hypotheses, we paired the Subjective Stress model with each immune model (i.e., NKCC, Blastogenesis), and tested for statistically significant covariances among the Intercept, Slope, and Quadratic factors. Table 3 summarizes the correlations between the Subjective Stress and immunity models.
Table 3.
Summary of correlations between the subjective stress and immunity latent variables in Step 2
| Blastogenesis
|
NKCC
|
||||
|---|---|---|---|---|---|
| Intercept | Slope | Quadratic | Intercept | Slope | |
| Subjective Stress | |||||
| Intercept | −.17* | — | — | .07 | — |
| Slope | — | .01 | .02 | — | −.68* |
| Quadratic | — | −.03 | −.04 | — | .64* |
Note: NKCC, natural killer cell cytotoxicity (lytic units). Dash indicates the correlation was not estimated.
p < .05.
First, we tested the relationship between Subjective Stress and Blastogenesis. This model showed good fit to the data [χ2(51) = 35.67, p = .95; RMSEA = .00, 90% CI = .00, .01; TLI = 1.07; CFI = 1.00]. A significant negative relationship was observed between Subjective Stress Intercept and Blastogenesis Intercept (see Table 3), as predicted by Hypothesis 1. Follow-up analyses showed that this effect was primarily driven by the PSS (p = .02). The relationship between POMS Intercept and Blastogenesis Intercept was also negative, but non-significant (p = .14).
Second, we tested the relationship between Subjective Stress and NK cell cytotoxicity. This model showed good fit to the data [χ2(40) = 44.82, p = .28; RMSEA = .03, 90% CI = .00, .08; TLI = 0.98; CFI = 0.99]. Unlike the blastogenesis data, no relationship between intercepts was found. Instead, we observed significant correlations between change in Subjective Stress and change in NKCC. NKCC Slope showed a negative correlation with Stress Linear Slope and a positive correlation with Stress Quadratic Change (see Table 3). The inverse relationship between the slopes supports Hypothesis 2, however the inclusion of the Quadratic variable complicates the picture. To illustrate the relationship, Fig. 2 contrasts the average trajectory of Subjective Stress with the trajectory of Subjective Stress when Slope is set to one standard deviation above the mean. (Note that, because Slope and Quadratic are related, as Slope increases, Quadratic decreases, leading to a ‘flatter’ line.) The predicted trajectory of NKCC differs for these two patterns. When Subjective Stress declines rapidly, then stabilizes, NKCC is predicted to show a rapid increase. In contrast, if Subjective Stress declines slowly, NKCC is predicted to show little improvement. Follow-up analyses once again showed that the observed relationship was primarily driven by PSS (p = .002), while POMS was non-significant (p = .37).
Fig. 2.
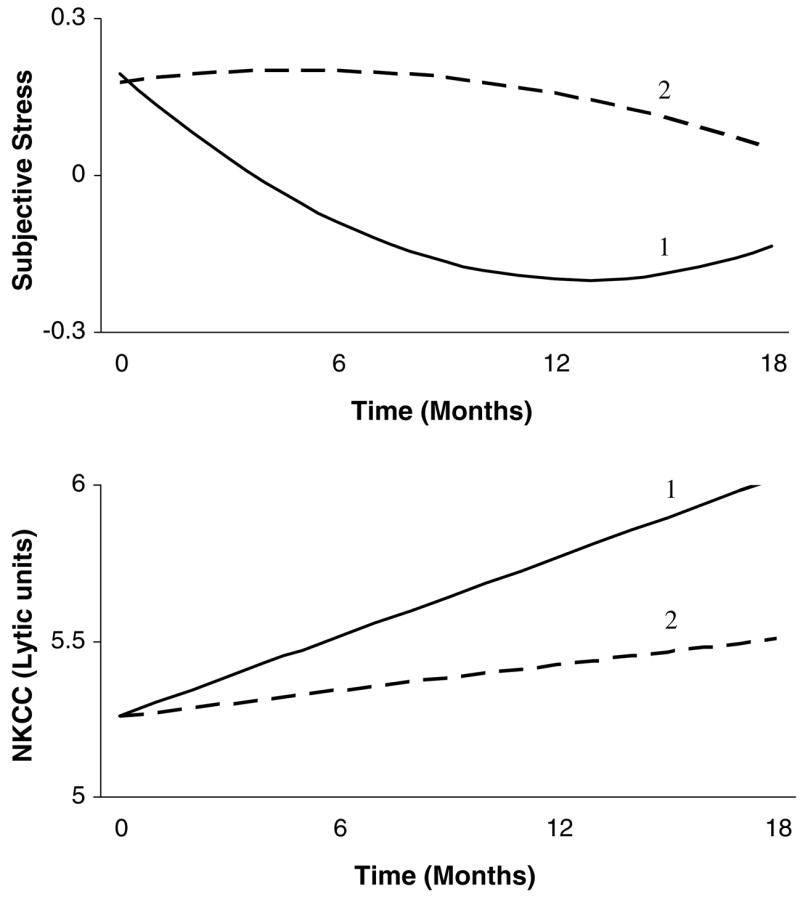
Graphical representation of the relationship between subjective stress and natural killer cell cytotoxicity (NKCC), as revealed by the latent growth curve model. Pattern 1 reflects the group mean trajectory for subjective stress. Corresponding NKCC is also at the group mean. Results suggest that a slower rate of decline in stress is accompanied by a slower rate of increase in NKCC. Therefore, Pattern 2 reflects a trajectory in which rate of change in stress (Subjective Stress Slope) is one standard deviation above the mean. Change in the curvature of the line accompanies this change in rate of change, because Subjective Stress Slope correlates with Subjective Stress Quadratic. For Pattern 2, rate of change in NKCC is predicted to be lower.
3.2.4. Step 3: The introduction of controls
The final step tested if the observed relationships were robust to demographic, prognostic, or treatment factors and whether they were influenced by the proportions of NK and T cells present. We first examined correlations between potential controls and immune outcomes. Correlations between the demographic/disease factors and immune variables were modest, below .3. Correlations between NKCC and NK cell percentages were consistently positive, ranging from .08 to .36, and the estimated population correlation (ρ) was .17 (p < .01). Correlations between blastogenesis and the percent of CD4+ T-helper cells were also consistently positive (range = 0–.27, estimated ρ = .14, p < .05), while correlations with total T cells (CD3+; range = −.29 to .29, estimated ρ = .05, p > .05) and CD8+ T-cytotoxic/suppressor cells (range = −.28 to .14, estimated ρ = −.09, p > .05) were inconsistent.
For the model of NKCC, we controlled NK cell percentage, race, family income, hormone receptor status (ER/PR), and receipt of hormonal therapy. For Blastogenesis, we controlled T-helper cell percentage and age. Note that extent of surgery and receipt of chemotherapy were already represented in the model of Blastogenesis. Both controlled models showed adequate fit to the data [NKCC with Subjective Stress: χ2(130) = 166.1, p < .05; RMSEA = .05, 90% CI = .02, .07; TLI = 0.91; CFI = 0.94; Blastogenesis with Subjective Stress: χ2(102) = 101.5, p = .50; RMSEA = .00, 90% CI = .00, .05; TLI = 1.00; CFI = 1.00].
All the significant relationships between stress and immune function observed in Step 2 remained significant when controls were added to the respective models. Therefore, the observed relationships between the psychological and immunological trajectories were not a result of sociodemographic, prognostic, treatment factors, or the numbers of cells present.
4. Discussion
This is the first study to investigate trajectories in stress and immunity during recovery from a major stressor. In doing so, we provide a statistically powerful test of the relationship between the subjective experience of stress and immune function. Further, the examination of trajectories allows us to parse out different aspects of the stress response and test their relationship with immunity. We hypothesized that between-subject differences in levels of subjective stress at study entry (i.e., Intercepts) would correspond inversely to levels of immunity. This relationship was found between Subjective Stress (a composite of perceived stress and distress) and T cell blastogenesis (a composite of proliferative responses to Con A and PHA). Participants who entered the study with the greatest stress also showed the poorest blastogenesis response. Our second hypothesis proposed that rate of improvement in stress over the follow-up period would correspond to rate of improvement in immunity. This relationship was found between Subjective Stress and NK cell function. Participants whose stress declined the fastest also showed the most rapid improvement in NKCC. Follow-up analyses suggested that both effects appeared to be influenced by perceived stress (rather than emotional distress), and effects were not an artifact of sociodemographic, prognostic or treatment factors, or of proportions of cells in the assays.
Blastogenesis was related to levels, but not change in subjective stress. Interpretation of this effect considers two features of the Intercept latent variable: It was influenced by data at all time points, and it was scaled to reflect participants’ scores at study entry. Thus, this analysis produces a reliable indicator of between-subject differences in stress and distress at study entry, when subjective experiences of stress are at their highest. What might produce individual variability in this peak stress? Sociodemographic, disease, and treatment factors do not seem to do so, as none of these correlated with initial subjective stress. We speculate that individual variability in the Intercept could be related to personal or social factors. Individual characteristics such as repression, defensiveness, introversion, pessimistic attributional style, and trait anxiety have all been associated with poorer immune function (see Segerstrom, 2000). As the Intercept latent variable is influenced by data across all time points, it is possible that such long-standing characteristics contribute substantially to its variability.
We can interpret these results in the context of experimental studies which aim to alter both stress and immunity in stressed samples. Few studies of this kind have been conducted, and fewer still have done so with medically ill populations (see Andersen, 2002; Miller and Cohen, 2001 for reviews). Based on the results of the present study, we would predict that an intervention which prevents or minimizes the “peak” subjective stress following a stressor would be most effective in impacting T cell blastogenesis. Thus, intervening prior to or during a stressor is preferable to intervening after the stressor ends. Antoni and colleagues (Antoni et al., 1991) sought to minimize subjective stress from HIV serostatus notification by enrolling men (N = 47) in a cognitive-behavioral stress management intervention prior to notification of their results. The intervention successfully buffered both the emotional distress (POMS depression) and reduction in PHA that were associated with the stressor. For those receiving a life-threatening diagnosis, anticipation of future difficult treatments could prolong the peak stress period (Compas and Luecken, 2002). In our psychosocial intervention (Andersen et al., 2004), group sessions began either before or shortly after the start of adjuvant treatment for breast cancer (N = 227). While some patients may have experienced their highest stress prior to study entry (i.e., before surgery), stress remains high for those who face additional, difficult treatments. Consistent with hypotheses, the intervention was associated with higher Con A and PHA blastogenesis at 4-month follow-up. A third intervention study (van der Pompe et al., 1997) found no benefit in PHA blastogenesis for breast cancer patients (N = 23) participating in experiential-existential group psychotherapy. Although the intervention was conducted within a reasonable time period following the stressor (about 4 months after surgery), and participants showed significant levels of emotional distress at study entry, these patients did not face additional medical stressors (i.e., none were prescribed radiation or chemotherapy treatments). Therefore, it is likely that participants perceived that the stressor had ended prior to study entry.
While T cell blastogenesis related to peak levels, but not change in subjective stress, natural killer cell cytotoxicity showed the opposite pattern: NKCC was related to change, but not level in subjective stress. As participants’ perceptions of their lives as “unpredictable, uncontrollable, and overwhelming” abated, as they re-established a sense of mastery or order in their lives, this change process paralleled improvements in NKCC. The relationship was more complex than the simple mirroring effect proposed in Fig. 1, as Subjective Stress showed curvilinear change while NKCC showed linear change (see Fig. 2), nevertheless, individuals who showed the greatest initial improvement in perceived stress showed the greatest overall improvement in NKCC.
This finding is interesting to interpret in light of the relatively weak relationship between NKCC and chronic stressors observed in the literature (e.g. Herbert and Cohen, 1993; Segerstrom and Miller, 2004). We offer three speculations regarding this effect. First, analysis of change in this longitudinal study not only parses out different aspects of the stress response, but it also effectively controls for basal levels of NKCC. There is naturally a wide variation in the basal activity of NK cells among individuals (Brittenden et al., 1996), and controlling for this variability may have led to the strong relationship between stress and NKCC observed here. Second, these results highlight the importance of time course in stress for NKCC. Participants with high “peak” stress did not show poorer concurrent NKCC, yet those whose stress persisted after the initial assessment showed slow improvement in NKCC. It is possible that stress effects on NKCC appear only when stress persists over time. Brosschot and colleagues have argued for the importance of perseverative cognition in producing stress-related health consequences (Brosschot et al., 2006; Brosschot et al., 2005). They posit that worry, rumination, and anticipatory stress prolong stress-related physiological activation. Our data fit this hypothesis, particularly when one considers the follow-up analyses, which showed that change in perceived stress (or conversely, lack of change in perceived stress) showed a significant relationship with NKCC. A third implication of the present data is that the relationship between stress and NKCC is not linear. During the first portion of the follow-up period, a large change in perceived stress was accompanied by a moderate change in NKCC, and later, a small change in perceived stress was accompanied by another moderate change in NKCC (see Fig. 2). It may be fruitful for future researchers to investigate nonlinear relationships between stress and NK cell function.
Stress-reduction interventions have sought to improve NKCC in stressed populations. Although the data are few, results suggest that NKCC is less amenable to change than T cell blastogenesis (Andersen, 2002; Miller and Cohen, 2001). Data from the present study show that, while a large initial reduction in subjective stress is accompanied by only a modest NKCC increase, later, much smaller reductions in subjective stress correspond to additional, modest NKCC increases. Based on these data we would hypothesize that intervention effects for NKCC would become more perceptible over time; thus, interventions with longer follow-up periods would be more likely to show effects in NKCC. In addition, NKCC improvement would be more likely when interventions have enduring effects on subjective stress (such as via longer interventions). Consistent with this prediction, Fawzy and colleagues (Fawzy et al., 1990) reported that NKCC improvement following a group psychiatric intervention for malignant melanoma patients (N = 61) was not apparent at 6-week follow-up, but significant effects emerged at 6-month follow-up. Other studies reporting either short-term intervention or early follow-up results reported no intervention benefits for NKCC (Larson et al., 2000; Andersen et al., 2004). While it is outside the scope of the present study, future research may test whether observed intervention effects on NKCC are related to altered rates of improvement in perceived stress among intervention participants.
Immunocompetence could help prevent a recurrence of cancer. Although the relationships between immune function and cancer recurrence are complex and under extensive study, enough correlational and circumstantial evidence implicates NK and T cell function as plausible cancer-fighting mechanisms (see Sharma and Browning, 2005 and Jakobisiak et al., 2003 for recent reviews). Gene “knock-out” studies, for example, show that mice with deficient T or B cells develop malignancies at an exceptionally high rate (Shankaran et al., 2001), and mice with deficient NK cells show impaired rejection of tumor cells (Kim et al., 2000). One issue that complicates cancer immunology is the ability of tumor cells to escape immune detection or destruction. In fact, evidence suggests that the immune response itself contributes, through selection, to the development of tumor cells that can evade the immune system (Dunn et al., 2002). Further, tumor immune escape mechanisms vary considerably from one malignancy to the next and from person to person. Given the complexity of the issue and the multiple disease and person factors affecting the role of the immune system in cancer, we offer cautious clinical interpretations of the present data. We believe the stress-related immune impairments described in the present study will be clinically relevant for most, but not all participants. For those patients whose tumors are able to escape immune detection, for example, a strong NK response may not matter. However, for those whose malignancies are in some way vulnerable to immune attack, it seems intuitive that adequate immune function is a prerequisite to effective response to the tumor.
An important feature of the present analyses is the inclusion of controls in the models. Even though demographic and disease factors might affect both immunological and psychological status, analytic results show they do not drive the relationships between stress and immunity. As noted above, the analytic strategy sought to include control variables during Step 3 of the analysis. However, it was necessary to include treatment variables in the T cell blastogenesis models in Step 1 in order to fit latent curve models. Interpretation of the analyses is ultimately unchanged. These analyses simply removed the effects of surgery and chemotherapy from the data prior to estimating the latent variables, whereas in the planned analyses, effects of control variables were removed from the trajectories. The controls still serve their intended function: to establish that relationships between stress and immunity are not an artifact of patient characteristics or treatment. An additional benefit of the present analyses is the full utilization of incomplete data. The FIML procedure allowed us to use data from all participants, regardless of how many assessments they completed, enhancing the generalizability of the findings.
Although the analyses in the present study yielded important, interesting findings, some limitations must be noted. First, our sample is limited to regional breast cancer patients who were primarily middle-aged, Caucasian women. Generalization to patients with cancer of other sites, healthy populations, ethnic minorities, young people, and men must be done cautiously. Of course, neither causality nor temporal precedence can be confirmed with these analyses. The relationship between stress and immune function is generally understood to indicate that stress impairs immune function, but the reverse relationship has also been considered. Pro-inflammatory cytokines, for example, have been shown to communicate with the central nervous system, producing behavioral consequences (Anisman et al., 2002; Kelley et al., 2003). Further, stress could affect breast cancer metastasis through routes independent of immune function (e.g., hormonal effects, Sephton and Spiegel, 2003).
Previously, we have shown that high subjective stress following cancer surgery (Andersen et al., 1998) is associated with impaired cellular immune response. The present analyses extend this investigation to test whether patterns of psychological recovery following this severe stressor can have immune consequences. We are observing individual variability in participants’ reactions to a similar stressor, as individuals employ whatever personal and social resources they have available. Our results reveal a divergence, hitherto unobserved, of the relationship of perceived stress with T and NK cells over time. This difference could indicate a difference in the physiological processes that produce stress-related change in these cells. Future research may investigate endocrine mediators of this effect, such as cortisol, or regulatory cytokines. At present, this study demonstrates the rich understanding that can be garnered from examination of psychological and biological trajectories.
Acknowledgments
Preparation of this manuscript was supported in part by the Susan G. Komen Breast Cancer Foundation Dissertation Research Award, the American Cancer Society Grant PBR-89, the Longaberger Company-American Cancer Society Grant for Breast Cancer Research PBR-89A, the US Army Medical Research Acquisition Activity Grants DAMD17-94-J-4165, DAMD17-96-1-6294, and DAMD17-97-1-7062, the National Institute of Mental Health Grant R01 MH51487, National Cancer Institute Grants R01 CA92704, K05 CA098133, P30 CA16058, and a General Clinical Research Center grant MO1-RR0034. We wish to thank the participants for their assistance. In addition, we thank the research sta. of the SIBCP, and Drs. Catherine Stoney and Jay Myung, for their comments and suggestions on an earlier version.
Footnotes
This research was conducted in the Departments of Psychology and Surgery, and the Comprehensive Cancer Center of the Ohio State University; and Primetrics, Inc., Columbus, OH. This manuscript was based on a dissertation by the first author (LMT).
We provide mean immune values for the sample as a whole. Some readers may be interested in patterns of immune measures among participant subgroups (e.g., based on surgery type or adjuvant therapy regimen). These can be provided upon request.
Although treatment may also affect NKCC, the aim of this stage of the analysis was to produce a model of patient trajectories, and treatment was included here only to that end. For the remaining models, treatment and all other controls were introduced in Step 3 of the analyses.
References
- Andersen BL. Biobehavioral outcomes following psychological interventions for cancer patients. J Consult Clin Psychol. 2002;70:590–610. doi: 10.1037//0022-006X.70.3.590. [DOI] [PMC free article] [PubMed] [Google Scholar]
- Andersen BL, Farrar WB, Golden-Kreutz D, Kutz LA, MacCallum R, Courtney ME, Glaser R. Stress and immune responses after surgical treatment for regional breast cancer. J Natl Cancer Inst. 1998;90:30–36. doi: 10.1093/jnci/90.1.30. [DOI] [PMC free article] [PubMed] [Google Scholar]
- Andersen BL, Farrar WB, Golden-Kreutz DM, Glaser R, Emery CF, Crespin TR, Shapiro CL, Carson WE., III Psychological, behavioral, and immune changes following a psychosocial intervention: a clinical trial. J Clin Oncol. 2004;17:3570–3580. doi: 10.1200/JCO.2004.06.030. [DOI] [PMC free article] [PubMed] [Google Scholar]
- Anisman H, Hayley S, Turrin N, Merali Z. Cytokines as a stressor: implications for depressive illness. Int J Neuropsychoph. 2002;5:357–373. doi: 10.1017/S1461145702003097. [DOI] [PubMed] [Google Scholar]
- Antoni MH, Baggett L, Ironson G, LaPerriere A, August S, Klimas N, Schneiderman N, Fletcher MA. Cognitive-behavioral stress management intervention buffers distress responses and immunologic changes following notification of HIV-1 seropositivity. J Consult Clin Psychol. 1991;59:906–915. doi: 10.1037//0022-006x.59.6.906. [DOI] [PubMed] [Google Scholar]
- Arbuckle JL. Full information estimation in the presence of incomplete data. In: Marcoulides GA, Schumacker RE, editors. Advanced Structural Equation Modeling. Lawrence Erlbaum Associates; Muwah, NJ: 1996. [Google Scholar]
- Arbuckle JL. AMOS Users’ Guide Version 3.6. SPSS Incorporated; Chicago, IL: 1997. [Google Scholar]
- Arbuckle JL. Amos (Version 5.0) [Computer Program] Chicago, IL: SPSS; 2003. [Google Scholar]
- Brittenden J, Heys SD, Ross J, Eremin O. Natural killer cells and cancer. Cancer. 1996;77:1226–1243. doi: 10.1002/(sici)1097-0142(19960401)77:7<1226::aid-cncr2>3.0.co;2-g. [DOI] [PubMed] [Google Scholar]
- Brosschot JF, Pieper S, Thayer JF. Expanding stress theory: prolonged activation and perseverative cognition. Psychoneuroendocrinology. 2005;30:1043–1049. doi: 10.1016/j.psyneuen.2005.04.008. [DOI] [PubMed] [Google Scholar]
- Brosschot JF, Gerin W, Thayer JF. The perseverative cognition hypothesis: a review of worry, prolonged stress-related physiological activation, and health. J Psychosom Res. 2006;60:113–124. doi: 10.1016/j.jpsychores.2005.06.074. [DOI] [PubMed] [Google Scholar]
- Browne MW, Cudeck R. Alternative ways of assessing model fit. Sociol Method Res. 1992;21:230–258. [Google Scholar]
- Bryant J, Day R, Whiteside TL, Herberman RB. Calculation of lytic units for the expression of cell-mediated cytotoxicity. J Immunol Methods. 1992;146:91–103. doi: 10.1016/0022-1759(92)90052-u. [DOI] [PubMed] [Google Scholar]
- Cassileth BR, Lusk EJ, Brown LL, Cross PA. Psychosocial status of cancer patients and next of kin: normative data from the Profile of Mood States. J Psychosoc Oncol. 1985;3:99–105. [Google Scholar]
- Cohen S, Williamson G. Perceived stress in a probability sample of the united states. In: Spacapan S, Oskamp S, editors. The Social Psychology of Health. Sage; Newbury Park, CA: 1988. pp. 31–67. [Google Scholar]
- Cohen S, Kamarck T, Mermelstein R. A global measure of perceived stress. J Health Soc Behav. 1983;24:385–396. [PubMed] [Google Scholar]
- Compas BE, Luecken L. Psychological adjustment to breast cancer. Curr Dir Psychol Sci. 2002;11:111–114. [Google Scholar]
- Dunn GP, Bruce AT, Ikeda H, Old LJ, Schreiber RD. Cancer immunoediting: from immunosurveillance to tumor escape. Nat Immunol. 2002;3:991–998. doi: 10.1038/ni1102-991. [DOI] [PubMed] [Google Scholar]
- Edgar L, Rosberger Z, Nowlis D. Coping with cancer during the first year after diagnosis. Assessment and intervention Cancer. 1992;69:817–828. doi: 10.1002/1097-0142(19920201)69:3<817::aid-cncr2820690334>3.0.co;2-s. [DOI] [PubMed] [Google Scholar]
- Fawzy FI, Kemeny ME, Fawzy NW, Elasho R, Morton D, Cousins N, Fahey JL. A structured psychiatric intervention for cancer patients: II Changes over time in immunological measures. Arch Gen Psychiatry. 1990;47:729–735. doi: 10.1001/archpsyc.1990.01810200037005. [DOI] [PubMed] [Google Scholar]
- Ganz P, Coscarelli A, Fred C, Kahn B, Polinsky ML, Petersen L. Breast cancer survivors: psychosocial concerns and quality of life. Breast Cancer Res Treat. 1996;38:183–199. doi: 10.1007/BF01806673. [DOI] [PubMed] [Google Scholar]
- Golden-Kreutz DM, Browne MW, Frierson GM, Andersen BL. Assessing stress in cancer patients: a second-order factor analysis model for the perceived stress scale. Assessment. 2004;11:216–223. doi: 10.1177/1073191104267398. [DOI] [PMC free article] [PubMed] [Google Scholar]
- Helgeson VS, Snyder P, Seltman H. Psycholgical and physical adjustment to breast cancer over 4 years: identifying distinct trajectories of change. Health Psychol. 2004;23:3–15. doi: 10.1037/0278-6133.23.1.3. [DOI] [PubMed] [Google Scholar]
- Herbert TB, Cohen S. Stress and immunity in humans: a metaanalytic review. Psychosom Med. 1993;55:364–379. doi: 10.1097/00006842-199307000-00004. [DOI] [PubMed] [Google Scholar]
- Hu LT, Bentler PM. Evaluating model fit. In: Hoyle RH, editor. Structural Equation Modeling: Concepts, Issues, and Applications. Sage Publications, Inc; Thousand Oaks California: 1995. pp. 76–99. [Google Scholar]
- Ironson G, Wynings C, Schneiderman N, Baum A, Rodriguez M, Greenwood D, Benight C, Antoni M, LaPerriere A, Huang H, Klimas N, Fletcher MA. Posttraumatic stress symptoms, intrusive thoughts, loss, and immune function after Hurricane Andrew. Psychosom Med. 1997;59:128–141. doi: 10.1097/00006842-199703000-00003. [DOI] [PubMed] [Google Scholar]
- Jakobisiak M, Lasek W, Golab J. Natural mechanisms protecting against cancer. Immunol Lett. 2003;90:103–122. doi: 10.1016/j.imlet.2003.08.005. [DOI] [PubMed] [Google Scholar]
- Kelley KW, Bluthe RM, Dantzer R, Zhou JH, Shen WH, Johnson RW, Broussard SR. Cytokine-induced sickness behavior. Brain Behav Immun. 2003;17:S112–S118. doi: 10.1016/s0889-1591(02)00077-6. [DOI] [PubMed] [Google Scholar]
- Kiecolt-Glaser JK, McGuire L, Robles TF, Glaser R. Psychoneuroimmunology: psychological influences on immune function and health. J Consult Clin Psychol. 2002;70:537–547. doi: 10.1037//0022-006x.70.3.537. [DOI] [PubMed] [Google Scholar]
- Kim S, Iizuka K, Aguila HL, Weissman IL, Yokoyama WM. In vivo natural killer cell activities revealed by natural killer cell-deficient mice. Proc Natl Acad Sci USA. 2000;97:2731–2736. doi: 10.1073/pnas.050588297. [DOI] [PMC free article] [PubMed] [Google Scholar]
- Larson MR, Duberstein PR, Talbot NL, Caldwell C, Moynihan JA. A presurgical psychosocial intervention for breast cancer patients: psychological distress and the immune response. J Psychosom Res. 2000;48:187–194. doi: 10.1016/s0022-3999(99)00110-5. [DOI] [PubMed] [Google Scholar]
- Little RJA, Rubin DB. Statistical Analysis with Missing Data. Wiley-Interscience; Hoboken, NJ: 2002. [Google Scholar]
- MacCallum RC, Kim C, Malarkey WB, Kiecolt-Glaser JK. Studying multivariate change using multilevel models and latent curve models. Multivar Behav Res. 1997;32:215–253. doi: 10.1207/s15327906mbr3203_1. [DOI] [PubMed] [Google Scholar]
- Maes M, Van Bockstaele DR, Gastel A, Song C, Schotte C, Neels H, DeMeester I, Scharpe S, Janca A. The effects of psychological stress on leukocyte subset distribution in humans: evidence of immune activation. Neuropsychobiology. 1999;39:1–9. doi: 10.1159/000026552. [DOI] [PubMed] [Google Scholar]
- McNair DM, Lorr M, Droppleman LF. EITS Manual for the Profile of Mood States. Educational and Industrial Testing Service; San Diego: 1971. [Google Scholar]
- Meredith W, Tisak J. Latent curve analysis. Psychometrika. 1990;55:107–122. [Google Scholar]
- Miller GE, Cohen S. Psychological interventions and the immune system: a meta-analytic review and critique. Health Psychol. 2001;20:47–63. doi: 10.1037//0278-6133.20.1.47. [DOI] [PubMed] [Google Scholar]
- Ohio Department of Health. Community health assessments and the center for public health data and statistics 2002 [Google Scholar]
- Surveillance, Epidemiology, and End Results Program (SEER) Division of Cancer Control and Population Sciences. National Cancer Institute; Bethesda, MD: [Google Scholar]
- Segerstrom SC. Personality and the immune system: models, methods, and mechanisms. Ann Behav Med. 2000;22:180–190. doi: 10.1007/BF02895112. [DOI] [PubMed] [Google Scholar]
- Segerstrom SC. Individual differences, immunity, and cancer: lessons from personality psychology. Brain Behav Immun. 2003;17:S92–S97. doi: 10.1016/s0889-1591(02)00072-7. [DOI] [PubMed] [Google Scholar]
- Segerstrom SC, Miller GE. Psychological stress and the human immune system: a meta-analytic study of 30 years of inquiry. Psychol Bull. 2004;130:601–630. doi: 10.1037/0033-2909.130.4.601. [DOI] [PMC free article] [PubMed] [Google Scholar]
- Sephton S, Spiegel D. Circadian disruption in cancer: a neuroendocrine-immune pathway from stress to disease? Brain Behav Immun. 2003;17:321–328. doi: 10.1016/s0889-1591(03)00078-3. [DOI] [PubMed] [Google Scholar]
- Shankaran V, Ikeda H, Bruce AT, White JM, Swanson PE, Old LJ, Schreiber RD. IFNgamma and lymphocytes prevent primary tumour development and shape tumour immunogenicity. Nature. 2001;410:1107–1111. doi: 10.1038/35074122. [DOI] [PubMed] [Google Scholar]
- Sharma RA, Browning MJ. Mechanisms of the self/non-self-survey in the defense against cancer: potential for chemoprevention? Crit Rev Oncol Hematol. 2005;56:5–22. doi: 10.1016/j.critrevonc.2004.12.009. [DOI] [PubMed] [Google Scholar]
- Shimamiya T, Terada N, Wakabayashi S, Mohri M. Mood change and immune status of human subjects in a 10-day confinement study. Aviat Space Envir Med. 2005;76:481–485. [PubMed] [Google Scholar]
- Stone AA, Cox DS, Valdimarsdottir H, Jandorf L, Neale JM. Evidence that secretory IgA antibody is associated with daily mood. J Pers Soc Psychol. 1987;52:988–993. doi: 10.1037//0022-3514.52.5.988. [DOI] [PubMed] [Google Scholar]
- Theorell T, Orth-Gomer K, Eneroth P. Slow-reacting immunoglobulin in relation to social support and changes in job strain: a preliminary note. Psychosom Med. 1990;52:511–516. doi: 10.1097/00006842-199009000-00003. [DOI] [PubMed] [Google Scholar]
- Thornton LM, Andersen BL. Psychoneuroimmunology examined: the role of subjective stress. Cell Sci. 2006;2:66–91. [PMC free article] [PubMed] [Google Scholar]
- Tucker LR, Lewis C. A reliability coefficient for maximum likelihood factor analysis. Psychometrika. 1973;38:1–10. [Google Scholar]
- van der Pompe G, Duivenvoorden HJ, Antoni MH, Visser A, Heijnen CJ. Effectiveness of a short-term group psychotherapy program on endocrine and immune function in breast cancer patients: an exploratory study. J Psychosom Res. 1997;42:453–466. doi: 10.1016/s0022-3999(96)00393-5. [DOI] [PubMed] [Google Scholar]