Abstract
The mammalian carotid body (CB) is a polymodal chemosensor which can detect low blood glucose (hypoglycaemia), leading to increased afferent discharge and activation of counter-regulatory autonomic pathways. The underlying neurotransmitter mechanisms are unknown and controversy surrounds whether the action of low glucose is direct or indirect. To address this, we used a coculture model containing functional chemosensory units of rat CB receptor (type I) cell clusters and afferent petrosal neurones (PN). During perforated-patch, whole-cell recordings, low glucose (0–2 mm) stimulated sensory discharge in cocultured PN. When the background PO2 was lowered to levels typical of arterial blood (∼90 mmHg), robust PN chemoexcitation could be induced by physiological hypoglycaemia (3.3–4 mm glucose). These sensory responses were reversibly inhibited by a combination of purinergic (suramin, 50 μm) and nicotinic (mecamylamine, 1 μm) receptor blockers, suggesting that transmission depended on corelease of ATP and ACh. Hypoglycaemic responses were additive with those evoked by hypoxia or hypercapnia; further, they could be potentiated by the GABAB receptor blocker (CGP 55845) and inhibited by 5-HT2A receptor blockers (ketanserin or ritanserin). During paired simultaneous recordings from a PN and a type I cell in an adjacent cluster, the afferent PN response coincided with type I cell depolarization, which was associated with a decrease in input resistance. In fresh tissue slices of rat CB, low glucose stimulated ATP secretion as determined by the luciferin–luciferase assay; this secretion was cadmium sensitive, potentiated by CGP 55845, and inhibited by ketanserin. Taken together these data indicate that CB receptors act as direct glucosensors, and that processing of hypoglycaemia utilizes similar neurotransmitter and neuromodulatory mechanisms as hypoxia.
The mammalian carotid body (CB) is a peripheral chemoreceptor organ whose long-established role is to sense blood gases (O2 and CO2) and pH and initiate corrective changes in ventilation so as to maintain blood homeostasis (Gonzalez et al. 1994). The ability of this organ to sense other blood-borne stimuli including osmolarity and temperature has expanded its role as a polymodal sensor and, the recognition that it can additionally participate in blood glucose sensing has attracted much recent attention (Lopez-Barneo, 2003). Following the initial demonstration that intravascular glucose administration suppressed CB sensory discharge (Alvarez-Buylla & de Alvarez-Buylla, 1988), a key role of the organ in systemic glucose homeostasis was subsequently indicated by the impaired counter-regulatory neuroendocrine responses in CB-denervated animals following insulin-induced mild hypoglycaemia (Koyama et al. 2000). Evidence for a direct involvement of CB chemoreceptors (type I cells) in glucose sensing was obtained in carbon fibre amperometric studies on cultured thin slices of rat CB, where low glucose induced catecholamine secretion from type I cells (Pardal & Lopez-Barneo, 2002; Lopez-Barneo, 2003). This secretion depended on entry of extracellular calcium via L-type Ca2+ channels and was facilitated by membrane depolarization, presumed to be triggered by low-glucose induced inhibition of K+ channels (Pardal & Lopez-Barneo, 2002). Interestingly, the effects of low glucose and hypoxia on secretion were additive, and at arterial levels of PO2 (∼90 mmHg) type I cell activity was modulated by glucose concentrations in the physiological range (Lopez-Barneo, 2003).
Despite the above compelling arguments for the ability of CB type I cells to act as direct glucosensors, a more recent study questioned this role and suggested the action of low glucose was indirect (Bin-Jaliah et al. 2004). In the latter study, insulin-induced hypoglycaemia increased spontaneous ventilation in adult rats, which was dependent on an intact carotid sinus nerve (CSN); however, superfusion of low glucose failed to stimulate chemoreceptor CSN discharge in the isolated CB–sinus nerve preparation in vitro. These authors concluded that CB involvement in glucose homeostasis depended on its transduction of some other metabolically derived blood-borne factor, rather than low glucose per se (Bin-Jaliah et al. 2004). The reasons for the discrepancy surrounding whether CB chemoreceptors act as direct or indirect glucosensors are currently unknown, but may be related to methodological differences. In the present study, we attempted to resolve this issue using an approach that combined aspects of the two methods. First, we used an established coculture model where functional chemosensory units were re-constructed in vitro between isolated rat CB type I cell clusters and dissociated petrosal neurones, the source of the afferent innervation (Zhong et al. 1997; Nurse & Zhang, 1999; Zhang et al. 2000; Zhang & Nurse, 2004; Nurse, 2005). This preparation has the advantage that diffusional barriers present in the intact CB are absent, and the receptor potential and/or afferent chemosensory response can be recorded from identified cells. Second, to avoid the criticism that cells and tissues in culture may present an abnormal physiology, we tested the effects of low glucose on fresh thin CB slices but monitored instead secretion of ATP, which, unlike catecholamines, is now generally accepted as a key excitatory neurotransmitter in CB chemotransduction (Zhang et al. 2000; Prasad et al. 2001; Rong et al. 2003; Buttigieg & Nurse, 2004; Iturriaga & Alcayaga, 2004; Gourine, 2005; Nurse, 2005; He et al. 2005). Additionally, using these two approaches we examined whether GABA and 5-HT, previously shown to act in rat CB as opposing autocrine/paracrine neuromodulators of hypoxia chemotransmission (Zhang & Nurse, 2000; Fearon et al. 2003; Zhang et al. 2003; Nurse, 2005), also participated in responses to hypoglycaemia. Finally, we tested in coculture whether the effects of hypoxia and hypercapnia interacted additively with hypoglycaemia at the level of the afferent sensory discharge (Pardal & Lopez-Barneo, 2002; Lopez-Barneo, 2003). Our results support the hypothesis that type I cells are direct glucosensors, and we show that synaptic processing of hypoglycaemic stimuli by the CB utilizes similar neurotransmitter and neuromodulatory mechanisms as previously reported for hypoxia.
Methods
Cell culture
The procedures for culture of dispersed rat carotid body (CB) type I cell clusters, with or without cocultured petrosal neurones, were similar to those described in detail elsewhere (Stea & Nurse, 1991, 1992; Zhong et al. 1997; Zhang et al. 2000). Rat pups, 10–14 days old (Wistar, Charles River, Quebec, Canada), were first rendered unconscious by a blow to the back of the head, and then killed immediately by decapitation. All procedures for animal handling and tissue dissections were carried out according to the guidelines of the Canadian Council on Animal Care (CCAC). Excised CBs were incubated for ∼45 min at 37°C in an enzymatic solution containing 0.1% collagenase–0.1% trypsin (Gibco, Grand Island, NY, USA), prior to mechanical dissociation and trituration of the tissue. The resulting cell suspension, containing incompletely dissociated type I cell clusters and single cells, was plated onto a thin layer of Matrigel (Collaborative Research, Bedford, MA, USA) that was previously applied to the central wells of 35 mm tissue culture dishes. To produce cocultures, an overlay of dissociated rat petrosal neurones was usually added 3–4 days after type I cells were plated (Zhong et al. 1997; Nurse & Zhang, 1999; Zhang et al. 2000). Cultures were grown at 37°C in a humidified atmosphere of 95% air–5% CO2. Electrophysiological, patch-clamp recordings from cocultures were usually carried out 3–6 days after the neurones were plated. In a few experiments on CB cells cultured without neurones, recordings were obtained from single type I cells within 24 h of isolation.
Solutions and drugs
Most electrophysiological experiments were performed using extracellular fluid (ECF) of the following composition (mm): NaCl, 110; KCl, 5; CaCl2, 2; MgCl2, 1; glucose, 0–10; sucrose, 20–10; NaHCO3 24; at pH ∼7.4 maintained by bubbling with 5% CO2. In all experiments where glucose concentration was reduced from the standard value of 10 mm, osmolarity was maintained by equimolar substitution with sucrose (standard value of 10 mm). The PO2 of the extracellular solution was lowered by bubbling N2 with the aid of an O2–CO2 mixing pump as previously described (Zhang et al. 2000), and titration of the glucose concentration and PO2 to desired levels was achieved by mixing solutions of different compositions, prior to application by rapid perfusion. Thus, mixing 3 parts of a glucose-free/5 mmHg PO2 solution with 6 parts of a 5 mm glucose/140 mmHg (normoxic) PO2 solution yielded a final solution containing 3.3 mm glucose at approximately arterial PO2 of ∼90 mmHg. Similarly, mixing 3 parts of a 4 or 5 mm glucose/5 mmHg PO2 solution with 6 parts of a 4 or 5 mm glucose/140 mmHg PO2 solution yielded one with 4 or 5 mm glucose/90 mmHg PO2. To produce isohydric hypercapnia, the bicarbonate concentration was increased to 48 mm (equimolar substitution for NaCl) and the solution was bubbled with 10% CO2. Pipette solutions for nystatin perforated-patch, whole-cell recording contained (mm): potassium glutamate or gluconate, 115; KCl, 25; NaCl, 5; CaCl2, 1; Hepes, 10; and nystatin 300 μg ml−1, at pH 7.2. All solutions were filtered through a 0.45 μm Millipore filter before use. During recordings the culture was continuously perfused under gravity flow and removal of excess fluid by suction ensured that the fluid level in the recording chamber remained relatively constant.
The 5-HT2A receptor blockers ketanserin and ritanserin were obtained from Research Biochemicals Inc. (RBI; Natick, MA, USA). Both were dissolved in DMSO (10 mm stock) and diluted to the desired final concentration in physiological solution. In control experiments the vehicle alone had no effect on membrane potential. The GABAB receptor blocker CGP 55845 was obtained from Tocris Cookson. The purinergic blockers suramin and pyridoxalphosphate-6-azophenyl-2′,4′-disulphonic acid (PPADS) were obtained from Sigma-Aldrich (Oakville, ON, Canada). All blockers were applied by bath perfusion under gravity as previously described (Fearon et al. 2003; Zhang et al. 2003).
Nystatin perforated-patch whole-cell recording
Nystatin perforated-patch, whole-cell recording was routinely used in this study according to procedures described in detail elsewhere (Zhong et al. 1997, 1999; Zhang et al. 2000). In most experiments ∼75% of the series resistance was compensated, and junction potentials (3–5 mV) were cancelled at the beginning of the experiment. The ECF was warmed before entering the recording chamber, where the mean temperature was 34 ± 2°C over the time course of the experiments. Membrane potential was recorded with the aid of an Axopatch 1D or a dual headstage MultiClamp 700B patch clamp amplifier and a Digidata 1200 or 1322A analog-to-digital converter (Axon Instruments Inc., Union City, CA, USA), and stored on a personal computer. Data acquisition and analysis were performed using pCLAMP software (versions 6.0.2 and 9.0; Axon Instruments). Results are represented in the text as mean ± standard error of the mean (s.e.m.). Electrophysiological data were analysed using one-way ANOVA with level of significance set at P < 0.05.
Chemiluminescence detection of ATP secretion from fresh carotid body slices
Methods for detecting extracellular ATP using the luciferin–luciferase chemiluminescence assay were similar to those described elsewhere (Buttigieg & Nurse, 2004), with a few modifications. Whole carotid bodies (CBs) were dissected and placed in ice-cold F-12 medium that was equilibrated with a 95% O2–5% CO2 gas mixture at pH 7.4. After removal of excess tissue the CB was briefly stained with neutral red (20 μg ml−1) for 10 min to aid viewing. CBs were mounted in a 25% gelatin bed and ∼120 μm thick sections were cut from the more central region using a tissue vibroslicer (Leica; model VT 1000E). Sections were kept in F-12 medium that was continuously bubbled with 95% O2–5% CO2 for 30–60 min before use in release experiments. For each experiment, three CB sections were transferred to a single well of a modified 24-well dish before ATP release measurements were obtained (see Buttigieg & Nurse, 2004). Prior to ATP release measurements the F-12 medium was removed and replaced with 800 μl of standard extracellular solution (ECS) containing (mm): NaCl, 135; KCl, 5; CaCl2, 2; MgCl2, 2; glucose, 10; and Hepes, 10, at pH 7.4. Following the addition of 200 μl luciferin–luciferase solution (ATP determination kit; Molecular probes no. A22066), the dish was placed in a Labsystem Luminoskan luminometer connected to a Pentium IV computer. Readings of luminescence (relative light units or RLU) were collected, stored, and analysed using Labsystems Ascent Software (version 2.6). The luminometer was set to monitor luminescence signals at intervals of 4 s for a period of 3 min. All release measurements were obtained at ∼30°C. The ECS was made hypoxic where indicated by bubbling N2 gas and the PO2 was monitored using a World Precision Instruments Dissolved O2 reader (WPI ISO2-A). When low glucose (0.1–4 mm) was used as a stimulus, osmolarity was maintained by equimolar substitution with sucrose. During application of ‘physiological’ hypoglycaemia (4 mm glucose at arterial PO2), the PO2 was lowered to values near arterial blood (∼90 mmHg). Though a typical experiment lasted 3 min, direct measurements of PO2 in the well over an 8 min time interval indicated an acceptable PO2 drift over the range 85–95 mmHg. At the end of each experiment, the total ATP content of the slices was estimated after lysis following substitution of the ECS with 3% trichloroacetic acid (800 μl) and luciferin–luciferase solution (200 μl). For each dish a standard curve of known ATP concentration versus RLU reading was performed. RLU measurements obtained in experiments on that dish were then converted to a concentration ratio of extracellular ATP versus total ATP content.
Results
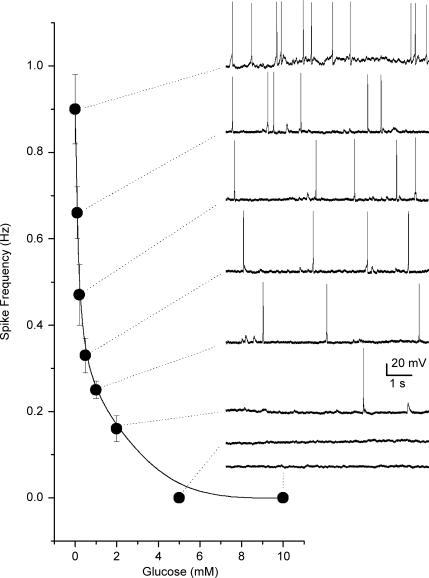
In the majority of experiments petrosal neurones (PNs) situated close to type I clusters were selected for electrophysiological recording and the coculture was first exposed to an acute hypoxic stimulus (PO2 ≈ 5 mmHg) to identify functional chemosensory units. In successful cases, i.e. ones in which hypoxia caused membrane depolarization and/or increased spike discharge in the adjacent PN, extracellular glucose (10 mm initially) was reduced by equimolar sucrose substitution during continuous recording from the neurone in varying PO2 backgrounds. All units that responded to hypoxia were also responsive to low glucose (n = 69). Figure 1 shows a dose–response relationship of spike discharge frequency versus glucose concentration under normoxic conditions (PO2 ≈ 140 mmHg), for a cocultured PN that initially responded to hypoxia (not shown). For comparison, the mean hypoxia-induced (PO2 ≈ 5 mmHg) discharge frequency for this PN was 1.06 ± 0.12 Hz based on the average of three 10 s recording segments. Consistent with previous studies on the relation between amine secretion from type I cells and glucose concentration as measured in thin carotid body slices (Pardal & Lopez-Barneo, 2002), at a PO2 of ∼140 mmHg the sensory neuronal response in coculture increased only slowly as the glucose concentration was lowered from 10 to 2 mm, but increased steeply between 2 and 0 mm (Fig. 1).
Figure 1.
Dose–response curve showing relation between glucose concentration and sensory discharge from a cocultured petrosal neurone This neurone formed a functional chemosensory unit with an adjacent type I cell cluster as indicated by an increase in spike discharge during hypoxia (not shown). Spike discharge also increased in a dose-dependent manner following a decrease in glucose concentration as illustrated in the diagram. Data points represent mean (± s.e.m.) spike frequency estimated from 3 to 4 10 s recording segments at each glucose concentration. Sample traces of spike discharge are illustrated on the right for the corresponding glucose concentration; resting potential was ∼–58 mV. Recordings were obtained in bicarbonate/5% CO2-buffered medium at normoxic PO2 (140 mmHg).
Sensory transmission in coculture during physiological hypoglycaemia
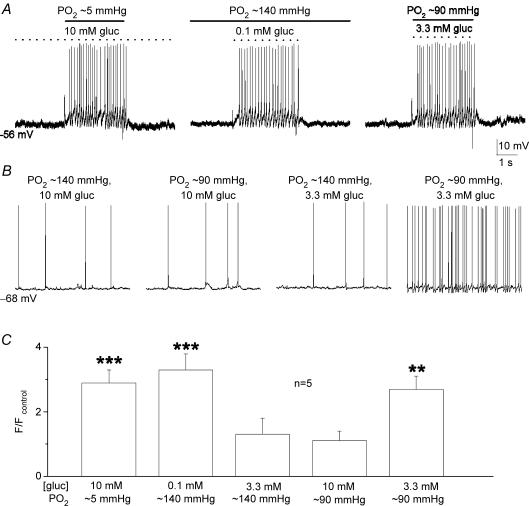
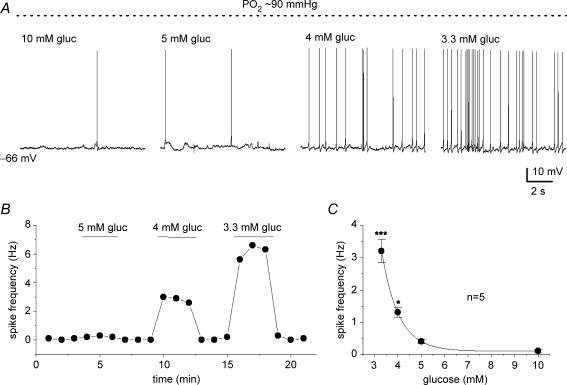
In a normoxic (PO2 ≈ 140 mmHg) background, glucose concentration had to be lowered to ‘unphysiological’ low levels (< 2 mm) to trigger robust increases in PN sensory discharge (see Fig. 1). Since an interaction between PO2 and low glucose has been previously demonstrated at the level of the secretory output from type I cells (Pardal & Lopez-Barneo, 2002; Lopez-Barneo, 2003), we investigated whether adjusting the background PO2 to a level near that of arterial blood (i.e. ∼90 mmHg) would result in robust PN responses to ‘physiological’ hypoglycaemia (3–4 mm glucose). This was indeed the case as illustrated in Fig. 2A, where chemoexcitatory responses were evoked in the same cocultured PN during sequential application of three stimuli, i.e. standard glucose/hypoxia (10 mm gluc; PO2 ≈ 5 mmHg), low glucose/normoxia (0.1 mm gluc; PO2 ≈ 140 mmHg), and low glucose/arterial PO2 or ‘physiological’ hypoglycaemia (3.3 mm gluc; PO2 ≈ 90 mmHg). A comparison of the chemosensory discharge frequency relative to control (10 mm gluc; PO2 ≈ 140 mmHg) for a group of five cocultured PNs exposed to various glucose concentrations in different PO2 backgrounds is shown in Fig. 2C. It is noteworthy that lowering PO2 from 140 to 90 mmHg in the presence of 10 mm glucose (control) had no detectable effect on PN spike discharge, though lowering glucose from 10 to 3.3 mm at near-arterial PO2 (∼90 mmHg) levels produced an ∼2.5× increase in discharge frequency (see Fig. 2B and C). Membrane potential recordings and a time series plot of PN afferent spike frequency versus glucose concentration are shown for a single chemosensory unit in Fig. 3A and B, at a background PO2 of ∼90 mmHg. The dose–response relation for PN discharge frequency versus glucose concentration for a group of five comparable chemosensory units under similar conditions (PO2 ≈ 90 mmHg) is shown in Fig. 3C. These data indicate that the chemosensory discharge in cocultured PNs increases steeply over the physiological hypoglycaemic range (3–4 mm glucose) when background PO2 is near that of arterial blood. In addition, hyperglycaemic stimuli (> 5 mm glucose) produce little or no change in PN discharge frequency.
Figure 2.
Low-glucose induced chemoexcitatory responses in cocultured petrosal neurones under differentPO2backgrounds A, current clamp recordings were obtained from the same neurone (adjacent to a type I cell cluster) during perfusion of the culture with solutions containing standard glucose/hypoxia (10 mm gluc; ∼5 mmHg) on left, low glucose/normoxia (0.1 mm gluc; ∼140 mmHg) in the middle, and low glucose/‘arterial’PO2 (3.3 mm gluc; ∼90 mmHg) or ‘physiological hypoglycaemia’ on the right. Recordings from a different neurone in B show sample traces of spike discharge at different PO2 and glucose concentrations. Note that lowering glucose concentration to within the physiological hypoglycaemic range of 3.3 mm had little effect on sensory discharge at normoxic PO2 (140 mmHg), but produced robust chemoexcitation at an ‘arterial’PO2 of ∼90 mmHg (cf. two right traces). Also, lowering PO2 from 140 to 90 mmHg at standard (high) glucose levels had negligible effect on sensory discharge (cf. two left traces). C, summary of relative changes in spike frequency (F) induced by the different stimuli as indicated, for groups of cocultured neurones (n = 5); spike frequency ratio F/Fcontrol is plotted on the ordinate, where Fcontrol refers to spike frequency recorded in 10 mm glucose at normoxic (140 mmHg) PO2 (e.g. left trace in B); significant differences indicated by **P < 0.01 and ***P < 0.001.
Figure 3.
Physiological hypoglycaemia causes a dose-dependent increase in sensory discharge in cocultured petrosal neurones When background PO2 was adjusted to near-arterial levels (∼90 mmHg), lowering glucose concentration to 4 and 3.3 mm (i.e. within the physiological hypoglycaemic range) caused a progressive increase in spike frequency in the same neurone, as shown in sample traces (A) and the time series plot (B). Dose–response relation between PN spike frequency discharge versus glucose concentration at a background PO2 of ∼90 mmHg is shown for a group of 5 cocultured neurones in C; significant differences relative to 10 mm glucose are indicated by *P < 0.05 and ***P < 0.001.
Combined effects of hypoglycaemia with hypoxia or hypercapnia on sensory discharge in coculture
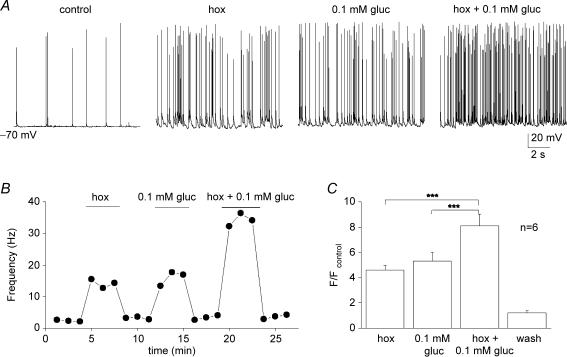
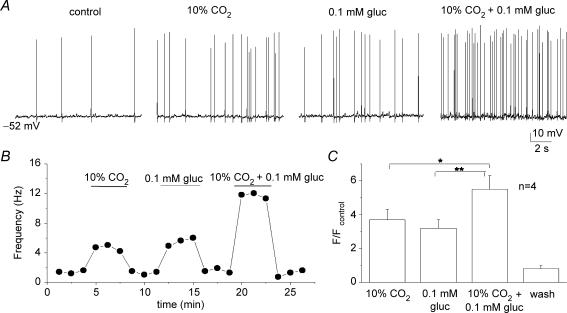
Hypoxia and low glucose evoke additive secretory responses from type I cells when applied to tissue slices of rat carotid body (Pardal & Lopez-Barneo, 2002; Lopez-Barneo, 2003). This, together with the observation that the hypoglycaemia-induced receptor potential in type I cells appears to be mediated by a separate pathway from hypoxia (see later), suggested that combined application of hypoglycaemia and hypoxia should produce additive responses. Indeed, as illustrated in Fig. 4A and B, the PN sensory discharge evoked by combined application of severe hypoxia (PO2 ≈ 5 mmHg) and low glucose (0.1 mm) was additive at the same chemosensory unit. Data from six similar experiments are summarized in Fig. 4C, illustrating that the relative increase in spike discharge due to the combined stimuli was significantly higher than that due to either stimulus alone. Similarly, as summarized in Fig. 5A–C, the interactions between low glucose and isohydric hypercapnia (10% CO2; pH 7.4) were additive during recordings of sensory discharge from similar cocultured PN.
Figure 4.
Interaction between low glucose and hypoxia on sensory discharge A, sample traces showing effects of hypoxia (hox; PO2 ≈ 5 mmHg), 0.1 glucose (PO2 ≈ 140 mmHg), and hypoxia plus 0.1 mm glucose, on chemosensory discharge recorded in a cocultured neurone. Corresponding time series plot of discharge frequency is shown for the same neurone in B. Note additive interaction between hypoxia and low glucose in B, and for a group of 6 similar cocultured neurones in C. Data in C are plotted as spike frequency (F) ratio relative to control (Fcontrol), where Fcontrol is frequency recorded in 10 mm glucose/PO2 ≈ 140 mmHg; significant differences indicated by ***P < 0.001.
Figure 5.
Interaction between low glucose and isohydric hypercapnia on sensory discharge A, sample traces showing effects of isohydric hypercapnia (10% CO2; pH 7.4; 10 mm glucose), low glucose in normocapnia (5% CO2; pH 7.4; 0.1 mm glucose), and isohydric hypercapia plus low glucose, on chemosensory discharge recorded in a cocultured neurone. Corresponding time series plot of discharge frequency is shown for the same neurone in B. Note additive interaction between isohydric hypercapnia and low glucose in B, and for a group of 4 cocultured neurones in C. Data in C are plotted as spike frequency (F) ratio relative to control (Fcontrol), where Fcontrol is frequency recorded in 10 mm glucose/5% CO2(PO2 ≈ 140 mmHg); significant differences indicated by *P < 0.05 and **P < 0.01.
It is noteworthy that multiplicative, i.e. more than additive, interactions between hypoxia and hypercapnia have previously been demonstrated at the level of intracellular Ca2+ levels in isolated single type I cells (Dasso et al. 2000), and in a few cases, at the level of PN sensory discharge in similar cocultures (Prasad et al. 2001). Whether such multiplicative interactions can be demonstrated between hypoglycaemia and hypoxia (or hypercapnia) in these cocultures requires further investigation at different PO2 levels.
Role of ATP and ACh in hypoglycaemia-induced sensory transmission
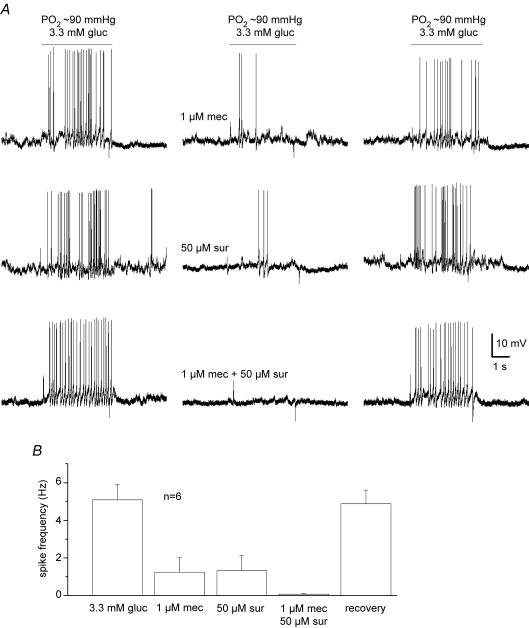
Co-release of the neurotransmitters ATP and ACh is the principal mechanism mediating the chemoexcitatory effects of hypoxia and hypercapnia in the rat carotid body (Zhang et al. 2000; Prasad et al. 2001; Zhang & Nurse, 2004; He et al. 2005). We therefore tested whether these same transmitters were involved in the responses to low glucose. In recordings of membrane potential from cocultured PNs, a combination of purinergic (suramin, 50 μm, n = 6; or PPADS, 10 μm, n = 4) and nicotinic (mecamylamine, 1 μm) receptor blockers was sufficient to block the chemosensory spike discharge induced by physiological hypoglycaemia (3.3 mm glucose; PO2 ≈ 90 mmHg). An example illustrating partial blockade of the spike discharge by each blocker, and complete blockade when both blockers are present together, is shown for a cocultured PN exposed to physiological hypoglycaemia in Fig. 6A; combined data for a group of six different cells treated in a similar way are summarized in Fig. 6B. A similar blockade of chemosensory discharged was obtained from cocultured PNs exposed to 0.1 mm glucose in normoxia during perfusion with solutions containing 50 μm suramin plus 1 μm mecamylamine (n = 6). Thus, the chemoexcitatory effects of low glucose appear to be mediated mainly by corelease of ATP and ACh from type I cells, as previously demonstrated for hypoxia and hypercapnia (Zhang et al. 2000; Prasad et al. 2001; Zhang & Nurse, 2004; He et al. 2005).
Figure 6.
Effects of nicotinic and purinergic receptor blockers on sensory discharge evoked by physiological hypoglycaemia in cocultures A, sample traces showing partial inhibition of sensory discharge induced by 3.3 mm glucose (PO2 ≈ 90 mmHg) in a cocultured petrosal neurone during exposure to the nicotinic blocker, mecamylamine (1 μm mec; upper traces) and the purinergic blocker, suramin (50 μm sur; middle traces). Note complete inhibition of sensory discharge by combined application of mecamylamine and suramin. Mean (± s.e.m.) spike frequency data for a group of 6 similar cocultured neurones before, during, and after application of the indicated receptor blockers are summarized in B.
Opposite modulation of hypoglycaemia-induced chemosensory responses by 5-HT2 and GABAB receptor blockers
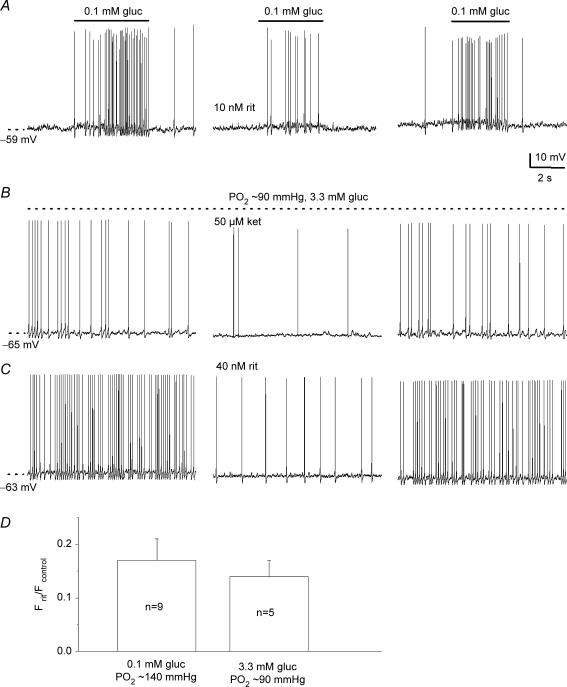
Our previous studies on similar cocultures indicated that 5-HT and GABA acted as positive and negative modulators, respectively, of hypoxic chemotransmission in the rat carotid body. These effects were mediated presynaptically by the autocrine/paracrine actions of these transmitters on 5-HT2A and GABAB receptors expressed by type I cells (Fearon et al. 2003; Zhang et al. 2003). To determine whether or not these pathways are also active during hypoglycaemia, we tested the effects of 5-HT2 and GABAB receptor blockers on the afferent response in coculture. As exemplified in Fig. 7A–C, the sensory PN discharge induced by 0.1 mm glucose in normoxia (Fig. 7A) or physiological hypoglycaemia (3.3 mm glucose/PO2 ≈ 90 mmHg;Fig. 7B and C) was reversibly suppressed by the 5-HT2A receptor blockers, ritanserin (10–40 nm) or ketanserin (50 μm). The reduction in hypoglycaemia-induced spike discharge by ritanserin is expressed as a ratio relative to control (i.e. discharge before drug application) for two groups of cocultured neurones exposed to 0.1 and 3.3 mm glucose in Fig. 7D.
Figure 7.
Blockers of 5-HT2a receptors inhibit sensory discharge induced by low glucose in cocultured neurones A, sample traces showing reversible inhibition of low glucose-induced (0.1 mm gluc/PO2 ≈ 140 mmHg) sensory discharge by 10 nm ritanserin. Similar results were obtained during application of ‘physiological hypoglycaemia’ (3.3 mm gluc/PO2 ≈ 90 mmHg) in the presence of 50 μm ketanserin (ket; B) and 40 nm ritanserin (rit; C). Effects of ritanserin on low glucose-induced spike frequency (F) discharge are plotted as a ratio Frit/Fcontrol for groups of cocultured petrosal neurones as indicated in the bar graph (D); Fcontrol and Frit refer to the spike frequency before and during ritanserin, respectively. Note ratio is < 1, due to inhibition of the discharge by ritanserin.
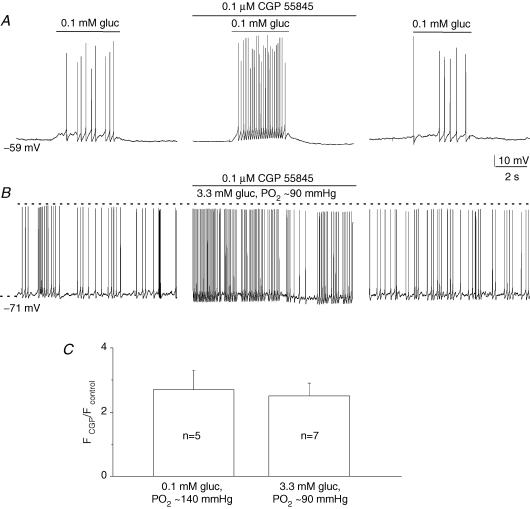
In contrast to 5-HT2 receptor blockers, the specific GABAB receptor blocker, CGP 55845 (0.1 μm), caused a marked potentiation of the hypoglycaemic response due to 0.1 mm glucose (Fig. 8A; PO2 ≈ 140 mmHg) and 3.3 mm glucose (Fig. 8B; PO2 ≈ 90 mmHg). A comparison of the relative increase (∼2.5×) in sensory discharge frequency due to CGP 55845 is shown in Fig. 8C, for groups of cocultured neurones exposed to the two hypoglycaemic stimuli. These data indicate that endogenous release of 5-HT and GABA during hypoglycaemia can oppositely regulate the afferent discharge in cocultured neurones.
Figure 8.
Blockers of GABAB receptors potentiate sensory discharge induced by low glucose in cocultured neurones A, sample traces showing reversible potentiation of low glucose-induced (0.1 mm gluc/PO2 ≈ 140 mmHg) sensory discharge by 0.1 μm CGP 55845, a GABAB receptor blocker. A similar potentiation was obtained during application of ‘physiological hypoglycaemia’ (3.3 mm gluc/PO2 ≈ 90 mmHg) as exemplified in B. Effects of CGP 55845 on low glucose-induced spike frequency (F) discharge are plotted as a ratio FCGP/Fcontrol for groups of cocultured petrosal neurones as indicated in the bar graph (C); Fcontrol and FCGP refer to the spike frequency before and during CGP 55845, respectively. Note ratio is > 1, due to potentiation of the discharge by CGP 55845.
Hypoglycaemia-induced receptor potential in type I cells: simultaneous pre- and postsynaptic recordings in coculture
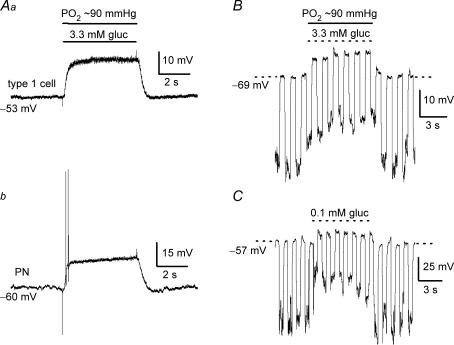
The data described above support a model where hypoglycaemia is sensed by CB receptor (type I) cells, leading to membrane depolarization, entry of Ca2+ through voltage-gated Ca2+ channels, and secretion of the neurotransmitters ATP and ACh onto petrosal terminals. We next tested key aspects of this model in coculture by recording simultaneously from a type I cell within the cluster and an adjacent PN while the stimulus was applied by rapid perfusion. As exemplified in Fig. 9 (n = 7), physiological hypoglycaemia (3.3 mm) caused a depolarizing receptor potential in a type I cell within a cell cluster (Fig. 9Aa), and this response was associated with a depolarization and increased excitability of the adjacent PN (Fig. 9Ab). This hypoglycaemia-induced receptor potential was accompanied by a decrease in type I cell input resistance or Rin (Fig. 9B), suggesting opening of cation channels. For a background PO2 of ∼90 mmHg, the mean (± s.e.m.) Rin in 14 responsive type I cells within clusters (from cocultures and CB cultures without neurones) was 1.45 ± 0.12 GΩ before, 0.81 ± 0.07 GΩ during (difference significant; P < 0.05), and 1.32 ± 0.13 GΩ after (wash) low glucose (3.3 mm). For reasons that are presently unclear, in some cases (n = 5) type I cells that initially responded to hypoxia failed to respond to hypoglycaemia during current clamp recordings, suggesting these cells may have different sensitivities to low glucose. The decrease in Rin seen in clustered type I cells during hypoglycaemia did not appear to be due to secondary effects occurring within the cluster (e.g. autocrine/paracrine interactions or changes in gap junctional coupling), since it could also be demonstrated in single type I cells. For example, as illustrated in Fig. 9C, low glucose (0.1 mm) induced a depolarizing receptor potential associated with a decrease in Rin in a single, hypoxia-sensitive (not shown) type I cell examined within 24 h of isolation. For a group of 13 similarly treated single type I cells, the membrane potential depolarized from a mean resting level of −50.3 ± 3.0 mV to −41.4 ± 2.7 mV during low glucose, corresponding to a mean depolarization of 8.9 ± 1.9 mV. For these cells, Rin decreased from a control value of 1.07 ± 0.18 GΩ to 0.64 ± 0.12 GΩ in low (0.1 mm) glucose (n = 13; P < 0.05). The ionic mechanism underlying the hypoglycaemia-induced decrease in type I cell Rin is beyond the scope of the present study, but it is noteworthy that it appears to differ from that responsible for the hypoxia-induced receptor potential, which is accompanied by an increase in type I cell Rin due to closing of background K+ channels (Buckler, 1997; Peers, 1997; Zhong et al. 1997).
Figure 9.
Low glucose-induced receptor potential in type I cells and simultaneous recordings of presynaptic and postsynaptic chemoexcitatory responses in coculture Presynaptic depolarization or ‘receptor potential’ in a type I cell (Aa) and postsynaptic depolarization (and brief spike activity) in juxtaposed petrosal neurone (Ab) are shown during simultaneous paired recordings, before, during (horizontal bars) and after exposure of the coculture to physiological hypoglycaemia (3.3 mm glucose/PO2 ≈ 90 mmHg). The receptor potential was associated with a decrease in input resistance, as indicated by injecting constant hyperpolarizing current pulses (downward deflections), during application of 3.3 mm glucose (PO2 ≈ 90 mmHg) to a clustered type I cell (B) or 0.1 mm glucose (PO2 ≈ 140 mmHg) to a single type I cell ∼24 h after isolation (c).
Regulation of hypoglycaemia-induced ATP secretion from fresh tissue slices of rat carotid body
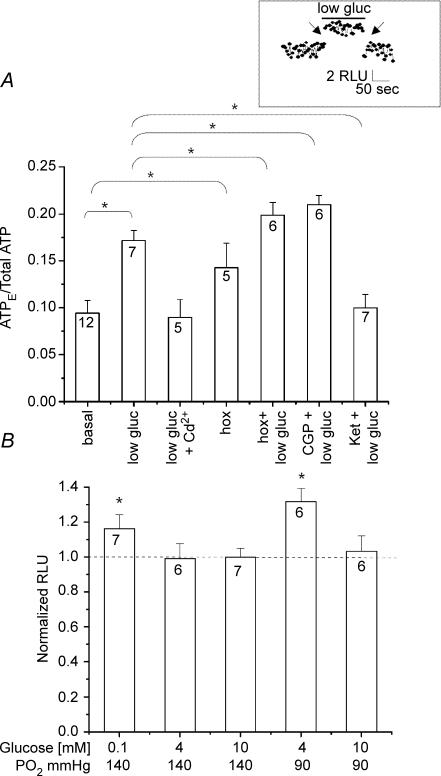
We previously demonstrated hypoxia-evoked ATP secretion from fresh rat CB slices using the luciferin–luciferase assay (Buttigieg & Nurse, 2004), in support of its role as an important sensory neurotransmitter in CB function. To confirm that our proposal of ATP as a key neurotransmitter during hypoglycaemia (this study) was not biased by the artificial coculture conditions, we used a similar assay to monitor ATP secretion from fresh CB tissue slices. As illustrated in Fig. 10A, the ‘fractional release’ of ATP, expressed as a ratio of extracellular ATP/total slice ATP, was significantly enhanced by ‘physiological’ hypoglycaemia (4 mm glucose; PO2 ≈ 90 mmHg). Data on the normalized hypoglycaemia-induced ATP release relative to control (10 mm glucose/PO2 ≈ 140 mmHg) under different PO2 conditions are summarized in Fig. 10B, and corroborate the interaction between glucose levels and PO2. Release of ATP by low glucose was unlikely to be the result of a non-specific effect, or an injury response arising from the use of tissue slices, since it was reversibly abolished by blockers of Ca2+ entry, e.g. cadmium (50 μm; Fig. 10A). Moreover, with respect to ATP secretion, the low glucose stimulus interacted additively with hypoxia (PO2 ≈ 15 mmHg) in tissue slices (Fig. 10A), in concert with our observations on petrosal sensory discharge in coculture (see Fig. 4). Additionally, the hypoglycaemia-induced secretion of ATP in slices was modulated by 5-HT2A and GABAB receptor blockers, as expected from the effects of these blockers on the sensory discharge in coculture (see Figs 7 and 8). Thus, the 5-HT2A receptor blocker ketaserin (50 μm) significantly inhibited the hypoglycaemia-induced ATP secretion, whereas the GABAB receptor blocker CGP 55845 (100 nm) caused a slight potentiation of ATP secretion (Fig. 10A; P < 0.05). Taken together, these data further support the coculture preparation as an attractive model for studying the effects of hypoglycaemia on CB function.
Figure 10.
Hypoglycaemia-evoked ATP release from fresh carotid body (CB) slices A, ATP release from CB slices, during exposure to a background PO2 of 85–90 mmHg, was monitored using the luciferin–luciferase assay and expressed as a ratio of extracellular ATP (ATPE) versus total ATP content. Note low glucose (4 mm) stimulated ATP release that was inhibited by the general Ca2+ channel blocker cadmium (Cd2+; 50 μm). Also, hypoxia (PO2 ≈ 15 mmHg) stimulated ATP release, and its effect was additive with that of low glucose. Application of the GABAB receptor antagonist CGP 55845 (CGP; 0.1 μm) enhanced hypoglycaemia-evoked ATP release, whereas the 5-HT receptor antagonist ketanserin (ket; 50 μm) inhibited this response. Neither CGP 55845 nor ketanserin caused significant changes in ATPE when added alone (not shown). Connecting lines indicate statistically significant differences using the Mann–Whitney one-tailed test (*P < 0.05). Sample size ‘n’ is indicated in each bar. Inset shows sample trace of real time recording before, during and after application of low glucose; a 1 min break (arrow) occurred when solutions were changed. B, normalized ATP secretion from CB slices at different PO2 and various glucose concentrations as indicated (bottom). The chemiluminescence signal (relative light units or RLU) due to low glucose-induced ATP release was normalized to basal ATP levels and expressed as a ratio on the ordinate. Hypoglycaemia under normoxic conditions (0.1 mm, PO2 ≈ 140 mmHg) caused a significant increase in extracellular ATP. A robust response was also observed when CB slices were exposed to physiological hypoglycaemia at PO2 near that of arterial blood (4 mm glucose/PO2 ≈ 90 mmHg). Note that exposure of CB slices to 4 mm glucose under normoxia (PO2 ≈ 140 mmHg) did not stimulate ATP release. Sample size ‘n’ is indicated in each bar. Statistical analysis was performed using the Mann–Whitney test. *Indicates significantly (P < 0.05) different from control.
Discussion
In this study we investigated neurotransmitter mechanisms underlying the processing of hypoglycaemic stimuli by the rat carotid body (CB) using a coculture model of isolated chemoreceptor (type I cell) clusters and afferent petrosal neurons, as well as fresh CB tissue slice preparations. Our results support the model where low glucose acts as a direct stimulus for type I cells, leading to a depolarizing receptor potential and Ca2+-dependent release of several neuroactive agents including the excitatory neurotransmitters ATP and ACh. These neurotransmitters, in turn, are proposed to activate postsynaptic P2X and nicotinic ACh receptors leading to an increased afferent discharge and activation of counter-regulatory autonomic pathways. We also provided evidence that hypoglycaemia activates autocrine/paracrine neuromodulatory pathways in the CB, involving release of 5-HT and GABA, which, respectively, facilitate and inhibit neurotransmitter output via presynaptic 5-HT2A and GABAB receptors. Additionally, at the level of the afferent response in coculture, the effects of hypoglycaemia were additive with those of hypoxia and hypercapnia. The latter two stimuli are known to produce more-than-additive or multiplicative interactions at the level of both the CB afferent discharge and receptor cells (see Dasso et al. 2000; Prasad et al. 2001); however, our experiments did not rigorously address whether or not such multiplicative interactions can occur between hypoglycaemia and hypoxia or hypercapnia. In this regard, it was recently reported that the hypermetabolism induced by hypoglycaemia in vivo could increase CO2 sensitivity of the rat CB measured using the steady state chemoafferent discharge, apparently via a glucose-insensitive mechanism (Bin-Jaliah et al. 2005).
While the principal findings were derived from experiments on the coculture model, confirmation of several key elements was obtained using fresh CB slices which circumvented potential artifacts generally associated with tissue culture, as could occur with the use of cultured CB slices (see Pardal & Lopez-Barneo, 2002). Thus, we successfully demonstrated that in fresh CB slices exposed to different PO2 backgrounds low glucose stimulated secretion of ATP, a key excitatory neurotransmitter in CB sensory transmission (Gourine, 2005; Nurse, 2005). Further, the effects of low glucose were additive with those of hypoxia, as expected if these two stimuli utilized separate transduction pathways. It might be argued that the presence of PO2 gradients within tissue slices, resulting in a fall in core PO2, precludes precise estimates of PO2 levels seen by the receptor cells in our study. Nevertheless, the fact that secretory responses were easily reversible when only glucose concentration was altered, at a constant bath PO2 of ∼140 mmHg, suggests we were measuring primarily hypoglycaemic rather than hypoxic responses per se under these conditions.
The sequence proposed here is similar in many respects to that previously elaborated for the processing of hypoxic stimuli by the CB (Zhang et al. 2000, 2003; Rong et al. 2003; Fearon et al. 2003; Iturriaga & Alcayaga, 2004; Nurse, 2005; He et al. 2005). A notable difference was that the receptor potential due to hypoglycaemia appeared to be associated with a decrease in type I cell input resistance (Rin). Because this was the case whether type I cells were present in clusters or singly isolated, the principal effect was likely to be due to a direct action of low glucose rather than to secondary effects involving interactions with neighbouring cells. This result is in contrast to the increase in Rin seen during hypoxia, and attributed to the closing of background or ‘leak’ K+ channels (Buckler, 1997; Peers, 1997; Zhong et al. 1997). Though low glucose has also been shown to inhibit voltage-activated outward K+ current in rat type I cells in CB tissue slices (Pardal & Lopez-Barneo, 2002) and in cell culture (our unpublished observations), this mechanism would be expected to increase, not decrease, Rin. The ionic mechanisms responsible for the decrease in type I cell Rin seen during hypoglycaemia are beyond the scope of the present study, but may involve activation of non-selective Na+-permeable cation channels (M. Garcia-Fernandez and J. Lopez-Barneo, unpublished observations). In this regard, non-selective cation channels of the transient receptor potential (TRPC) family have recently been localized in rat type I cells (Buniel et al. 2003). Interestingly, glucose excitation of hypothalamic ‘glucose-sensing’ neurons involves entry of glucose and closure of ATP-sensitive K+ channels (Routh, 2002). In contrast, it was recently reported that glucose inhibition of hypothalamic orexin neurons occurs via an extracellular site and involves activation of leak, tandem-pore domain K+ channels (Burdakov et al. 2006).
The present study adds further support to the notion that the CB acts as a peripheral glucosensor and, in addition to the pancreas, liver, and portal vein, contributes to the class of physiologically important glucosensors located outside the brain (Alvarez-Buylla & de Alvarez-Buylla, 1988; Hevener et al. 1997; Koyama et al. 2000; Lopez-Barneo, 2003). While central hypothalamic neurons are known to sense low glucose (Dunn-Meynell et al. 2002), their physiological significance is unclear (Routh, 2002). Given the strategic location of the CB at the bifurcation of the common carotid artery, its role as an important peripheral glucosensor, in addition to its more established one as an arterial PO2 and PCO2/pH sensor, has gained in prominence (Lopez-Barneo, 2003). In this regard a counter-regulatory interaction between PO2 and glucose utilization has previously been recognized, since a reduction in O2 supply results in a rapid increase in carbohydrate metabolism that is thought to be facilitated by increased hormonal (e.g. insulin, glucagon, cortisol, adrenaline) secretion (Zinker et al. 1994). Additionally, CB resection in conscious dogs leads not only to impaired counter-regulatory responses to insulin-induced hypoglycaemia, but also to reduced plasma noradrenaline and glucagon levels during the early phase of mild exercise (Koyama et al. 2000, 2001). These data indicate that inputs from the CB are critically involved in the maintenance of glucose homeostasis and in the mounting of appropriate physiological responses during exercise.
Evidence for carotid body type I cells as direct glucosensors
Since the pioneering studies of Alvarez-Buylla & de Alvarez-Buylla (1988), evidence has accumulated for an important role of the CB in peripheral glucosensing (see Lopez-Barneo, 2003). However, the question whether low glucose acts as a direct or indirect CB stimulus has sparked some controversy. For example, in thin rat CB tissue slices, cultured for 48–96 h, low glucose elicited Ca2+-dependent catecholamine secretion from type I cells, consistent with a direct action of low glucose on CB receptor cells (Pardal & Lopez-Barneo, 2002). Additionally, low glucose caused inhibition of outward K+ current in these cells, prompting the authors to propose a schema where the primary effect of low glucose was to cause K+ channel inhibition leading to membrane depolarization, voltage-gated Ca2+ entry, and transmitter release onto sensory nerve terminals, ultimately resulting in sympathoadrenal activation (Lopez-Barneo, 2003). On the other hand, in the isolated but intact rat CB–sinus nerve preparation in vitro, low glucose failed to stimulate sensory nerve discharge, though it did significantly increase spontaneous ventilation in adult rats in vivo, provided the sinus nerve was intact (Bin-Jaliah et al. 2004). These authors concluded that any potential role of the CB in glucose homeostasis in vivo was indirect, and attributable to its transduction of some other metabolically derived circulatory factor rather than glucose per se. In the present study, where functional chemosensory units of type I cell clusters and adjacent afferent (petrosal) neurones were reconstructed in coculture, low glucose induced a depolarizing receptor potential in type I cells and an afferent neuronal discharge. Since the effect was rapid (comparable to that seen during hypoxia) and occurred by simply changing the glucose concentration (sucrose substituted) in the physiological saline bathing the monolayer cultures, the simplest explanation is that the effect of low glucose is direct. The fact that the low glucose-induced petrosal response in coculture could be reversibly abolished by a combination of purinergic and nicotinic receptor blockers, and that the receptor potential could be generated in type I cells cultured alone, strongly supports a model where transmission of hypoglycaemic stimuli in the CB requires corelease of the neurotransmitters ATP and ACh from receptor type I cells onto afferent petrosal endings. Importantly, robust chemoexcitatory responses in cocultured neurones were elicited within the physiological hypoglycaemic range (3–4 mm glucose), provided that the background PO2 was near arterial levels of ∼90 mmHg. At higher normoxic PO2 (∼140 mmHg) levels, responses to physiological hypoglycaemia were greatly diminished or absent, though further lowering the glucose concentration (0–0.1 mm) did produce robust responses at the higher PO2. A similar interaction between PO2 and glucose concentration has previously been observed in studies of catecholamine secretion from type I cells in CB tissue slices (Pardal & Lopez-Barneo, 2002; Lopez-Barneo, 2003). In this regard, the background PO2 in the studies of Bin-Jaliah et al. (2004) on the isolated CB–sinus nerve preparation in vitro was hyperoxic (PO2 ≈ 400 mmHg), raising the question of whether or not this may have contributed to their failure to observe hypoglycaemic sinus nerve responses even at very low glucose concentrations (0–2 mm).
In summary, we propose that the effects of physiological hypoglycaemia in the CB are mediated via a direct action of low glucose on type I receptor cells. This action leads to a depolarizing receptor potential and release of the fast acting excitatory neurotransmitters ATP and ACh, which stimulate afferent sensory nerve endings and increased impulse activity in the CSN. As with hypoxia, low glucose also stimulates release of 5-HT and GABA which oppositely modulate type I cell function via a push-pull autocrine/paracrine mechanism, involving G-protein coupled 5-HT2A and GABAB receptors, respectively.
Acknowledgments
We thank Cathy Vollmer for expert technical assistance in preparing and maintaining the cocultures. This work was supported by a Canadian Institutes for Health Research grant (MOP 12037) to C.A.N. The dual headstage MultiClamp 700B patch clamp amplifier and Digidata 1322A analog-to-digital converter were purchased with a grant from the Canadian Foundation of Innovation. The Luminoskan luminometer was purchased with an equipment grant from the Heart and Stroke Foundation of Ontario to C.A.N. J.B. was supported by a Focus on Stroke doctoral research award.
References
- Alvarez-Buylla R, de Alvarez-Buylla ER. Carotid sinus receptors participate in glucose homeostasis. Respir Physiol. 1988;72:347–360. doi: 10.1016/0034-5687(88)90093-x. [DOI] [PubMed] [Google Scholar]
- Bin-Jaliah I, Maskell PD, Kumar P. Indirect sensing of insulin-induced hypoglycaemia by the carotid body in the rat. J Physiol. 2004;556:255–266. doi: 10.1113/jphysiol.2003.058321. [DOI] [PMC free article] [PubMed] [Google Scholar]
- Bin-Jaliah I, Maskell PD, Kumar P. Carbon dioxide sensitivity during hypoglycaemia-induced, elevated metabolism in the anaesthetized rat. J Physiol. 2005;563:883–893. doi: 10.1113/jphysiol.2004.080085. [DOI] [PMC free article] [PubMed] [Google Scholar]
- Buckler KJ. A novel oxygen-sensitive potassium current in rat carotid body type 1 cells. J Physiol. 1997;498:649–662. doi: 10.1113/jphysiol.1997.sp021890. [DOI] [PMC free article] [PubMed] [Google Scholar]
- Buniel MC, Schilling WP, Kunze DL. Distribution of transient receptor potential channels in the rat carotid chemosensory pathway. J Comp Neurol. 2003;464:404–413. doi: 10.1002/cne.10798. [DOI] [PubMed] [Google Scholar]
- Burdakov D, Jensen LT, Alexopoulos H, Williams RH, Fearon IM, O'Kelly I, Gerasimenko O, Fugger L, Verkhratsky A. Tandem-pore K+ channels mediate inhibition of orexin neurons by glucose. Neuron. 2006;50:711–722. doi: 10.1016/j.neuron.2006.04.032. [DOI] [PubMed] [Google Scholar]
- Buttigieg J, Nurse CA. Detection of hypoxia-evoked ATP release from chemoreceptor cells of the rat carotid body. Biochem Biophys Res Comm. 2004;322:82–87. doi: 10.1016/j.bbrc.2004.07.081. [DOI] [PubMed] [Google Scholar]
- Dasso LL, Buckler KJ, Vaughan-Jones RD. Interactions between hypoxia and hypercapnic acidosis on calcium signalling in carotid body type I cells. Am J Physiol Lung Cell Mol Physiol. 2000;279:L36–L42. doi: 10.1152/ajplung.2000.279.1.L36. [DOI] [PubMed] [Google Scholar]
- Dunn-Meynell AA, Routh VH, Kang L, Gaspers L, Levin BE. Glucokinase is the likely mediator of glucosensing in both glucose-excited and glucose-inhibited central neurons. Diabetes. 2002;51:2056–2065. doi: 10.2337/diabetes.51.7.2056. [DOI] [PubMed] [Google Scholar]
- Fearon IM, Zhang M, Vollmer C, Nurse CA. GABA mediates autoreceptor feedback inhibition in the rat carotid body via presynaptic GABAB receptors and TASK-1. J Physiol. 2003;553:83–94. doi: 10.1113/jphysiol.2003.048298. [DOI] [PMC free article] [PubMed] [Google Scholar]
- Gonzalez C, Almaraz L, Obeso A, Rigual R. Carotid body chemoreceptors: from nature stimuli to sensory discharges. Physiol Rev. 1994;74:829–898. doi: 10.1152/physrev.1994.74.4.829. [DOI] [PubMed] [Google Scholar]
- Gourine AV. On the peripheral and central chemoreception and control of breathing: an emerging role of ATP. J Physiol. 2005;568:715–724. doi: 10.1113/jphysiol.2005.095968. [DOI] [PMC free article] [PubMed] [Google Scholar]
- He L, Dinger B, Fidone S. Effect of chronic hypoxia on cholinergic chemotransmission in rat carotid body. J Appl Physiol. 2005;98:614–619. doi: 10.1152/japplphysiol.00714.2004. [DOI] [PubMed] [Google Scholar]
- Hevener AL, Bergman RN, Donovan CM. Novel glucosensor for hypoglycemic detection located in the portal vein. Diabetes. 1997;46:1521–1525. doi: 10.2337/diab.46.9.1521. [DOI] [PubMed] [Google Scholar]
- Iturriaga R, Alcayaga J. Neurotransmission in the carotid body: transmitters and modulators between glomus cells and petrosal ganglion nerve terminals. Brain Res Rev. 2004;47:46–53. doi: 10.1016/j.brainresrev.2004.05.007. [DOI] [PubMed] [Google Scholar]
- Koyama Y, Coker RH, Denny JC, Lacy DB, Jabbour K, Williams PE, Wasseman DH. Evidence that carotid bodies play an important role in glucoregulation in vivo. Diabetes. 2000;49:1434–1442. doi: 10.2337/diabetes.49.9.1434. [DOI] [PubMed] [Google Scholar]
- Koyama Y, Coker RH, Stone EE, Lacy DB, Jabbour K, Williams PE, Wasseman DH. Role of carotid bodies in control of the neuroendocrine response to exercise. Am J Physiol Endocrinol Metab. 2001;281:E742–E748. doi: 10.1152/ajpendo.2001.281.4.E742. [DOI] [PubMed] [Google Scholar]
- Lopez-Barneo J. Oxygen and glucose sensing by carotid body glomus cells. Curr Opin Neurobiol. 2003;13:494–499. doi: 10.1016/s0959-4388(03)00093-x. [DOI] [PubMed] [Google Scholar]
- Nurse CA. Neurotransmission and neuromodulation in the chemosensory carotid body. Autonom Neurosci. 2005;120:1–9. doi: 10.1016/j.autneu.2005.04.008. [DOI] [PubMed] [Google Scholar]
- Nurse CA, Zhang M. Acetylcholine contributes to hypoxic chemotransmission in co-cultures of rat type 1 cells and petrosal neurons. Respir Physiol. 1999;115:189–199. doi: 10.1016/s0034-5687(99)00017-1. [DOI] [PubMed] [Google Scholar]
- Pardal R, Lopez-Barneo J. Low glucose-sensing cells in the carotid body. Nat Neurosci. 2002;5:197–198. doi: 10.1038/nn812. [DOI] [PubMed] [Google Scholar]
- Peers C. Oxygen-sensitive ion channels. Trends Pharmacol Sci. 1997;18:405–408. doi: 10.1016/s0165-6147(97)01120-6. [DOI] [PubMed] [Google Scholar]
- Prasad M, Fearon IM, Zhang M, Laing M, Vollmer C, Nurse CA. Expression of P2X2 and P2X3 receptor subunits in rat carotid body afferent neurones: role in chemosensory signalling. J Physiol. 2001;537:667–677. doi: 10.1111/j.1469-7793.2001.00667.x. [DOI] [PMC free article] [PubMed] [Google Scholar]
- Rong W, Gourine AV, Cockayne DA, Xiang Z, Ford APDW, Spyer KM, Burnstock G. Pivotal role of nucleotide P2X2 receptor subunit of the ATP-gated ion channel mediating ventilatory responses to hypoxia. J Neurosci. 2003;23:11315–11321. doi: 10.1523/JNEUROSCI.23-36-11315.2003. [DOI] [PMC free article] [PubMed] [Google Scholar]
- Routh VH. Glucose-sensing neurons: are they physiologically relevant? Physiol Behav. 2002;76:403–413. doi: 10.1016/s0031-9384(02)00761-8. [DOI] [PubMed] [Google Scholar]
- Stea A, Nurse CA. Whole-cell and perforated-patch recordings from O2-sensitive rat carotid body cells grown in short- and long-term culture. Pflugers Arch. 1991;418:93–101. doi: 10.1007/BF00370457. [DOI] [PubMed] [Google Scholar]
- Stea A, Nurse CA. Whole cell currents in two subpopulations of cultured rat petrosal neurons with different tetrodotoxin sensitivities. Neurosci. 1992;17:727–736. doi: 10.1016/0306-4522(92)90180-a. [DOI] [PubMed] [Google Scholar]
- Zhang M, Fearon IM, Zhong H, Nurse CA. Presynaptic modulation of rat arterial chemoreceptor function by 5-HT: role of K+ channel inhibition via protein kinase C. J Physiol. 2003;551:825–842. doi: 10.1113/jphysiol.2002.038489. [DOI] [PMC free article] [PubMed] [Google Scholar]
- Zhang M, Nurse CA. Does endogenous 5-HT mediate spontaneous rhythmic activity in chemoreceptor clusters of rat carotid body? Brain Res. 2000;872:199–203. doi: 10.1016/s0006-8993(00)02499-9. [DOI] [PubMed] [Google Scholar]
- Zhang M, Nurse CA. CO2/pH chemosensory signalling in co-cultures of rat carotid body receptors and petrosal neurons: role of ATP and ACh. J Neurophysiol. 2004;92:3433–3445. doi: 10.1152/jn.01099.2003. [DOI] [PubMed] [Google Scholar]
- Zhang M, Zhong H, Vollmer C, Nurse CA. Co-release of ATP and ACh mediates hypoxic signalling at rat carotid body chemoreceptors. J Physiol. 2000;525:143–158. doi: 10.1111/j.1469-7793.2000.t01-1-00143.x. [DOI] [PMC free article] [PubMed] [Google Scholar]
- Zhong H, Zhang M, Nurse CA. Synapse formation and hypoxic signalling in co-cultures of rat petrosal neurones and carotid body type 1 cells. J Physiol. 1997;503:599–612. doi: 10.1111/j.1469-7793.1997.599bg.x. [DOI] [PMC free article] [PubMed] [Google Scholar]
- Zhong H, Zhang M, Nurse CA. Electrophysiological characterization of 5-HT receptors on petrosal neurons in dissociated cell culture. Brain Res. 1999;816:544–553. doi: 10.1016/s0006-8993(98)01232-3. [DOI] [PubMed] [Google Scholar]
- Zinker BA, Namdaran K, Wilson R, Lacy DB, Wasseman DH. Acute adaptation of carbohydrate metabolism to decreased arterial PO2. Am J Physiol Endocrinol Metab. 1994;266:E921–E929. doi: 10.1152/ajpendo.1994.266.6.E921. [DOI] [PubMed] [Google Scholar]


