

Abstract
Rationale and Objectives
Computer-aided diagnostic (CAD) systems fundamentally require the opinions of expert human observers to establish “truth” for algorithm development, training, and testing. The integrity of this “truth,” however, must be established before investigators commit to this “gold standard” as the basis for their research. The purpose of this study was to develop a quality assurance (QA) model as an integral component of the “truth” collection process concerning the location and spatial extent of lung nodules observed on computed tomography (CT) scans to be included in the Lung Image Database Consortium (LIDC) public database.
Materials and Methods
One hundred CT scans were interpreted by four radiologists through a two-phase process. For the first of these reads (the “blinded read phase”), radiologists independently identified and annotated lesions, assigning each to one of three categories: “nodule ≥ 3mm,” “nodule < 3mm,” or “non-nodule ≥ 3mm.” For the second read (the “unblinded read phase”), the same radiologists independently evaluated the same CT scans but with all of the annotations from the previously performed blinded reads presented; each radiologist could add marks, edit or delete their own marks, change the lesion category of their own marks, or leave their marks unchanged. The post-unblinded-read set of marks was grouped into discrete nodules and subjected to the QA process, which consisted of (1) identification of potential errors introduced during the complete image annotation process (such as two marks on what appears to be a single lesion or an incomplete nodule contour) and (2) correction of those errors. Seven categories of potential error were defined; any nodule with a mark that satisfied the criterion for one of these categories was referred to the radiologist who assigned that mark for either correction or confirmation that the mark was intentional.
Results
A total of 105 QA issues were identified across 45 (45.0%) of the 100 CT scans. Radiologist review resulted in modifications to 101 (96.2%) of these potential errors. Twenty-one lesions erroneously marked as lung nodules after the unblinded reads had this designation removed through the QA process.
Conclusion
The establishment of “truth” must incorporate a QA process to guarantee the integrity of the datasets that will provide the basis for the development, training, and testing of CAD systems.
Keywords: lung nodule, computed tomography (CT), thoracic imaging, database construction, computer-aided diagnosis (CAD), annnotation, quality assurance (QA)
INTRODUCTION
The Lung Image Database Consortium (LIDC) was established by the National Cancer Institute (NCI) through a peer review of applications submitted in response to its Request for Applications (RFA) in 2000 entitled “Lung Image Database Resource for Imaging Research.” Through this RFA, the NCI outlined the requirements for a well-characterized repository of computed tomography (CT) scans to stimulate the development of computer-aided diagnostic (CAD) methods by the thoracic imaging research community. The intent of this initiative was to create a consortium of institutions that would develop consensus guidelines for a standardized database of thoracic CT scans that would serve as a reference standard for CAD investigators (1). The mission of the LIDC is to develop the database as an “international research resource for the development, training, and evaluation of CAD methods for lung cancer detection and diagnosis” (2).
The distinction between the collection of images as a repository of clinical CT scans and the creation of a reference standard as a robust research resource has guided the efforts of the LIDC since its inception. The LIDC database has been designed to serve specifically as a reference standard. Accordingly, the CT scans that comprise the database are accompanied by associated “truth” information to more completely facilitate lung nodule CAD research (3). The creation of a reference database carries a burden of accuracy and completeness that demands a complex process; the multi-institutional nature of the LIDC effort further compounds the complexity of the task. This same complexity necessitates a systematic review of the collected “truth” information to identify and correct potential errors.
In the specific context of CAD systems for the CT-based detection of lung nodules, investigators require the initial establishment of “truth” for algorithm development, training, and testing and as the “gold standard” against which detection performance will be measured. This “truth” is generally provided by a panel of experienced thoracic radiologists who render their opinion regarding the location (and spatial extent, when required) of nodules (and other lesions) within the CT scans. Some version of a panel approach is considered standard given the variability that exists among radiologists in the detection of lung nodules (4–7), and some studies include the output from the CAD system itself into the “truth” assessment (8, 9).
A number of studies have investigated various paradigms for the collection of “truth” data (e.g., single observer, observer panel with forced consensus) (10, 11) and the manner in which incorporation of “truth” data for scoring impacts the performance assessment of CAD methods (e.g., percent overlap, Euclidean distance of centers) (12). The practical implementation of the process through which expert observers define “truth,” however, must be given proper consideration. Moreover, potential inconsistencies in the acquired “truth” data must be identified and corrected before investigators can rely on this data for performance assessments.
As part of its data collection for the creation of a public database of annotated CT scans of the lung, the LIDC created a detailed two-phase image annotation process involving four radiologists for each scan. Given the complexity of the information that was recorded during the four separate blinded reading sessions and then presented, re-interpreted, confirmed and modified, and re-recorded during the four separate unblinded reading sessions, the potential for inadvertent errors during this “truth” collection process could be substantial. Therefore, the purpose of this study was to develop a quality assurance (QA) model as an integral component of the “truth” collection process for lung nodules on CT scans and to determine the impact of the QA process on the collected “truth” data. This study is perhaps the first report of a systematic process to ensure the integrity, accuracy, and completeness of the “truth” data on which so much medical imaging research relies.
MATERIALS AND METHODS
“Truth” collection process
A two-phase process was established for the asynchronous interpretation of CT scans by a panel of four radiologists at different institutions as previously reported (13). In summary, the initial “blinded read phase” requires radiologists using a computer interface to independently mark lesions they identify in a thoracic CT scan as “nodule ≥ 3mm,” “nodule < 3mm,” or “non-nodule ≥ 3mm.” Monitors with clinically acceptable specifications are used at each site; each CT scan is initially presented at a standard brightness/contrast setting without magnification, but the radiologists are allowed to adjust brightness, contrast, and magnification as appropriate to enable the most complete interpretation of the scan. During the subsequent “unblinded read phase,” the blinded read results of all radiologists are revealed to each of the radiologists, who then independently review their marks along with the anonymous marks of their colleagues; a radiologist's own marks then could be left unchanged, deleted, switched in terms of lesion category, or additional marks could be added. This approach was developed to identify, as completely as possible, all nodules in a scan without requiring forced consensus.
For a lesion considered to be a “nodule ≥ 3mm,” the radiologist outlines the border of the nodule in all sections in which it appears. For a lesion considered to be a “nodule < 3mm,” the radiologist indicates an approximate center-of-mass location in three dimensions. For a lesion considered to be a “non-nodule ≥ 3mm,” the radiologist also indicates an approximate lesion center-of-mass location in three dimensions. Each radiologist’s marks (spatial locations of each point in the contours constructed for a “nodule ≥ 3mm” and center-of-mass locations for a “nodule < 3mm” and for a “non-nodule ≥ 3mm”) along with the designated lesion category for each lesion were stored in XML files (1) after the blinded read phase for review by the radiologists during the unblinded read phase and then (2) after the unblinded read phase as the final set of annotations (Figure 1).
Figure 1.
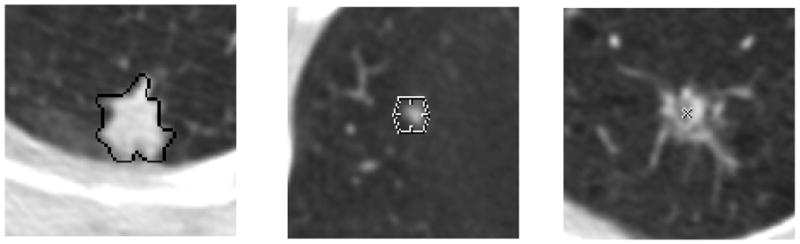
Annotations placed within the CT images during the “truth” process: (a) “nodule ≥ 3mm,” represented by the contour constructed by the radiologist, (b) “nodule < 3mm,” represented by the hexagon positioned at the center-of-mass location indicated by the radiologist, and (c) “non-nodule ≥ 3mm,” represented by the “x” positioned at the center-of-mass location indicated by the radiologist.
The blinded and unblinded read phases are intended to comprise a single, comprehensive process. Therefore, only the final set of post-unblinded-read-phase radiologist marks will be released as part of the LIDC database. Given the complexity of the information that needs to be recorded during the four separate blinded reading sessions and then presented, re-interpreted, confirmed and modified, and re-recorded during the four separate unblinded reading sessions (Figure 2), the potential for inadvertent errors during this “truth” collection process could be substantial. Considering the importance of the information provided in the database and the extent to which the scientific community will rely on this information, the final set of radiologist marks is subjected to a QA process (see Figure 2), as described below.
Figure 2.

A schematic representation of the two-phase image annotation process for the asynchronous interpretation of thoracic CT scans by four radiologists at different institutions. A CT scan is distributed to the four sites, and an experienced thoracic radiologist at each site identifies appropriate lesions through the blinded read phase, the annotations of which are recorded in XML files. A single XML file that merges the four sets of annotations from the blinded read phase is distributed to the same four radiologists to initiate the unblinded read phase, which involves a second review of the scan along with the blinded read phase results of all radiologists. The single XML file that then merges the four sets of annotations from the unblinded read phase provides the basis for the quality assurance process. (Reprinted with permission from reference (14).)
Quality assurance model
The QA process consisted of (1) the review and identification (by a single LIDC investigator) of potential errors that occurred during the two-phase image annotation process and (2) the verification/correction of these errors by the individual radiologist whose mark generated the potential error (14). The first task in the retrospective identification of potential errors was the grouping of individual marks into marks associated with discrete lesions. All marks placed by each of the four radiologists as recorded during the unblinded read phase were visually inspected by a single LIDC investigator. Only the “nodule ≥ 3mm” marks and the “nodule < 3mm” marks were considered, along with any “non-nodule ≥ 3mm” marks that overlapped a nodule mark. The assignment of marks to specific lesions provided the basis for the identification of potential errors.
Based on an evaluation of a pilot set of 30 CT scans that were subjected to the two-phase LIDC image annotation process, seven categories of potential error (the “QA categories”) were defined:
errant marks from any of the three lesion categories on non-pulmonary regions of the image or stray marks within the lungs that do not appear associated with any physical structure (Figure 3)
marks from multiple categories assigned to the same lesion by the same radiologist (Figure 4)
more than a single “nodule < 3 mm” mark or more than one set of “nodule ≥ 3 mm” contours assigned to the same lesion by a single radiologist (Figure 5)
“nodule ≥ 3 mm” contours for a single lesion that are recorded as more than one lesion across the sections
“nodule ≥ 3 mm” contours for a single lesion that are not contiguous across sections (e.g., a radiologist contours a “nodule ≥ 3 mm” on sections 21, 22, and 24 but not on section 23) or, in general, that fail to exhibit three-dimensional contiguity across what the radiologist interprets as a single, complex lesion
lesion marked as “nodule ≥ 3 mm” by 3 radiologists that was not assigned any mark at all by the fourth radiologist (Figure 6)
obvious inconsistency between the physical size of a lesion and the assignment of the “nodule < 3 mm” or “nodule ≥ 3 mm” categories
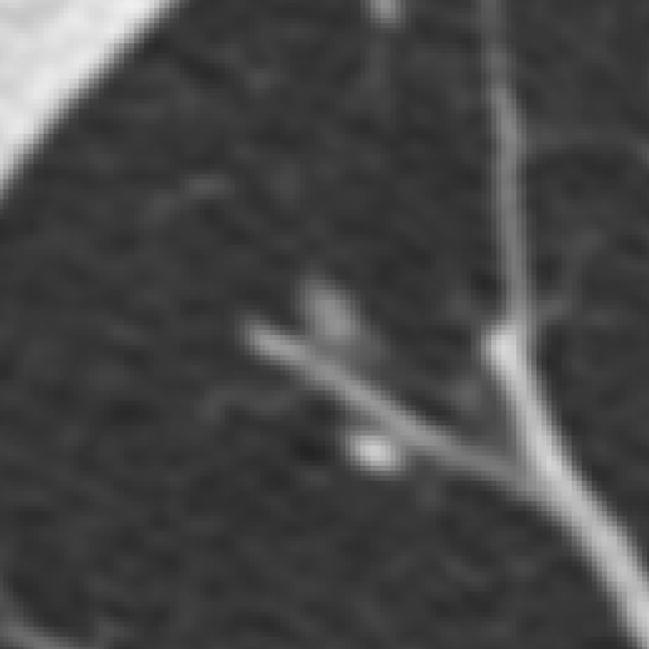
Figure 3.
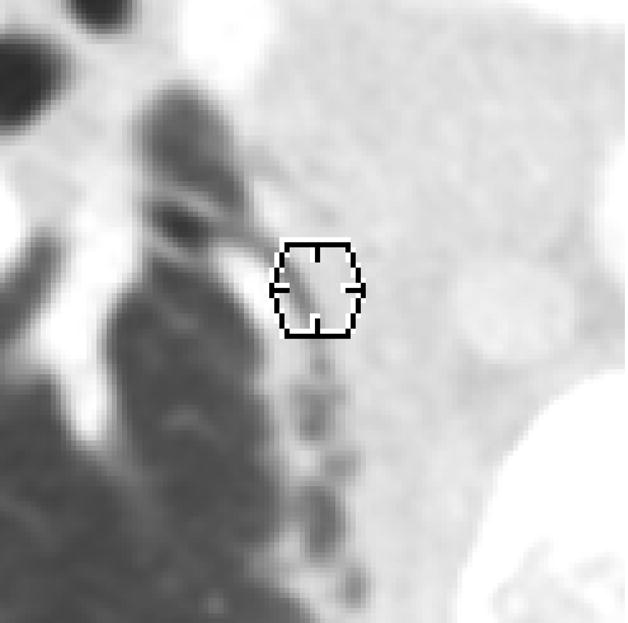
An errant “nodule < 3 mm” mark (represented by a 3-mm-diameter hexagon positioned at the center-of-mass location indicated by the radiologist) within the lung field (category 1 error). This mark was removed by the radiologist during the QA process.
Figure 4.
A lesion that was marked as both a “nodule ≥ 3 mm” and a “non-nodule ≥ 3 mm” by the same radiologist (category 2 error). The radiologist removed the “non-nodule ≥ 3 mm” mark during the QA process.
Figure 5.
A lesion that received a “nodule < 3 mm” mark from the same radiologist in each of these two adjacent sections (category 3 error). The radiologist removed the second mark during the QA process.
Figure 6.
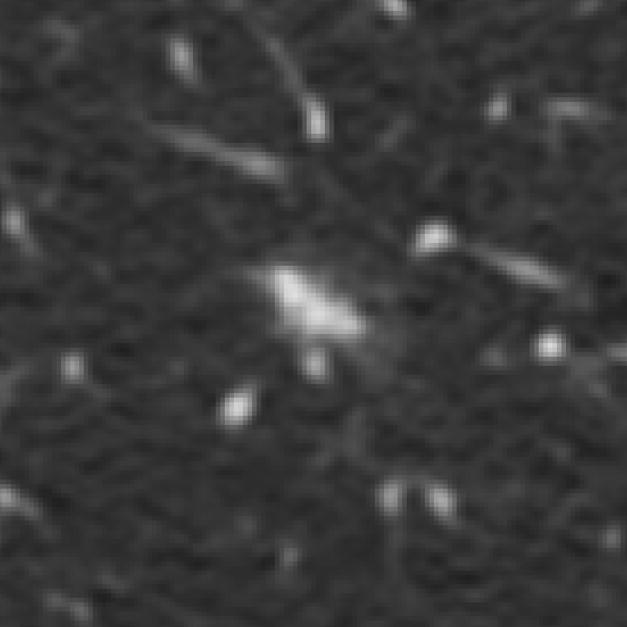
A lesion marked as a “nodule ≥ 3 mm” by three radiologists with no mark at all assigned by the fourth radiologist (category 6 error). As a result of the QA process, the fourth radiologist indicated that an error had been made and also marked this lesion as a “nodule ≥ 3 mm.”
Any nodule with a mark or marks that satisfied the criterion for one of these categories was referred to the specific radiologist who assigned the mark in question. That radiologist either (1) corrected the mark in a manner that resolved the inconsistency or (2) confirmed that the mark, despite being flagged as a potential error, was intentional. Since the QA process was not designed to provide radiologists with a third evaluation of a scan after the blinded and unblinded read phases, only marks that were identified as belonging to one of the seven QA categories could be modified by the radiologists during the QA process. Any modifications to the marks were stored in revised XML files that represent the final reads of that scan.
Patient image data
The QA process was applied to 100 CT scans collected and marked by the LIDC. With appropriate Institutional Review Board approvals, the scans were culled from the clinical archives of the five LIDC institutions. The 100 scans each had been acquired from different patients. Since the scans were collected from five different institutions, a range of scanner manufacturers and models was represented (GE Medical Systems (n=46), Siemens (n=31), Toshiba (n=17), and Philips (n=6)). The tube peak potential energies used for scan acquisition were as follows: 120 kV (n=55), 130 kV (n=3), 135 kV (n=17), and 140 kV (n=25). Tube current ranged from 40–499 mA (mean: 138 mA). Slice thicknesses were 1.25 mm (n=20), 2.0 mm (n=33), 2.5 mm (n=26), and 3 mm (n=21). Reconstruction interval ranged from 0.625–3.0 mm (mean: 2.0 mm). The in-plane resolution of the 512x512-pixel sections ranged from 0.488–0.946 mm (mean: 0.656 mm).
RESULTS
A total of 829 lesions were identified as lung nodules (either as “nodule ≥ 3 mm” or as “nodule < 3 mm”) by at least one radiologist at the completion of the unblinded read phase (i.e., the “truth” collection process). After review of over 2400 marks that the radiologists assigned to these nodules, the QA process yielded potential errors in 89 nodules (10.7% of the total 829 nodules) across 44 scans (44.0% of the total 100 scans) with potential errors; an additional scan was identified in which two separate errant “non-nodule ≥ 3 mm” marks appeared. Altogether, the QA process yielded a total of 91 lesions across 45 CT scans that required further evaluation. Twelve of these lesions required review by more than one of the four radiologists (10 required review by two radiologists and two required review by three radiologists), so that a total of 105 individual QA issues were identified and referred back to the radiologist who assigned each of the marks in question. Table 2 presents the number of lesions with QA errors and the number of individual QA errors (i.e., individual marks that were flagged) in each of the seven QA categories. More issues were identified for QA category 3 (defined as more than a single “nodule < 3 mm” mark or more than one set of “nodule ≥ 3 mm” contours assigned to the same lesion by a single radiologist) than for any other category.
Table 2.
The number of lesions with QA errors and the number of individual QA errors (i.e., individual marks that were flagged) in each of the seven QA categories.
| QA Category | Definition | Number of Lesions with QA Issues | Number of Individual QA Issues |
|---|---|---|---|
| 1 | errant marks on non-pulmonary regions of the image or stray marks within the lungs | 14 | 16 |
| 2 | marks from multiple categories assigned to the same lesion by the same radiologist | 13 | 14 |
| 3 | more than a single nodule mark assigned to the same lesion by a single radiologist | 20 | 28 |
| 4 | “nodule ≥ 3 mm” contours for a single lesion that are recorded as more than one lesion | 0 | 0 |
| 5 | “nodule ≥ 3 mm” contours that are not contiguous across sections | 11 | 12 |
| 6 | lesion marked as “nodule ≥ 3 mm” by 3 radiologists with no mark at all by the 4th | 21 | 21 |
| 7 | inconsistency between lesion size and the assigned nodule category | 14 | 14 |
| Total | 93* | 105 |
QA issues were identified for 91 lesions; however, two lesions demonstrated issues from two different QA categories
Of the 105 potential errors identified by the QA process, 101 (96.2%) were corrected by the radiologists. The four potential errors that were not modified involved lesions to which three radiologists assigned “nodule ≥ 3 mm” marks and the fourth radiologist assigned no mark at all (category 6); on further review during the QA process, the sole radiologist who did not mark the lesions verified that the decision to assign no mark was intentional (see Figure 7). In the course of correcting errors identified by the QA process, 21 lesions that had been categorized as a nodule (either a “nodule < 3 mm” or a “nodule ≥ 3 mm”) by at least one radiologist after the unblinded read phase were no longer considered to be nodules by any radiologist (see Figure 8): 12 of the 16 errant-mark errors (category 1) involved “nodule < 3 mm” marks that were removed by the radiologist; five of the 14 multiple-lesion-category errors (category 2) across four lesions involved both a “nodule < 3 mm” mark and a “non-nodule ≥ 3 mm” mark such that when the “nodule < 3 mm” marks were removed, no other nodule marks remained for those lesions; four of the 14 “nodule < 3 mm” marks with size inconsistencies (category 7) were removed or changed to “non-nodule ≥ 3 mm” marks so that no other nodule marks remained for those lesions; and one “nodule < 3 mm” mark was removed from a lesion (with no other marks) when the radiologist who placed that mark re-outlined a spatially proximate “nodule < 3 mm” with non-contiguous contours (category 5). The final set of XML files, after all QA modifications were completed, included a total of 808 nodules as identified by at least one radiologist.
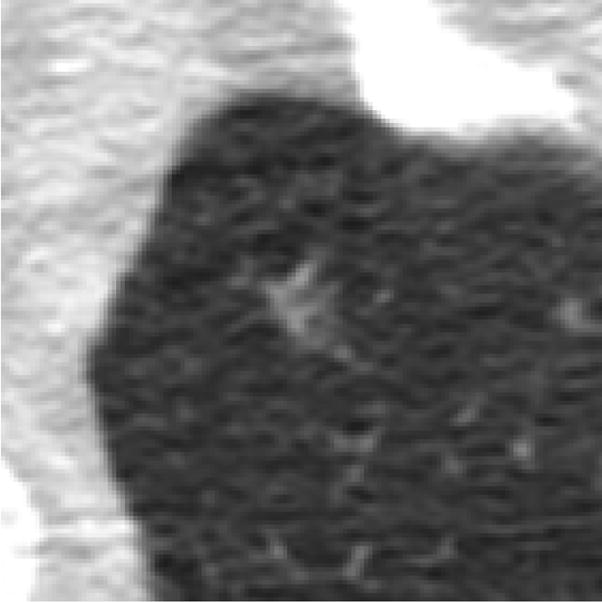
Figure 7.
A lesion marked as a “nodule ≥ 3 mm” by three radiologists with no mark at all assigned by the fourth radiologist. The QA process confirmed that the “no mark” of the fourth radiologist was intentional.
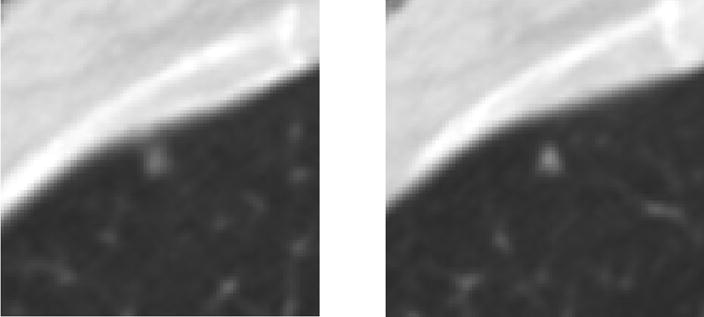
Figure 8.
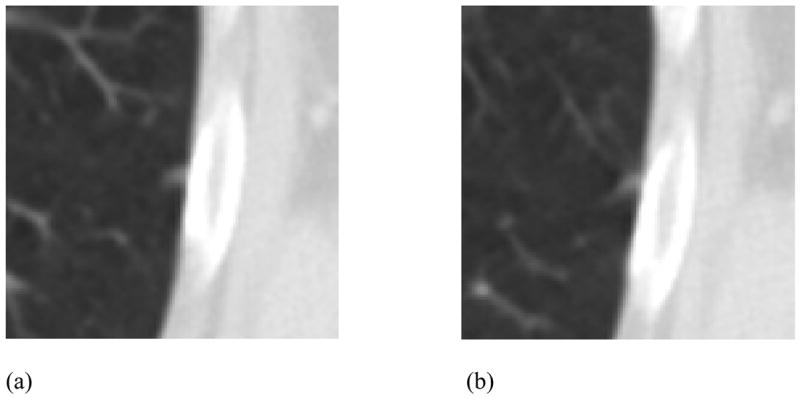
(a) A lesion that received a “nodule < 3 mm” mark by only one radiologist (the only nodule mark of any kind) and, in another section, (b) a “non-nodule ≥ 3 mm” mark from the same radiologist (category 2 error). This lesion also received “non-nodule ≥ 3 mm” marks from other radiologists. During the QA process the “nodule < 3 mm” mark was removed by the radiologist, thus eliminating “nodule” status for this lesion in the final assessment of “truth.”
DISCUSSION
The LIDC data collection process intentionally did not involve the use of a consensus panel and was performed asynchronously across four institutions. This process was developed as a more thorough, robust approach to “truth” collection that captures more of the variability that exists between radiologists. The result, however, is a more complex, more technically challenging paradigm that requires a complementary QA process to ensure the integrity of the acquired “truth” data. Many of the QA issues presented in this study will not exist when “truth” is established during the single review of a convened truth panel. Rather, these issues are a consequence of the independent, asynchronous, and geographically distributed two-phase process that uses electronic review tools and XML file formats to capture the required specific details of lung nodule location and extent. We expect that this data collection paradigm might become a more standard approach as CAD research matures toward eventual FDA approval and as multicenter trials become more sophisticated.
The rationale for each QA category may be appreciated by considering the potential source of each error. Category 1 errors (errant marks) likely arise from inadvertent clicks of the mouse with the cursor in the interactive display window of the interface, either while the radiologist is manipulating display features (e.g., window/level or zoom) or while the radiologist is passing the cursor over the display window to access control panel functions. Category 2 errors (marks from multiple categories by the same radiologist) and category 3 errors (duplicate “nodule ≥ 3 mm” or “nodule < 3 mm” marks) likely result either from inadvertent double clicks or due to the electronic worklist presented to the radiologists during the unblinded reading sessions. The worklist presents all blinded-read marks from all radiologists, and during the unblinded reading session, each radiologist reviews the marks through the worklist to decide how to modify their own marks. Depending on the order of the marks in the worklist, a radiologist could, for example, observe a “nodule < 3 mm” mark on a lesion in one section and decide to accept that mark; then, after reviewing other marks, the radiologist might observe a “nodule < 3 mm” mark that had been placed on that same lesion but on the adjacent section and, failing to review the previous section to mentally associate the two marks, decide to accept that mark as well. Category 4 errors (separate lesions recorded for “nodule ≥ 3 mm” contours in each section of a single lesion) appear to have been a software error during the first 30 scans, since no such error was observed in the present study. Category 5 errors (non-contiguous contours for a single nodule ≥ 3 mm) typically result when a radiologist inadvertently skips a section while outlining a nodule ≥ 3 mm.
While category 6 errors (three radiologists assigned “nodule ≥ 3 mm” marks and the fourth radiologist assigned no mark at all) and category 7 errors (inconsistency between the physical size of a lesion and the assignment of the “nodule < 3 mm” or “nodule ≥ 3 mm” categories) could be considered second-guessing a radiologist’s interpretation rather than identifying an error, such a situation would be sufficiently unusual to cause suspicion that an error indeed had occurred (for example, the radiologist neglected to save the contours after outlining the lesion). Since the end result of the LIDC database is to provide as complete an inventory as possible of pulmonary lesions, and since the primary pulmonary lesions of interest in this database are nodules ≥ 3 mm, extra attention to the consistency of these marks is warranted. In fact, of the 35 identified category 6 or category 7 errors, only four were intentional.
Since we only reviewed the final unblinded read phase marks, we did not investigate whether the potential errors tended to come from the blinded or unblinded read phase. Inconsistencies introduced by a radiologist during the blinded reading session may be propagated through the unblinded reading sessions, or they may be self-corrected during the unblinded reading session.
While each QA category was defined to capture an error that could be introduced into the data given the manner in which the two-phase image annotation process is implemented by human manipulation of software tools and computer interfaces, some identified errors could reflect the actual intent of the radiologist. Therefore, all identified “errors” were considered potential errors until reviewed by the respective radiologist, who was given the opportunity to confirm intent.
The identification of potential errors fundamentally depends on the groupings of marks, since different groupings of marks could alter the identified QA issues. During the retrospective grouping process, we deferred to the implied judgment of the radiologists as reflected in the marks they assigned, since different radiologists legitimately may disagree on lesion contiguity. In some instances, the marks assigned by the radiologists to an abnormal region could reasonably be considered during the grouping process to capture one complex lesion or two separate lesions in close spatial proximity (Figure 9). If a radiologist placed a “nodule ≥ 3 mm” mark and a “non-nodule ≥ 3 mm” (as shown in the example of Figure 9) in a region occupied by such an abnormality while another radiologist marked the entire abnormality as a single “nodule ≥ 3 mm,” the region was considered (during the grouping of marks) to contain two lesions rather than flagging a multiple-category QA error (category 2) for the first radiologist; the fact that the second radiologist considered both lesions to be a single lesion was noted also. In this manner, the implied judgment of both radiologists was captured. This situation occurred four times in the 100 scans for what was recorded as eight nodules (four pairs) even though all radiologists did not appear to agree that the two lesions in each pair were distinct.
Figure 9.
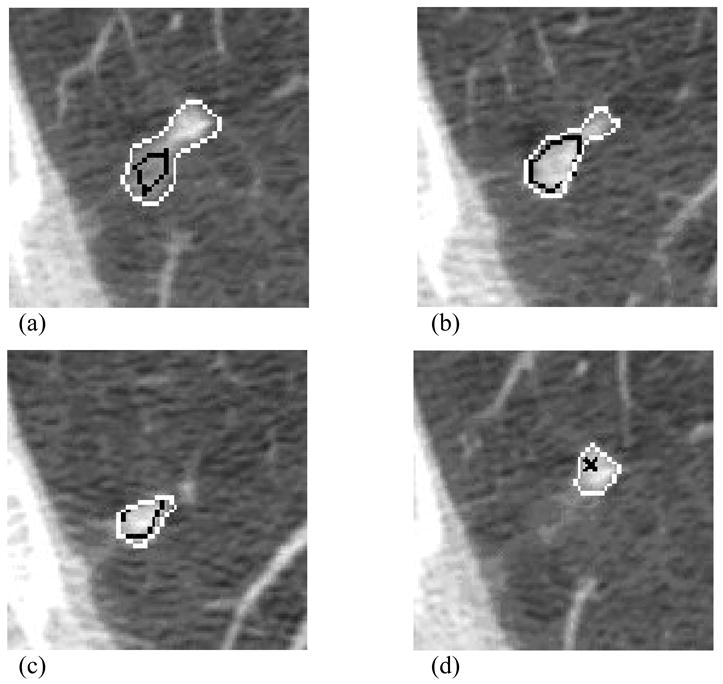
Radiologist marks in a CT scan that demonstrate the intent of one radiologist to capture one large lesion (white contours) and the intent of another radiologist to capture two distinct lesions (black contours and black “x”). In (a), both radiologists provide fairly similar “nodule ≥ 3 mm” contours. Two sections inferior (b), the first radiologist includes within the nodule boundary a side lobe of pixels that the second radiologist does not include. An additional two sections inferior (c), the second radiologist constructs a smaller contour to indicate the inferior aspect of the nodule, which the first radiologist clearly regards as part of a larger, more complex “nodule ≥ 3 mm.” In the adjacent section (d), the first radiologist continues to outline the extension of the same nodule, which the second radiologist considers to be a separate “non-nodule ≥ 3 mm.”
The process of grouping marks and identifying potential errors as reported in this study was performed manually. To make this process more efficient, we are developing a computerized method that will automatically group the marks from various radiologists into distinct nodules and then flag marks that satisfy any of the QA categories. The manual approach was performed on all marks retrospectively after all data from the unblinded reading session of each radiologist was collected and collated; when a potential error was identified, the radiologist who placed the mark in question was contacted to resolve the issue, which usually involved arranging for the radiologist to review the lesion through the computer interface. The automated method will permit the identification of most QA issues in real time during the blinded and unblinded reading session of each radiologist, thus allowing the radiologist to correct errors before the conclusion of the reading session.
The method (and the implementation of that method) through which expert observers define “truth” can have a substantial impact on CAD studies, both on system development and on the eventual assessment of system performance. Indeed, some aspect of system performance is typically incorporated into system development through an iterative process. Potential inconsistencies in the acquired “truth” data must be identified and corrected before investigators can rely on this data. The QA process developed by the LIDC identified errors in the “truth” marks from 45 of 100 CT scans; if left uncorrected, these errors could have adversely affected the development and performance assessment of CAD methods that used these scans. A detailed, and presumably more robust and realistic, process of establishing “truth” for lung nodule detection studies, such as developed by the LIDC, must incorporate a QA model to guarantee the integrity of the “truth” that will provide the basis for training, testing, and validating CAD systems.
Table 1.
Distribution of CT scanner manufacturer and model associated with the 100 scans.
| Manufacturer | Model | Number of scans |
|---|---|---|
| GE Medical Systems | LightSpeed QX/i | 26 |
| GE Medical Systems | LightSpeed 16 | 4 |
| GE Medical Systems | LightSpeed Pro 16 | 13 |
| GE Medical Systems | LightSpeed Ultra | 2 |
| GE Medical Systems | LightSpeed Power | 1 |
| Philips | Brilliance 16 | 1 |
| Philips | Brilliance 16P | 4 |
| Philips | Brilliance 40 | 1 |
| Siemens | Emotion 6 | 3 |
| Siemens | Sensation 16 | 22 |
| Siemens | Sensation 64 | 6 |
| Toshiba | Aquilion | 17 |
Acknowledgments
Supported in part by USPHS Grants U01CA091085, U01CA091090, U01CA091099, U01CA091100, and U01CA091103.
Footnotes
Publisher's Disclaimer: This is a PDF file of an unedited manuscript that has been accepted for publication. As a service to our customers we are providing this early version of the manuscript. The manuscript will undergo copyediting, typesetting, and review of the resulting proof before it is published in its final citable form. Please note that during the production process errorsmaybe discovered which could affect the content, and all legal disclaimers that apply to the journal pertain.
References
- 1.Clarke LP, Croft BY, Staab E, Baker H, Sullivan DC. National Cancer Institute initiative: Lung image database resource for imaging research. Academic Radiology. 2001;8:447–450. doi: 10.1016/S1076-6332(03)80555-X. [DOI] [PubMed] [Google Scholar]
- 2.Armato SG, III, McLennan G, McNitt-Gray MF, et al. Lung Image Database Consortium: Developing a resource for the medical imaging research community. Radiology. 2004;232:739–748. doi: 10.1148/radiol.2323032035. [DOI] [PubMed] [Google Scholar]
- 3.Dodd LE, Wagner RF, Armato SG, III, et al. Assessment methodologies and statistical issues for computer-aided diagnosis of lung nodules in computed tomography: Contemporary research topics relevant to the Lung Image Database Consortium. Academic Radiology. 2004;11:462–475. doi: 10.1016/s1076-6332(03)00814-6. [DOI] [PubMed] [Google Scholar]
- 4.Rogers SR, Brown MS, Goldin JG, Suh RD, Kim HJ, Aberle DR. Automated lung nodule detection in CT: Nodule inclusion criteria for determining ground truth. Radiology. 2002;225(P):407. [Google Scholar]
- 5.Wormanns D, Ludwig K, Beyer F, Heindel W, Diederich S. Detection of pulmonary nodules at multirow-detector CT: Effectiveness of double reading to improve sensitivity at standard-dose and low-dose chest CT. European Radiology. 2005;15:14–22. doi: 10.1007/s00330-004-2527-6. [DOI] [PubMed] [Google Scholar]
- 6.Leader JK, Warfel TE, Fuhrman CR, et al. Pulmonary nodule detection with low-dose CT of the lung: Agreement among radiologists. American Journal of Roentgenology. 2005;185:973–978. doi: 10.2214/AJR.04.1225. [DOI] [PubMed] [Google Scholar]
- 7.Novak CL, Qian J, Fan L, et al. Inter-observer variations on interpretation of multi-slice CT lung cancer screening studies, and the implications for computer-aided diagnosis. SPIE Proceedings. 2002;4684:68–79. [Google Scholar]
- 8.Wormanns D, Beyer F, Diederich S, Ludwig K, Heindel W. Diagnostic performance of a commercially available computer-aided diagnosis system for automatic detection of pulmonary nodules: Comparison with single and double reading. Rofo: Fortschritte auf dem Gebiete der Rontgenstrahlen und der Nuklearmedizin. 2004;176:953–958. doi: 10.1055/s-2004-813251. [DOI] [PubMed] [Google Scholar]
- 9.Marten K, Seyfarth T, Auer F, et al. Computer-assisted detection of pulmonary nodules: Performance evaluation of an expert knowledge-based detection system in consensus reading with experienced and inexperienced chest radiologists. European Radiology. 2004;14:1930–1938. doi: 10.1007/s00330-004-2389-y. [DOI] [PubMed] [Google Scholar]
- 10.Revesz G, Kundel HL, Bonitatibus M. The effect of verification on the assessment of imaging techniques. Investigative Radiology. 1983;18:194–198. doi: 10.1097/00004424-198303000-00018. [DOI] [PubMed] [Google Scholar]
- 11.Eckstein MP, Wickens TD, Aharonov G, Ruan G, Morioka CA, Whiting JS. Quantifying the limitations of the use of consensus expert committees in ROC studies. SPIE Proceedings. 1998;3340:128–134. [Google Scholar]
- 12.Nishikawa RM, Giger ML, Doi K, et al. Effect of case selection on the performance of computer-aided detection schemes. Medical Physics. 1994;21:265–269. doi: 10.1118/1.597287. [DOI] [PubMed] [Google Scholar]
- 13.McNitt-Gray MF, Armato SG, III, Meyer CR, et al. The Lung Image Database Consortium (LIDC) data collection process for nodule detection and annotation. SPIE Proceedings. 2007;6514 doi: 10.1016/j.acra.2007.07.021. in press. [DOI] [PMC free article] [PubMed] [Google Scholar]
- 14.Armato SG, III, Roberts RY, McLennan G, et al. The Lung Image Database Consortium (LIDC): A quality assurance model for the collection of expert-defined “truth” in lung-nodule-based image analysis studies. SPIE Proceedings. 2007;6514 in press. [Google Scholar]