Abstract
Mutations in genes encoding neuronal voltage-gated sodium channel subunits have been linked to inherited forms of epilepsy. The majority of mutations (>100) associated with generalized epilepsy with febrile seizures plus (GEFS+) and severe myoclonic epilepsy of infancy (SMEI) occur in SCN1A encoding the NaV1.1 neuronal sodium channel α-subunit. Previous studies demonstrated functional heterogeneity among mutant SCN1A channels, revealing a complex relationship between clinical and biophysical phenotypes. To further understand the mechanisms responsible for mutant SCN1A behavior, we performed a comprehensive analysis of the single-channel properties of heterologously expressed recombinant WT-SCN1A channels. Based on these data, we then determined the mechanisms for dysfunction of two GEFS+-associated mutations (R1648H, R1657C) both affecting the S4 segment of domain 4. WT-SCN1A has a slope conductance (17 pS) similar to channels found in native mammalian neurons. The mean open time is ∼0.3 ms in the −30 to −10 mV range. The R1648H mutant, previously shown to display persistent sodium current in whole-cell recordings, exhibited similar slope conductance but had an increased probability of late reopening and a subfraction of channels with prolonged open times. We did not observe bursting behavior and found no evidence for a gating mode shift to explain the increased persistent current caused by R1648H. Cells expressing R1657C exhibited conductance, open probability, mean open time, and latency to first opening similar to WT channels but reduced whole-cell current density, suggesting decreased number of functional channels at the plasma membrane. In summary, our findings define single-channel properties for WT-SCN1A, detail the functional phenotypes for two human epilepsy-associated sodium channel mutants, and clarify the mechanism for increased persistent sodium current induced by the R1648H allele.
INTRODUCTION
Voltage-gated sodium channels are integral membrane proteins essential for the generation and propagation of action potentials in excitable tissues. Mutations in genes encoding sodium channel subunits have been associated with inherited disorders of membrane excitability manifesting as abnormal skeletal muscle contraction, cardiac arrhythmias, or epilepsy (George, 2005). Several studies have discerned important features of sodium channel dysfunction that underlie these disorders, and provided insight into their pathophysiology and defining genotype–phenotype correlations.
Mutations in genes encoding neuronal voltage-gated sodium channel α subunits (SCN1A and SCN2A) and the accessory β1 subunit (SCN1B) have been linked to inherited forms of epilepsy (Wallace et al., 1998; Escayg et al., 2000; Sugawara et al., 2001; Claes et al., 2001; Heron et al., 2002; Fujiwara et al., 2003). These include the syndromes of generalized epilepsy with febrile seizures plus (GEFS+) and severe myoclonic epilepsy of infancy (SMEI). The majority of the mutations (>100) associated with these inherited epilepsies occur in the SCN1A-encoded NaV1.1 neuronal sodium channel α-subunit. We and others have examined the functional consequences of SCN1A mutations using heterologous expression of recombinant human or rodent sodium channels (Spampanato et al., 2001, 2004; Sugawara et al., 2001; Lossin et al., 2002, 2003; Rhodes et al., 2004). Available evidence indicates that there is considerable functional heterogeneity among mutant SCN1A channels associated with distinct epileptic syndromes, revealing a complex relationship among clinical and biophysical phenotypes.
As an illustration of the functional heterogeneity observed for SCN1A mutations, we previously characterized the properties of whole-cell currents generated by heterologous expression of wild-type (WT) SCN1A or the GEFS+-associated missense mutations R1648H and R1657C (Lossin et al., 2002, 2003). Both mutations affect highly conserved, positively charged residues in the voltage-sensing S4 segment of the fourth domain; R1648H is in the middle of S4, while R1657C is the innermost positively charged residue in this segment. The most prominent effect of R1648H is an apparent defect in fast inactivation leading to increased persistent sodium current (Lossin et al., 2002; Rhodes et al., 2004). The main functional defects exhibited by R1657C are reduced current density and a depolarizing shift in the voltage dependence of activation (Lossin et al., 2003). Our previous evaluation of R1648H single-channel behavior suggested late channel reopening as a potential mechanism for persistent current (Lossin et al., 2002). However, those studies examined membrane patches with >10 channels per patch and at only one voltage, potentially concealing other functional defects.
To better understand the mechanisms responsible for mutant SCN1A behavior, we determined the single-channel properties of WT-SCN1A and more fully characterized the biophysical phenotypes caused by R1648H and R1657C mutations. WT-SCN1A exhibits a slope conductance of 17 pS, a brief (∼0.3 ms) mean open time that it is voltage independent in the −30 to −10 mV range, and a voltage-dependent latency to first opening. We also demonstrated that R1648H single channels exhibit a marked increase in the probability of late reopening with a fraction of channels having significantly longer open times. In contrast to previous suggestions, our data do not support a gating mode shift as the explanation for increased persistent current caused by this mutation. In addition, the single-channel conductance, peak open probability, and time to first opening measured for R1657C channels are similar to those of wild-type channels. Thus, the reduction in current density previously observed with the R1657C mutation is most likely due to a decrease in the number of active channels at the plasma membrane. These observations will enable development of advanced computational modeling based on both whole-cell and single-channel data to predict the impact of sodium channel dysfunction on neuronal excitability, and serve as a basis for comparison of other mutations similarly characterized.
MATERIALS AND METHODS
Cell Culture
All experiments were conducted using tsA201 cells (HEK-293 cells stably transfected with SV40 large T antigen) grown at 37°C with 5% CO2 in Dulbecco's modified Eagle's medium (DMEM) supplemented with 10% FBS (ATLANTA Biologicals), 2 mM l-glutamine, and penicillin (50 U/ml)-streptomycin (50 μg/ml). Only cells from passage number <13 were used. Unless otherwise stated, all tissue culture media was obtained from Life Technologies, Inc.
Plasmids and Cell Transfection
Full-length wild-type and mutant SCN1A cDNAs were generated and engineered in the mammalian expression vector pCMV-Script (Stratagene) as previously described (Lossin et al., 2002; Lossin et al., 2003). Plasmids encoding the human voltage-gated sodium channel accessory subunits hβ1 or hβ2 in vectors containing the marker genes CD8 (pCD8-IRES-hβ1) or GFP (pGFP-IRES-hβ2) were also used in this study.
Expression of SCN1A, hβ1, and hβ2 subunits was achieved by transient plasmid transfection using Superfect Transfection Reagent (QIAGEN). For whole-cell experiments, 6 μg of total DNA was transfected (SCN1A:hβ1:hβ2 mass ratio was 10:1:1) (Lossin et al., 2002, 2003). For WT-SCN1A and R1648H single-channel experiments, we transfected 2.2 μg of total DNA (1.2 α-subunit, 0.5 hβ1, and 0.5 hβ2) to attain outside-out patches with relatively few channels. For R1657C, which expresses less well, 2.2 μg of α-subunit plasmid DNA was transfected in order to consistently observe single-channel activity. Cells were incubated for 48 h as described above after transfection before their use in electrophysiology experiments. Transfected cells were dissociated by brief exposure to trypsin/EDTA, resuspended in supplemented DMEM medium, plated on glass coverslips pretreated with CELL-TAK cell and tissue adhesive (Collaborative Biomedical Products) and allowed to recover for ∼2 h at 37°C in 5% CO2. Polystyrene microbeads precoated with anti-CD8 antibody (Dynabeads M-450 CD 8; Dynal) were added and only cells positive for both CD8 antigen (i.e., hβ1 expression) and GFP fluorescence (i.e., hβ2 expression) were studied.
Electrophysiology
Coverslips were placed into a recording chamber on the stage of an inverted microscope with epifluorescence capability. After allowing the cells to equilibrate for 10 min in bath solution, sodium currents were recorded in the whole-cell or excised, outside-out patch configuration of the patch-clamp technique (Hamill et al., 1981) using an Axopatch 200B series amplifier (Axon Instruments). Bath solution contained (in mM) 145 NaCl, 4 KCl, 1.8 CaCl2, 1 MgCl2, 10 HEPES, pH 7.35, 310 mOsm/kg. The composition of the pipette solution was (in mM) 10 NaF, 110 CsF, 20 CsCl, 2 EGTA, 10 HEPES, pH 7.35, 310 mOsm/kg. Osmolarity and pH values were adjusted with sucrose and NaOH, respectively. Patch pipettes were pulled from thick-wall borosilicate glass (World Precision Instruments, Inc.) with a multistage P-97 Flaming-Brown micropipette puller (Sutter Instruments Co.) and fire polished with a Micro Forge MF 830 (Narishige). Pipette resistance was ∼2 MΩ for whole-cell experiments and ∼6 MΩ for outside-out experiments. Single-channel recording pipettes were coated with Sylgard 184 (Dow Corning). Agar bridges (2% in bath solution) served as reference electrodes.
Whole-cell currents were recorded as previously described (Lossin et al., 2002, 2003; Rhodes et al., 2004). Single-channel currents were filtered at 5 kHz and acquired at 20 kHz. Filter rise time was 66 μs (4 pole Bessel filter), and openings shorter than 0.1 ms were not included in the analysis. Pulse generation and data collection were done using Clampex 8.1 (Axon Instruments, Inc.). Currents from excised outside-out patches were recorded only from cells exhibiting whole-cell sodium currents in the range 600–700 pA at a holding potential of 0 mV (no series resistance compensation). Channel behavior was examined over a range of test potentials (typically −30 to +10 mV) from a holding potential of −100 mV. Each voltage step was followed by a 2–5 s recovery period at −100 mV. All experiments were performed at room temperature. The number of channels in the patch was determined as the maximum number of channels seen open at the same time in all pulses for all voltages tested. Multichannel patches were used only to obtain ensemble-average currents, some of these patches had multiple openings and we did not determine the exact number of channels per patch.
Data Analysis
Data analysis and presentation were performed with Clampfit 8.1, Fetchan and Pstat 6.0.5 (Axon Instruments, Inc.), SigmaPlot 2000 (SPSS Science), and Origin 7.0 (OriginLab) software. Whole-cell conductance was calculated using the formula G Na = I Na /(V − E rev) where Erev is the Na+ estimated reversal potential and normalized to the maximal conductance between −80 and +20 mV. The voltage dependence of activation was obtained with the Boltzmann function: G = 1/(1 + exp[(V − V 1/2)/k]. Ensemble-average currents were generated with Clampfit and fitted with a double exponential function, f(t) = A 1 · exp(−t/τ 1) + A 2 · exp(−t/τ 2) + C. For single-channel recordings, linear leak and capacitive transients were subtracted using the average of blank traces, and no corrections were made for missed events. The first bin in open time histograms was not used for curve fitting. Single-channel traces were filtered at 2 kHz for display purposes. Data are represented as means ± SEM, with the number of experiments (outside-out patches) provided in the figure legends. Statistical significance was determined using unpaired Student's t test and P < 0.05 was considered statistically significant.
RESULTS
Single-channel Analysis of WT-SCN1A
Currently there is no information regarding the single-channel biophysical properties of SCN1A. To further understand the function of SCN1A and elucidate the mechanisms responsible for mutant SCN1A behavior, we examined single-channel activities using the excised, outside-out configuration of the patch clamp technique (Hamill et al., 1981). We initially characterized the single-channel behavior of heterologously expressed human WT-SCN1A for later comparison with mutants. Single-channel activity was generally studied over the voltage range of −30 to +10 mV. In some multichannel patches, we were also able to measure channel activity at −40 and +20 mV. In all experiments, wild-type and mutant SCN1A channels were coexpressed with hβ1 and hβ2.
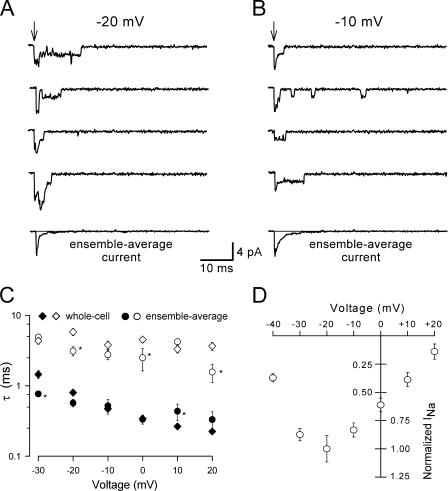
Fig. 1 illustrates single-channel records obtained from an excised outside-out patch containing WT-SCN1A channels. These records exhibit multiple simultaneous openings consistent with five channels in the patch. Ensemble averages computed from 100 records (lowest trace in each panel) qualitatively resemble whole-cell currents measured at the same test potentials from cells expressing WT-SCN1A (Lossin et al., 2002). The decay phase was best fitted with a double exponential function that yielded two time constants (designated fast and slow). In Fig. 1 C, we compare the voltage dependence of time constants for fast inactivation obtained from ensemble average currents with those previously calculated for whole-cell currents (Lossin et al., 2002). Overall, the values obtained from the single-channel and whole-cell data compare well. For example, the time constants derived from single-channel data at −10 mV were 0.48 ± 0.08 ms and 2.37 ± 0.35 ms for fast and slow time constants (n = 12), respectively. These values are not different than those obtained from whole-cell recordings at the same voltage (0.47 ± 0.02 ms and 3.81 ± 0.51 ms for fast and slow components, respectively; n = 8).
Figure 1.
Single-channel characterization of WT-SCN1A channels. Sodium channel activity recorded at −20 mV (A) and −10 mV (B) from a multichannel outside-out patch excised from a cell expressing WT-SCN1A. Arrows indicate the onset of patch depolarization from −100 mV to the indicated voltage. The bottom traces show the ensemble average current obtained from 100 consecutive traces. The gray line indicates the zero current level. (C) The decay phase of the ensemble average currents was fitted with a biexponential function. The slow and fast time constants for WT-SCN1A obtained from whole-cell traces (⋄, ♦; Lossin et al., 2003) and ensemble-average currents (○, •) are plotted as a function of voltage. Filled and open symbols depict the fast and slow time constants, respectively, n = 12. (D) Peak current–voltage relationships derived from ensemble-average currents. Currents were normalized to the peak current value measured at −20 mV and plotted as a function of voltage, n = 12.
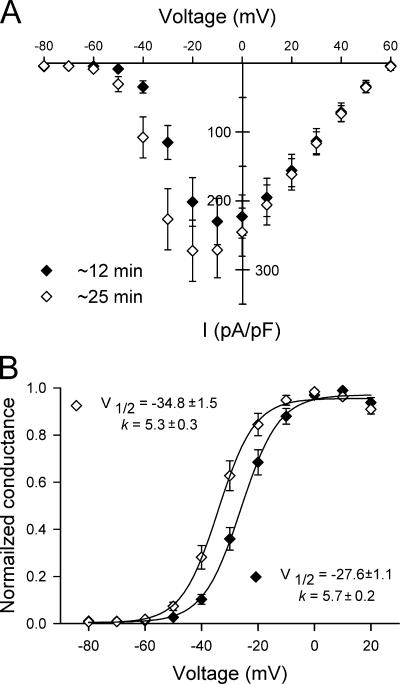
To compare data from patches containing dissimilar numbers of channels, we normalized the peak current at each voltage to the current measured at −20 mV. The general current–voltage relationship for outside-out patches expressing WT-SCN1A channels (Fig. 1 D) resembles our previously described whole-cell data (Lossin et al., 2002, 2003; Rhodes et al., 2004). However, peak activation in outside-out patches occurred at −20 mV, a hyperpolarization shift of 10 mV when compared with whole-cell current measurements. A possible explanation for this discrepancy is the longer time required to complete the ensemble-average current–voltage relationships in single-channel experiments (20–30 min) as compared with whole-cell current–voltage relationships (∼10 min). Previous experiments have shown a time-dependent hyperpolarization shift of the voltage dependence of Na+ kinetics (Fernandez et al., 1984; Kimitsuki et al., 1990). To test this possibility, we recorded whole-cell currents from tsA201 cells transfected with WT-SCN1A at early (10–12 min) and later (23–27 min) time points after establishing the whole-cell configuration. Fig. 2 shows whole-cell current–voltage relationship and voltage dependence of activation obtained from these early and late recordings. Both measurements displayed a time-dependent hyperpolarization shift, which can explain the −10 mV shift in peak activation observed in outside-out patches. Thus, our initial data indicate that single-channel observations made under these conditions correlate well with expression of WT-SCN1A.
Figure 2.
Time-dependent hyperpolarization shift in WT-SCN1A properties. (A) Current–voltage relationships for WT-SCN1A whole-cell currents recorded at 10–12 min (♦) and 23–27 min (⋄) after establishing the whole-cell configuration. Currents were elicited by test pulses to various potentials and normalized to cell capacitance (n = 11 for both conditions). (B) Voltage dependence of channel activation at 10–12 min (♦) and 23–27 min (⋄) after establishing the whole-cell configuration was estimated by fitting the data to the two-state Boltzmann equation. The membrane potentials for half-maximal activation (V1/2) and slope factors (k) are given on the graph (n = 11 for all experiments).
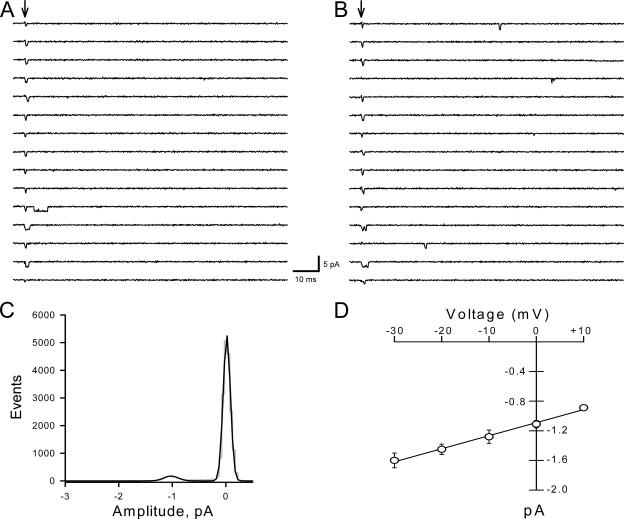
For more detailed analyses of single-channel events, we analyzed recordings containing ≤5 channels per patch. Fig. 3 illustrates single-channel records measured at 0 and −10 mV from an excised outside-out patch containing only two channels. The single-channel amplitude was measured by fitting all-points amplitude histograms with Gaussian curves (Fig. 3 C). Single-channel currents were plotted against the test potential and the slope conductance was obtained by linear regression (Fig. 3 D). The calculated slope conductance for WT-SCN1A determined between −30 and +10 mV was ∼17 pS (n ≥ 4). This conductance value falls within the range (16–20 pS) reported for native sodium channels in rat (Barres et al., 1989; Alzheimer et al., 1993; Baker and Bostock, 1998; Fernandes et al., 2001) and human (Frenkel et al., 1998) neurons. The single channel conductance of SCN1A is also similar to SCN4A expressed in tsA201 cells (17 pS; Chahine et al., 1994), SCN5A expressed in Xenopus oocytes (22 pS; Gellens et al., 1992), rat skeletal muscle μI expressed in HEK293 cells (18 pS; Ukomadu et al., 1992), and rat brain type II and III expressed in Xenopus oocytes (19 pS and 15 pS, respectively; Stühmer et al., 1987; Moorman et al., 1990).
Figure 3.
WT-SCN1A single-channel conductance. Consecutive single-channel traces from an outside-out patch expressing three channels are illustrated for 0 (A) and −20 mV (B). Arrows indicate the onset of patch depolarization from −100 mV to the indicated voltage. (C) All-points amplitude histogram from panel A fitted with a Gaussian curve (solid line). (D) Single-channel amplitudes plotted as a function of voltage. Channel amplitudes determined by fitting all-points histograms (○). The single-channel conductance was determined by fitting data to a linear relationship (solid lines) in the voltage range −30 to +10 mV; n ≥ 5.
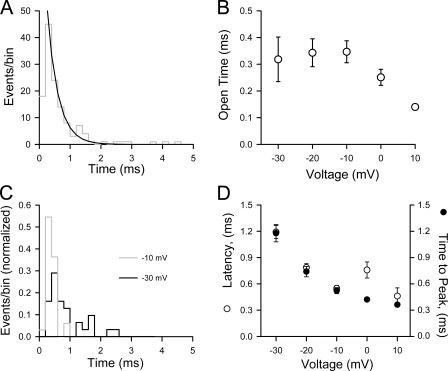
The open-time distribution for WT-SCN1A channels was investigated 0–20 ms after activation. Open time histograms were constructed for voltages in the range of −30 to +10 mV and are illustrated in Fig. 4. The plots were fitted with single exponential functions (Fig. 4 A) and the average open times plotted against the test potential (Fig. 4 B). The calculated mean open time at −10 mV was 0.35 ± 0.01 ms (n = 4). The mean open time values were not significantly different between −30 and −10 mV, but decreased at more positive potentials (Fig. 4 B). We also analyzed latency to first channel opening. Fig. 4 C illustrates latency to first event histograms obtained from 100 consecutive traces recorded at −30 and −10 mV from a cell with three channels. Cumulative histograms were transformed as if each patch contained one channel (Chahine et al., 1994) and fitted with single exponential functions. The calculated latencies for WT-SCN1A channels for the voltage range −30 to +10 mV are plotted in Fig. 4 D. In this voltage rage, the latency for first opening displays voltage dependence at hyperpolarizing potentials, but none at depolarizing potentials. At the test potential of −30 mV, WT-SCN1A channels open with a latency of 1.19 ± 0.07 ms (n = 3). Channel latency shortens slightly at more depolarizing potentials, (−10 mV, 0.55 ± 0.03 ms, n = 4; +10 mV, 0.46 ± 0.09 ms, n = 3), a trend reflected at the whole-cell level. In Fig. 4 D we also plot time to peak current obtained from whole-cell recordings from cells expressing WT-SCN1A activated from a holding potential of −100 mV. The whole-cell current reaches its maximum at −30 mV much slower than at other measured voltages, and it activates with similar rate in the −10 to +10 mV range. The single-channel properties determined for WT-SCN1A can now be used as a reference to understand the mechanisms responsible for mutant channel behavior.
Figure 4.
Single-channel properties of WT-SCN1A. (A) Open time histogram obtained at −20 mV from the same outside-out patch illustrated in Fig. 3. All channel openings recorded during 100 consecutive depolarizations to the indicated voltage from −100 mV are shown. Channel openings were recorded during the first 20 ms following membrane depolarization. Histograms were best fitted by a single exponential function (black line). (B) Voltage dependence of single-channel open times (○) obtained for WT-SCN1A in the −30 to +10 mV voltage range, n ≥ 3 for all voltages. (C) Latency to first event histograms from WT-SCN1A channels recorded in an outside-out patch depolarized from holding potential of −100 to −30 mV (black line) or −10 mV (gray line). (D) Mean first latency (○, n ≥ 3 for all voltages) and time to peak whole-cell current (⋄, n = 6) plotted against test potentials.
Single-channel Analysis of GEFS+-associated SCN1A Mutants
The most prominent effects on SCN1A function associated with the GEFS+ mutations R1648H and R1657C are increased persistent current (Lossin et al., 2002) and reduced current density (Lossin et al., 2003), respectively. We focused our efforts to determine single-channel behaviors that would explain the biophysical changes in SCN1A activity observed at the whole-cell level.
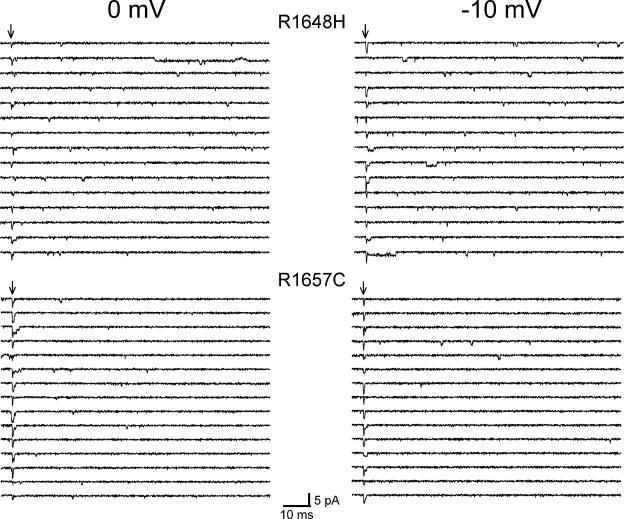
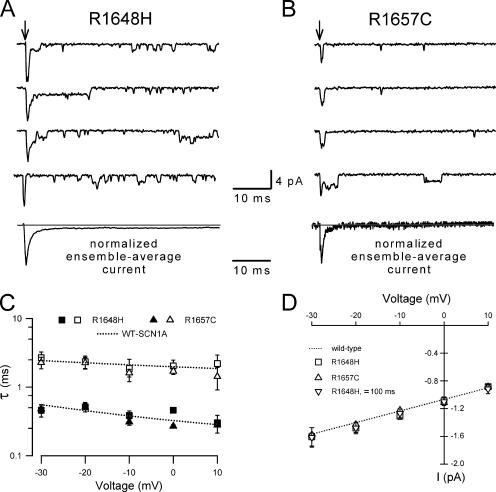
Fig. 5 illustrates typical single-channel behavior for R1648H (top) and R1657C (bottom) channels measured at 0 or −10 mV. Both patches have five channels per patch. Unlike WT-SCN1A, R1648H channels display openings 20 ms after onset of the test depolarization, well after the wild-type channel becomes inactive (see Fig. 3). Some of the late channel openings observed in R1648H patches exhibited long open times, but overt bursting behavior was never evident. In contrast, the single channel behavior of R1657C closely resembles the wild-type channel with rare late channel openings. Fig. 6 shows current traces recorded at −10 mV from multichannel outside-out patches excised from cells expressing either R1648H (10 channels/patch) or R1657C (five channels/patch) channels. The normalized ensemble average currents (Fig. 6) show rapid activation and inactivation qualitatively similar to corresponding currents measured in the whole-cell configuration (Lossin et al., 2002, 2003). The ensemble average currents compiled from R1648H patch recordings exhibited a persistent current (Fig. 6 A) that was absent in R1657C (Fig. 6 B) and WT-SCN1A (Fig. 1 A) patches. Ensemble-average current decay recorded from both mutants was fitted with a double exponential function, and the fast and slow time constants were plotted as a function of voltage (Fig. 6 C). The inactivation time constants derived using this approach did not differ between WT-SCN1A and the two mutant alleles in agreement with prior whole-cell measurements (Lossin et al., 2002, 2003).
Figure 5.
Single-channel activity of GEFS+-associated SCN1A mutants. Selected traces recorded from outside-out patches excised from one cell expressing R1648H SCN1A (top) and from another cell expressing R1657C SCN1A (bottom) recorded at 0 and −10 mV. Arrows indicate onset time for patch depolarization from −100 mV to the indicated voltage.
Figure 6.
Single-channel characterization of R1648H and R1657C. Sodium channel activity recorded at −10 mV from multichannel outside-out patches excised from cells expressing R1648H (A) or R6157C (B) channels. Records are selected traces and arrows indicate onset time for patch depolarization from −100 mV to the indicated voltage. The bottom traces show normalized ensemble-average currents obtained from 100 consecutive traces. The gray line indicates the zero current level. (C) The decay phase of the ensemble average currents was fitted to a biexponential function. The fast (solid symbols) and slow (open symbols) time constants for R1648H (▪, □; n ≥ 6 for all voltages) and R1657C (▴, ▵; n ≥ 8 for −30 to 0 mV, n = 3 for +10 mV) determined from ensemble average currents are plotted as a function of voltage. The time constants calculated for WT-SCN1A channels (Fig. 1C) are shown for comparison (dotted line). (D) Single-channel amplitudes obtained for R1648H (□, n ≥ 5 for all voltages), R1657C (▵, n ≥ 4 for all voltages) and for channel amplitudes measured >100 ms after depolarization for R1648H (▿, n ≥ 4 for all voltages) channels are plotted as a function of voltage. The single-channel conductances were determined by fitting the data to a linear relationship in the voltage range −30 to +10 mV. The single-channel conductance calculated for wild-type SCN1A channels (Fig. 3C) is shown for comparison (dotted line).
Single-channel amplitudes for both mutants were measured by fitting all-points amplitude histograms with Gaussian curves. Fig. 6 D shows the single-channel currents for R1648H and R1657C channels plotted against the test potential and the slope conductance obtained by linear regression. The calculated slope conductances for the mutants are 16.9 ± 0.9 pS (n = 7) for R1648H and 16.8 ± 1.0 pS (n = 6) for R1657C in the −30 to +10 mV range. These results indicate that neither mutation affects the single-channel conductance of SCN1A. The reduction in R1657C whole-cell current density can hence only result from a decrease in open probability, the number of functional channels at the plasma membrane, or both. We also calculated the single-channel conductance for R1648H channel openings measured ≥100 ms after the depolarization onset and found that this value is indistinguishable from that calculated for the first 10 ms (16.2 ± 0.3 pS, n = 6; Fig. 6 D). This result suggests that both the transient and persistent current observed in whole-cell recordings from R1648H-expressing cells are carried by the same channels.
R1648H Persistent Current Is Caused by Late Channel Reopenings
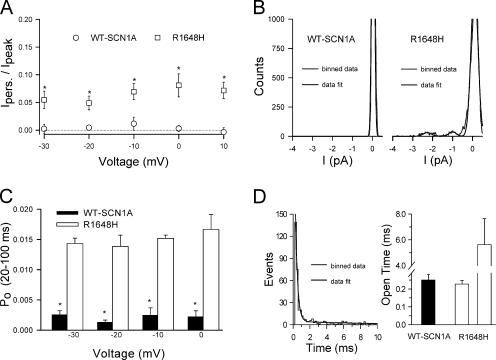
We previously demonstrated a persistent noninactivating current carried by R1648H in excised outside-out patch recordings at one test potential (Lossin et al., 2002). In this study we measured the persistent (40 ms post pulse) and peak ensemble-average currents in the −30 to +10 mV range. Fig. 7 A illustrates the ratio of persistent to peak current observed for WT-SCN1A and R1648H channels. The persistent current in R1648H patches was 5–7% of the peak current and exhibited a slight voltage dependence between −30 and +10 mV range. In the same voltage range, the persistent/peak ratios obtained for WT-SCN1A channels were negligible.
Figure 7.
Comparison of WT-SCN1A and R1648H channels. (A) Ratio of persistent to peak sodium current (Ipers/Ipeak) from outside-out patches expressing either WT-SCN1A (○, n = 12) or R1648H (□, n ≥ 6 for all voltages) and plotted as a function of voltage. (B) All-points histograms obtained between 30 and 40 ms after depolarization onset from outside-out patches expressing WT-SCN1A or R1648H (both patches contain three channels). (C) Open probabilities (P o) calculated from outside-out patches expressing WT-SCN1A (filled bars, n ≥ 3) or R1648H (open bars, n ≥ 3 for all voltages) 20–100 ms after depolarizing the patch from −100 mV to the indicated potential. (D) Open time histogram obtained at 0 mV from an outside-out patch excised from a R1648H-expressing cell (left). Channel openings were recorded during the first 20 ms following membrane depolarization. Unlike WT-SCN1A, the histogram was best fitted by a two-exponential function (black line). The right panel depicts open times calculated for WT-SCN1A (solid bar, n = 4) and R1648H (open bars, n = 5) channels at 0 mV.
Fig. 7 B shows all-point amplitude histograms from excised outside-out patches expressing either WT-SCN1A (left) or R1648H (right) obtained between 30 and 40 ms after depolarization to 0 mV. The wild-type channels did not exhibit openings during this time window. By contrast, R1648H channels exhibit significant channel openings well beyond the time when WT-SCN1A patches become quiescent. Our data also indicate that R1648H channel reopening was voltage independent. Fig. 7 C shows the calculated open probability for WT-SCN1A and R1648H channels 20–100 ms after activation of the channels from a holding potential of −100 mV. In these experiments, Po was calculated by integrating the current in each record and dividing it by the single-channel amplitude, the number of channels in the patch, and the length of the interval, 80 ms. Throughout the tested voltage range (−30 to +10 mV), the estimated P o for R1648H channels was ∼0.015. At the same voltage range, WT-SCN1A channels could open (see Fig. 3) albeit with much lower P o (∼0.002).
We also compared the open-time distribution of R1648H channels and WT-SCN1A channels. Open-time histograms were constructed with data obtained at 0 mV during the 20-ms period immediately following channel activation (Fig. 7 D, left). Unlike the WT-SCN1A plots, R1648H histograms were better fit by double exponential functions (Fig. 7 D). Two open times were calculated (0.23 ± 0.02, 5.63 ± 2.02, n = 5; Fig. 7 D, right). The smaller open time was undistinguishable from the single open time observed for WT-SCN1A (0.25 ± 0.03, n = 4; Fig. 7 D). Approximately 80% (81.5 ± 4.2%) of R1648H channel openings were characterized by having the smaller open time. These data indicate that the R1648H mutation causes channel reopening with a low but significant open probability, and the appearance of a second, less frequent, longer open time.
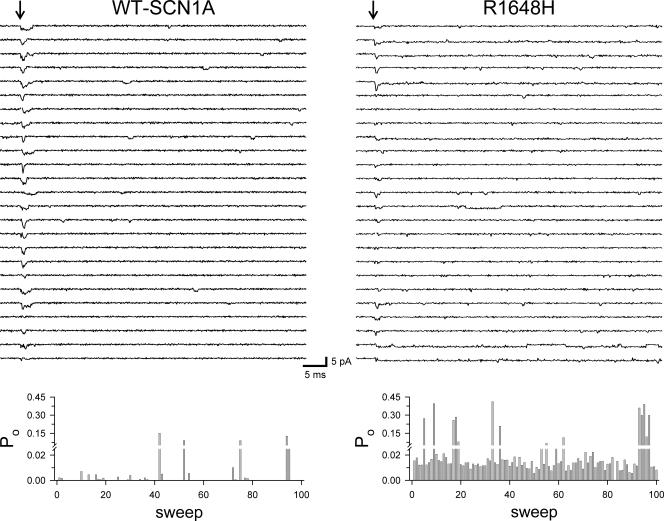
Conceivably, the R1648H mutation could induce channels to more readily enter a slower gating mode. Fig. 8 illustrates single-channel recordings and open probability dairies for WT-SCN1A and R1648H channels activated at 0 mV from a holding potential of −100 mV. Wild-type channels exhibit occasional periods of increased P o possibly consistent with infrequent shifts to a slower gating mode. The data also indicate that R1648H channels have a much higher basal P o but are not clustered in a manner suggesting gating mode shifts that differ from WT-SCN1A.
Figure 8.
Diary of single-channel activity. Top panels display 25 out of 100 sweeps (every fourth trace selected for display) for WT-SCN1A (left) and R1648H (right) activated to 0 mV from a holding potential of −100 mV. The bottom panels illustrate the P o determined during each 80-ms depolarization for WT-SCN1A (left) and R1648H (right) from the patches shown in the top panels. Diaries were generated by integrating the current in each record and dividing it by the single-channel amplitude, the number of channels in the patch and the length of the record.
R1657C Reduces Functional Channel Number
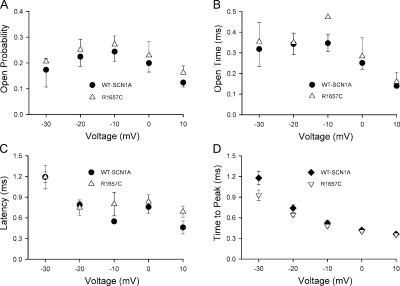
The substitution of arginine 1657 by cysteine causes ∼50% reduction in current density when compared with WT-SCN1A (Lossin et al., 2003). Whole-cell current is the product of the number of functional channels in the plasma membrane, the single-channel current, and the channel open probability. To determine which of these variables is affected by the R1657C mutation, we performed single-channel analysis of this mutant allele. As discussed above, the single-channel conductance of R1657C (16.8 ± 1.0, n = 6) is not statistically different from that of the wild-type channel (17.2 ± 0.5, n = 10). Therefore, either the number of functional channels in the plasma membrane or the channel open probability must be affected by this mutation. To differentiate between these possibilities, we compared the peak open probability, mean open time, and latency to first opening between WT-SCN1A and R1657C channels. Fig. 9 illustrates the peak open probability and open times for WT-SCN1A and the R1657C channels. Peak Po was obtained by dividing the peak current obtained from ensemble-average currents and divided by the single-channel amplitude and number of channels in the patch. In the voltage range tested (−30 to +10 mV), both properties are indistinguishable between the two alleles. We also analyzed latency to first channel opening using cumulative histograms. The calculated latencies for the voltage range −30 to +10 mV are plotted in Fig. 9 C. Again, no significant differences were observed between WT-SCN1A and R1657C channels. A similar result was obtained when comparing time to peak whole-cell current plot (Fig. 9 D) recorded from cells expressing WT-SCN1A or R1657C activated from a holding potential of −100 mV. Collectively, these results implicate a decrease in the number of functional channels at the plasma membrane as the most plausible explanation for the reduced whole-cell current observed in R1657C-expressing cells.
Figure 9.
Comparison of WT-SCN1A and R1657C. (A) Voltage dependence of peak P o obtained for WT-SCN1A (•) and R1657C (▵) in the −30 to +10 mV voltage range. (B) Mean open times calculated for WT-SCN1A (•) and R1657C (▵) channels plotted as a function of voltage. (C) Mean first latency of WT-SCN1A (•) and R1657C (▵) channels in the −30 to +10 mV voltage range plotted against test potentials. For WT-SCN1A n ≥ 3 for all voltages, and R1657C n ≥ 3 for −30 to 0 mV, n = 2 for +10 mV. (D) Time to peak whole-cell current measured from tsA201 cells transiently expressing WT-SCN1A (♦, n = 10) or R1657C (▿, n = 6) plotted against test potentials.
DISCUSSION
In this study, we characterized the single-channel behavior of WT-SCN1A and two mutant SCN1A channels to deepen our understanding of the abnormal biophysical properties associated with inherited epilepsy syndromes. Specifically, we focused on two GEFS+-associated alleles, R1648H and R1657C, that affect residues within the D4/S4 segment yet exhibit distinct functional derangements (Lossin et al., 2002, 2003). Previously, we revealed a complex relationship between genotype and phenotype among SCN1A-linked epilepsy syndromes through characterization of whole-cell currents exhibited by heterologously expressed mutants. Further dissection of biophysical phenotypes, particularly at the single-channel level, of disease-producing mutants represents an important next step in advancing our understanding of neuronal sodium channel disorders.
Single-channel Properties of WT-SCN1A
The single-channel behavior of heterologously expressed WT-SCN1A resembles native mammalian neuronal sodium channels in many respects. The calculated slope conductance of recombinant WT-SCN1A is 17 pS, well within the range of previously reported values (16–20 pS) recorded from rat (Barres et al., 1989; Alzheimer et al., 1993; Baker and Bostock, 1998; Fernandes et al., 2001) and human (Frenkel et al., 1998) neurons. The observed mean open time exhibited by the heterologously expressed channel was voltage independent within the −30 to −10 mV range and decreased at more depolarized potentials very similar to native sodium channels observed in rat retinal ganglion and cortical motor neurons (Barres et al., 1989). Similarities between recombinant SCN1A and native neuronal sodium channels also exist in the voltage dependence of channel latency. The first latency observed for WT-SCN1A decreased ∼50% from −30 to −10 mV, quite similar to the behavior of rat neuronal sodium channels (Barres et al., 1989). By contrast, mean open time was observed to increase with depolarizing potentials in rat hippocampal CA1 neurons (Fernandes et al., 2001). This discrepancy might be explained by the spatial pattern of sodium channel isoforms in the mammalian brain. Immunohistochemical analysis of human brain has previously demonstrated that SCN1A (NaV1.1) is expressed primarily in neuronal cell bodies and proximal processes in many brain regions (Whitaker et al., 2000), but is expressed less than other neuronal sodium channel types in some areas. Furthermore, in rat hippocampus, NaV1.2 is expressed at a substantially higher rate than NaV1.1 (Gordon et al., 1987) while NaV1.1 is expressed at higher levels than NaV1.2 in rat cortex (Klein et al., 2004).
Distinct Properties of GEFS+-associated SCN1A Mutants
Previous analysis at the whole-cell level showed that the most prominent effects on SCN1A function by the R1648H and R1657C mutations were persistent sodium current and reduced current density, respectively (Lossin et al., 2002, 2003). The R1648H mutation affects a positive residue in the middle of D4/S4, while R1657C affects the innermost positive residue in this voltage-sensing segment. Neither mutation affects the single-channel conductance, the rate of ensemble average current decay, and the voltage at which peak current is measured.
The R1657C mutation causes ∼50% reduction in current density. Our present results show that the substitution of arginine 1657 by cysteine does not affect single-channel conductance, peak open probability, mean open time, or channel latency. Thus, the reduced whole-cell current is most likely due to a lower number of functional channels at the plasma membrane, possibly by defective protein trafficking. It is less likely that reduced channel number reflects lower translation efficiency due to rare codon usage because in humans the two cysteine codons are observed with equal frequency (Nakamura et al., 2000). Interestingly, another SMEI-associated mutation, F1661S, causes an amino acid substitution four residues COOH terminal to R1657C and an ∼50% reduction in current density (Rhodes et al., 2004). Single-channel analysis of this mutant, in combination with biochemical experiments for both SCN1A mutants, will help clarify whether the mechanism for lower current density represents a trafficking defect.
Ensemble-average recordings from outside-out patches expressing R1648H channels display a persistent current that is voltage independent in the −30 to +10 mV range. This persistent current is due to reopening of R1648H channels late in the test pulse at a time long after wild-type channels are typically inactivated. The single-channel conductance for R1648H late openings (<100 ms after depolarization onset) was the same as that determined for openings occurring during the first 10 ms. Furthermore, we never observed patches with only late openings. These observations indicate that the persistent current is carried by mutant SCN1A channels with defective inactivation and not by a distinct subset of noninactivating channels.
Significance of Persistent Sodium Current
Persistent sodium current has been described in cells isolated from normal heart (e.g., Nilius, 1988), brain (e.g., Alzheimer et al., 1993; Magistretti and Alonso, 2002), and muscle (e.g., Patlak and Ortiz, 1986). Under physiological conditions, the persistent sodium current serves to amplify or spatially integrate synaptic potentials, and allows excitable cells to generate subthreshold oscillations or reduce the threshold for repetitive action potential firing (Crill, 1996; Taylor, 1993). Increased levels of persistent current have also been associated with certain human channelopathies. In familial hyperkalemic periodic paralysis (HYPP), mutations in SCN4A encoding the human skeletal muscle sodium channel α-subunit (hNaV1.4) cause impairments in fast inactivation, leading to increased persistent current (Cannon and Strittmatter, 1993; Cummins et al., 1993; Yang et al., 1994). Similarly, mutations that disrupt inactivation of the cardiac sodium channel cause increased persistent current and the congenital long QT syndrome (Bennett et al., 1995; Dumaine et al., 1996; Makita et al., 1998). In epilepsy, certain SCN1A mutations promote increased persistent current, and this phenomenon likely contributes directly to epileptiform activity in the brain. Consistent with this idea, persistent current underlies the epileptic activity in a cultured neuronal system (Segal, 1994; Segal and Douglas, 1997) and is effectively suppressed by the anticonvulsant drug phenytoin (Segal and Douglas, 1997). It is clear from these observations that increased persistent sodium current can be pathological in different cell types.
Biophysical Mechanism of Persistent Sodium Current for SCN1A-R1648H
Single-channel analyses of native and heterologously expressed sodium channels exhibiting persistent current have in some cases revealed enhanced entry of channels into a noninactivating gating mode. For example, this “modal gating” model for dysfunctional sodium channels in long QT syndrome predicts that individual channels will exhibit normal gating behavior most of the time but have paroxysms of noninactivating channel activity.
Does a modal gating model explain increased persistent current exhibited by R1648H? Experiments with a recently developed computational model of SCN1A behavior based upon a Markovian gating scheme proposed a gating mode shift to explain persistent current in the R1648H mutant (Clancy and Kass, 2004). This work was based in part on our preliminary description of single-channel behavior of R1648H from multichannel patches (at least 10 channels per patch) (Vanoye et al., 2003). Our new results were obtained from patches containing ≤5 channels and suggest that R1648H reopenings are not clustered in a manner consistent with gating mode shifts that differ from WT-SCN1A. This implies that a biophysical mechanism that fundamentally impairs all modes of fast inactivation is a more likely explanation for our findings.
Channel reopenings in the absence of modal gating have been observed also for certain SCN4A mutants. The expression of SCN4A mutants R1448H and R1448C in tsA201 cells showed channel reopenings without a clustering of events in time (Chahine et al., 1994). These mutant SCN4A channels also exhibited increased mean open time similar to what we observed for SCN1A-R1648H. Persistent current in the absence of modal gating has also been observed in cultured muscle cells obtained from subjects with paramyotonia congenita caused by the SCN4A-T1313M mutation (Boulos et al., 2000). These observations indicate collectively that there are multiple biophysical mechanisms capable of generating increased persistent sodium current.
The D4/S4 segment has previously been demonstrated to participate in the coupling of channel activation to inactivation (Chahine et al., 1994; O'Leary et al., 1995; Chen et al., 1996; Kontis and Goldin, 1997), and therefore, we can speculate that impaired inactivation observed for R1648H could be a manifestation of disturbed activation–inactivation coupling. Interestingly, this effect occurs in the absence of altered fast inactivation time constants or differences in the voltage dependence of activation or inactivation. Another possibility to explain this gating defect is destabilization of the inactivated state with a resulting greater propensity to recover and reactivate.
Residue charge alone may not explain the observed effects of R1648H on SCN1A function. Recent experiments from our laboratory designed to impart a positive charge to the substituted histidine by lowering the intracellular pH did not affect the persistent current caused by the R1648H mutation (Rhodes et al., 2004). Similarly, in experiments performed with rat brain IIA (NaV1.2) channels, the identical substitution to SCN1A R1648H (designated R5H) slowed the time course of inactivation and caused a depolarizing shift in steady-state inactivation, but did not cause a persistent current (Kühn and Greeff, 1999). Side chain size may also influence the substitution effect. The substitution of R1648 by cysteine causes an increase in the rate of inactivation and a depolarizing shift in the voltage dependence of inactivation, in addition to a larger noninactivating current (Rhodes et al., 2004). The different effects observed when arginine is substituted by either cysteine or histidine could be due to the bulkier histidine chain altering the local structure and affecting protein interactions and channel function. Results with NaV1.4 expressed in Xenopus oocytes suggest that the effects on channel behavior by the central charges in D4/S4 occur by allosteric interactions (Groome et al., 2002). And experiments with voltage-gated K+ channels show that there are electrostatic and structural interactions between the positively charged residues of the central to innermost section in S4 and the negatively charged residues in S2 (Papazian et al., 1995). Further detailed single-channel analysis of SCN1A R1648 cysteine mutant, and novel mutations where the residue charge is neutralized independently of intracellular pH (e.g., glutamine) or by charge substitution with a less bulky side chain (e.g., lysine), may provide a better understanding of the functional role of this residue in SCN1A and other voltage-gated Na+ channels.
Summary
In this study we provide the most comprehensive single-channel study of WT-SCN1A and two GEFS+-associated mutants reported to date. Our observations provide further clarity regarding the biophysical mechanism underlying the abnormal persistent sodium current caused by the mutants, including demonstration that enhanced modal gating is not responsible for the increased persistent sodium current exhibited by R1648H. This work will serve as the basis for understanding sodium channel dysfunction in epilepsy and aid in the development of advanced computational models to explain the underlying defect in neuronal excitability that promotes seizures.
Acknowledgments
We are grateful to Dr. R. Horn for critical review of the manuscript and for providing valuable guidance.
This work was supported by grants NS32387 (A.L. George) and DK061359 (C.G. Vanoye) from the National Institutes of Health.
Olaf S. Andersen served as editor.
Abbreviations in this paper: GEFS+, generalized epilepsy with febrile seizures plus; SMEI, severe myoclonic epilepsy of infancy; WT, wild type.
References
- Alzheimer, C., P.C. Schwindt, and W.E. Crill. 1993. Modal gating of Na+ channels as a mechanism of persistent Na+ current in pyramidal neurons from rat and cat sensorimotor cortex. J. Neurosci. 13:660–673. [DOI] [PMC free article] [PubMed] [Google Scholar]
- Baker, M.D., and H. Bostock. 1998. Inactivation of macroscopic late Na+ current and characteristics of unitary late Na+ currents in sensory neurons. J. Neurophysiol. 80:2538–2549. [DOI] [PubMed] [Google Scholar]
- Barres, B.A., L.L.Y. Chun, and D.P. Corey. 1989. Glial and neuronal forms of the voltage-dependent sodium channel: characteristics and cell-type distribution. Neuron. 2:1375–1388. [DOI] [PubMed] [Google Scholar]
- Bennett, P.B., K. Yazawa, N. Makita, and A.L. George Jr. 1995. Molecular mechanism for an inherited cardiac arrhythmia. Nature. 376:683–685. [DOI] [PubMed] [Google Scholar]
- Boulos, P.T., T.D. Heiman-Patterson, G.M. Alexander, and A.J. Tahmoush. 2000. Patch clamp studies of the thr1313met mutant sodium channel causing paramyotonia congenita. Muscle Nerve. 23:1736–1747. [DOI] [PubMed] [Google Scholar]
- Cannon, S.C., and S.M. Strittmatter. 1993. Functional expression of sodium channel mutations identified in families with periodic paralysis. Neuron. 10:317–326. [DOI] [PubMed] [Google Scholar]
- Chahine, M., A.L. George Jr., M. Zhou, S. Ji, W. Sun, R.L. Barchi, and R. Horn. 1994. Sodium channel mutations in paramyotonia congenita uncouple inactivation from activation. Neuron. 12:281–294. [DOI] [PubMed] [Google Scholar]
- Chen, L.-Q., V. Santarelli, R. Horn, and R.G. Kallen. 1996. A unique role for the S4 segment of domain 4 in the inactivation of sodium channels. J. Gen. Physiol. 108:549–556. [DOI] [PMC free article] [PubMed] [Google Scholar]
- Claes, L., J. Del Favero, B. Ceulemans, L. Lagae, C. Van Broeckhoven, and P. De Jonghe. 2001. De novo mutations in the sodium-channel gene SCN1A cause severe myoclonic epilepsy of infancy. Am. J. Hum. Genet. 68:1327–1332. [DOI] [PMC free article] [PubMed] [Google Scholar]
- Clancy, C.E., and R.S. Kass. 2004. Theoretical investigation of the neuronal Na+ channel SCN1A: abnormal gating and epilepsy. Biophys. J. 86:2606–2614. [DOI] [PMC free article] [PubMed] [Google Scholar]
- Crill, W.E. 1996. Persistent sodium current in mammalian central neurons. Annu. Rev. Physiol. 58:349–362. [DOI] [PubMed] [Google Scholar]
- Cummins, T.R., J. Zhou, F.J. Sigworth, C. Ukomadu, M. Stephan, L.J. Ptacek, and W.S. Agnew. 1993. Functional consequences of a Na+ channel mutation causing hyperkalemic periodic paralysis. Neuron. 10:667–678. [DOI] [PubMed] [Google Scholar]
- Dumaine, R., Q. Wang, M.T. Keating, H.A. Hartmann, P.J. Schwartz, A.M. Brown, and G.E. Kirsch. 1996. Multiple mechanisms of Na+ channel-linked long-QT syndrome. Circ. Res. 78:916–924. [DOI] [PubMed] [Google Scholar]
- Escayg, A., B.T. MacDonald, M.H. Meisler, S. Baulac, G. Huberfeld, I. An-Gourfinkel, A. Brice, E. LeGuern, B. Moulard, D. Chaigne, et al. 2000. Mutations of SCN1A, encoding a neuronal sodium channel, in two families with GEFS+2. Nat. Genet. 24:343–345. [DOI] [PubMed] [Google Scholar]
- Fernandes, J., P. Marvão, A.I. Santos, and P.F. Costa. 2001. Sodium channel currents in maturing acutely isolated rat hippocampal CA1 neurones. Dev. Brain Res. 132:159–174. [DOI] [PubMed] [Google Scholar]
- Fernandez, J.M., A.P. Fox, and S. Krasne. 1984. Membrane patches and whole-cell membranes. A comparison of electrical-properties in rat clonal pituitary (GH3) cells. J. Physiol. 356:565–585. [DOI] [PMC free article] [PubMed] [Google Scholar]
- Frenkel, C., H.C. Wartenberg, D.S. Duch, and B.W. Urban. 1998. Steady-state properties of sodium channels from healthy and tumorous human brain. Brain Res. Mol. Brain Res. 59:22–34. [DOI] [PubMed] [Google Scholar]
- Fujiwara, T., T. Sugawara, E. Mazaki-Miyazaki, Y. Takahashi, K. Fukushima, M. Watanabe, K. Hara, T. Morikawa, K. Yagi, K. Yamakawa, and Y. Inoue. 2003. Mutations of sodium channel α subunit type 1 (SCN1A) in intractable childhood epilepsies with frequent generalized tonic-clonic seizures. Brain. 126:531–546. [DOI] [PubMed] [Google Scholar]
- Gellens, M.E., A.L. George, L. Chen, M. Chahine, R. Horn, R.L. Barchi, and R.G. Kallen. 1992. Primary structure and functional expression of the human cardiac tetrodotoxin-insensitive voltage-dependent sodium channel. Proc. Natl. Acad. Sci. USA. 89:554–558. [DOI] [PMC free article] [PubMed] [Google Scholar]
- George, A.L., Jr. 2005. Inherited disorders of voltage-gated sodium channels. J. Clin. Invest. 115:1990–1999. [DOI] [PMC free article] [PubMed] [Google Scholar]
- Gordon, D., D. Merrick, V. Auld, R. Dunn, A.L. Goldin, N. Davidson, and W.A. Catterall. 1987. Tissue-specific expression of the RI and RII sodium-channel subtypes. Proc. Natl. Acad. Sci. USA. 84:8682–8686. [DOI] [PMC free article] [PubMed] [Google Scholar]
- Groome, J., E. Fujimoto, L. Walter, and P. Ruben. 2002. Outer and central charged residues in DIVS4 of skeletal muscle sodium channels have differing roles in deactivation. Biophys. J. 82:1293–1307. [DOI] [PMC free article] [PubMed] [Google Scholar]
- Hamill, O.P., A. Marty, E. Neher, B. Sakmann, and F.J. Sigworth. 1981. Improved patch-clamp techniques for high-resolution current recording from cells and cell-free membrane patches. Pflugers Arch. 391:85–100. [DOI] [PubMed] [Google Scholar]
- Heron, S.E., K.M. Crossland, E. Andermann, H.A. Phillips, A.J. Hall, A. Bleasel, M. Shevell, S. Mercho, M.H. Seni, M.C. Guiot, et al. 2002. Sodium-channel defects in benign familial neonatal-infantile seizures. Lancet. 360:851–852. [DOI] [PubMed] [Google Scholar]
- Kimitsuki, T., T. Mitsuiye, and A. Noma. 1990. Negative shift of cardiac Na+ channel kinetics in cell-attached patch recordings. Am. J. Physiol. 258:H247–H254. [DOI] [PubMed] [Google Scholar]
- Klein, J.P., D.S. Khera, H. Nersesyan, E.Y. Kimchi, S.G. Waxman, and H. Blumenfeld. 2004. Dysregulation of sodium channel expression in cortical neurons in a rodent model of absence epilepsy. Brain Res. 1000:102–109. [DOI] [PubMed] [Google Scholar]
- Kontis, K.J., and A.L. Goldin. 1997. Sodium channel inactivation is altered by substitution of voltage sensor positive charges. J. Gen. Physiol. 110:403–413. [DOI] [PMC free article] [PubMed] [Google Scholar]
- Kühn, F.J.P., and N.G. Greeff. 1999. Movement of voltage sensor S4 in domain 4 is tightly coupled to sodium channel fast inactivation and gating charge immobilization. J. Gen. Physiol. 114:167–183. [DOI] [PMC free article] [PubMed] [Google Scholar]
- Lossin, C., T.H. Rhodes, R.R. Desai, C.G. Vanoye, D. Wang, S. Carniciu, O. Devinsky, and A.L. George Jr. 2003. Epilepsy-associated dysfunction in the voltage-gated neuronal sodium channel SCN1A. J. Neurosci. 23:11289–11295. [DOI] [PMC free article] [PubMed] [Google Scholar]
- Lossin, C., D.W. Wang, T.H. Rhodes, C.G. Vanoye, and A.L. George Jr. 2002. Molecular basis of an inherited epilepsy. Neuron. 34:877–884. [DOI] [PubMed] [Google Scholar]
- Magistretti, J., and A. Alonso. 2002. Fine gating properties of channels responsible for persistent sodium current generation in entorhinal cortex neurons. J. Gen. Physiol. 120:855–873. [DOI] [PMC free article] [PubMed] [Google Scholar]
- Makita, N., N. Shirai, M. Nagashima, R. Matsuoka, Y. Yamada, N. Tohse, and A. Kitabatake. 1998. A de novo missense mutation of human cardiac Na+ channel exhibiting novel molecular mechanisms of long QT syndrome. FEBS Lett. 423:5–9. [DOI] [PubMed] [Google Scholar]
- Moorman, J.R., G.E. Kirsch, A.M.J. VanDongen, R.H. Joho, and A.M. Brown. 1990. Fast and slow gating of sodium channels encoded by a single mRNA. Neuron. 4:243–252. [DOI] [PubMed] [Google Scholar]
- Nakamura, Y., T. Gojobori, and T. Ikemura. 2000. Codon usage tabulated from international DNA sequence databases: status for the year 2000. Nucleic Acids Res. 28:292. [DOI] [PMC free article] [PubMed] [Google Scholar]
- Nilius, B. 1988. Modal gating behavior of cardiac sodium channels in cell-free membrane patches. Biophys. J. 53:857–862. [DOI] [PMC free article] [PubMed] [Google Scholar]
- O'Leary, M.E., L.Q. Chen, R.G. Kallen, and R. Horn. 1995. A molecular link between activation and inactivation of sodium channels. J. Gen. Physiol. 106:641–658. [DOI] [PMC free article] [PubMed] [Google Scholar]
- Papazian, D.M., X.M. Shao, S.A. Seoh, A.F. Mock, Y. Huang, and D.H. Wainstock. 1995. Electrostatic interactions of S4 voltage sensor in shaker K+ channel. Neuron. 14:1293–1301. [DOI] [PubMed] [Google Scholar]
- Patlak, J.B., and M. Ortiz. 1986. Two modes of gating during late Na+ channel currents in frog sartorius muscle. J. Gen. Physiol. 87:305–326. [DOI] [PMC free article] [PubMed] [Google Scholar]
- Rhodes, T.H., C. Lossin, C.G. Vanoye, D.W. Wang, and A.L. George Jr. 2004. Noninactivating voltage-gated sodium channels in severe myoclonic epilepsy of infancy. Proc. Natl. Acad. Sci. USA. 101:11147–11152. [DOI] [PMC free article] [PubMed] [Google Scholar]
- Segal, M.M. 1994. Endogenous bursts underlie seizurelike activity in solitary excitatory hippocampal neurons in microcultures. J. Neurophysiol. 72:1874–1884. [DOI] [PubMed] [Google Scholar]
- Segal, M.M., and A.F. Douglas. 1997. Late sodium channel openings underlying epileptiform activity are preferentially diminished by the anticonvulsant phenytoin. J. Neurophysiol. 77:3021–3034. [DOI] [PubMed] [Google Scholar]
- Spampanato, J., A. Escayg, M.H. Meisler, and A.L. Goldin. 2001. Functional effects of two voltage-gated sodium channel mutations that cause generalized epilepsy with febrile seizures plus type 2. J. Neurosci. 21:7481–7490. [DOI] [PMC free article] [PubMed] [Google Scholar]
- Spampanato, J., J.A. Kearney, G. de Haan, D.P. McEwen, A. Escayg, I. Aradi, B.T. MacDonald, S.I. Levin, I. Soltesz, P. Benna, et al. 2004. A novel epilepsy mutation in the sodium channel SCN1A identifies a cytoplasmic domain for β subunit interaction. J. Neurosci. 24:10022–10034. [DOI] [PMC free article] [PubMed] [Google Scholar]
- Stühmer, W., C. Methfessel, B. Sakmann, M. Noda, and S. Numa. 1987. Patch clamp characterization of sodium channels expressed from rat brain cDNA. Eur. Biophys. J. 14:131–138. [DOI] [PubMed] [Google Scholar]
- Sugawara, T., Y. Tsurubuchi, K.L. Agarwala, M. Ito, G. Fukuma, E. Mazaki-Miyazaki, H. Nagafuji, M. Noda, K. Imoto, K. Wada, et al. 2001. A missense mutation of the Na+ channel aII subunit gene NaV1.2 in a patient with febrile and afebrile seizures causes channel dysfunction. Proc. Natl. Acad. Sci. USA. 98:6384–6389. [DOI] [PMC free article] [PubMed] [Google Scholar]
- Taylor, C.P. 1993. Na+ currents that fail to inactivate. Trends Neurosci. 16:455–460. [DOI] [PubMed] [Google Scholar]
- Ukomadu, C., J. Zhou, F.J. Sigworth, and W.S. Agnew. 1992. μI Na+ channels expressed transiently in human embryonic kidney cells: biochemical and biophysical properties. Neuron. 8:663–676. [DOI] [PubMed] [Google Scholar]
- Vanoye, C.G., C. Lossin, and A.L. George. 2003. Single-channel analysis of the human sodium channel SCN1A. Biophys. J. 84:68A (Abstr. [Google Scholar]
- Wallace, R.H., D.W. Wang, R. Singh, I.E. Scheffer, A.L. George Jr., H.A. Phillips, K. Saar, A. Reis, E.W. Johnson, G.R. Sutherland, et al. 1998. Febrile seizures and generalized epilepsy associated with a mutation in the Na+-channel b1 subunit gene SCN1B. Nat. Genet. 19:366–370. [DOI] [PubMed] [Google Scholar]
- Whitaker, W.R., J.J. Clare, A.J. Powell, Y.H. Chen, R.L. Faull, and P.C. Emson. 2000. Distribution of voltage-gated sodium channel α-subunit and β-subunit mRNAs in human hippocampal formation, cortex, and cerebellum. J. Comp. Neurol. 422:123–139. [DOI] [PubMed] [Google Scholar]
- Yang, N., S. Ji, M. Zhou, L.J. Ptacek, R.L. Barchi, R. Horn, and A.L. George Jr. 1994. Sodium channel mutations in paramyotonia congenita exhibit similar biophysical phenotypes in vitro. Proc. Natl. Acad. Sci. USA. 91:12785–12789. [DOI] [PMC free article] [PubMed] [Google Scholar]


