Volume 125, No. 6, June 2006. Pages 641–660.
An arithmetic error in the above article was kindly pointed out to us, and here we endeavor to correct the mistake. We characterized the fluctuation (noise) in outer segment membrane current in isolated cone photoreceptors in complete darkness, and we developed a theory to explain the experimental features of the dark noise. The theory posits that in the absence of cytoplasmic Ca2+ fluctuations, dark current noise arises from fluctuations of cytoplasmic cGMP concentration caused by variation in the mean activity of phosphodiesterase (PDE), the enzyme that catalyzes cGMP hydrolysis.
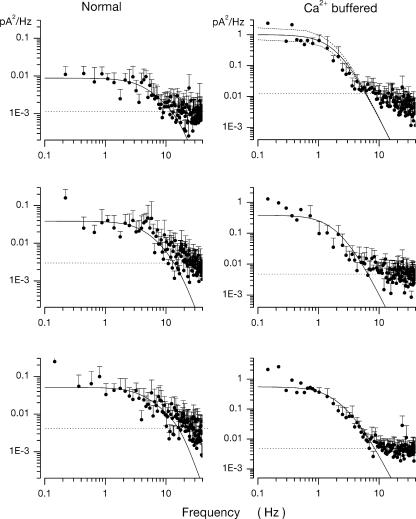
The theory anticipates that the power spectrum of dark noise (pA2/Hz) in BAPTA-loaded cones should be described by the product of two Lorentzian functions, each of characteristic frequency ω1 (Hz) and ω2 (Hz). The numerical values of ω1 and ω2 are defined by the kinetics of dark PDE thermal activation and inactivation. We found dark noise power spectrum is, indeed, described by the product of two Lorentzians, but more than one combination of ω1 and ω2 can achieve successful fit between theory and experiments. We arrived at specific values for the characteristic frequencies through a combination of experimental observations and curve fitting. The value of ω2 was determined from experimental assessment of the rate of cGMP hydrolysis in the dark (βdark = 0.25 s−1). Under this constraint, the value of ω1 was computed by fitting the theoretical function to the observed noise power spectra. In this computation, we should have set ω2 = 2πβdark = 1.57 Hz. In error, the term 2π was neglected and assigned ω2 ≡ 0.25 Hz (p. 651). We have recomputed the fit between experimental and theoretical data (new Fig. 6) with the corrected ω2 value and have arrived at a corrected ω1 = 5.3 ± 1.9 Hz (±SD, n = 11). The kinetic rates of dark PDE activation and inactivation, calculated from the corrected ω1 and ω2 values are listed in a new Table II and compared with dark PDE kinetics in rods.
Figure 6.
Dark noise power spectra measured in different bass cones. Experimental data are symbols and the continuous line is an optimally fit theoretical function based on a model of the molecular origin of the dark noise. On the left are data measured in normal cells. On the right are data measured in cones loaded with 10 mM BAPTA at 400 nM free Ca2+. The top panel on the right illustrates both the optimally fit theoretical function and confidence limits if the value of the single adjustable parameter, ω1, were 20% larger or smaller than that optimized by the fitting algorithm.
Table II.
Kinetics of PDE Activation and Inactivation in Retinal Photoreceptors
| βdark |

|
N 0 |
 /N
0 /N
0
|
ka | τ−1 | τ | |
|---|---|---|---|---|---|---|---|
| s−1 | s−1 | s−1 | s | ||||
| Bass cone | 0.24 | 60 | 3 × 10⁶ | 1/5 × 104 | 0.17 × 10⁻⁴ | 0.84 | 1.19 |
| Rod | 1–2a b | 487 | 2 × 10⁷ | 1/4 × 104 | 0.27 × 10⁻⁴ b | 1.8 b | 0.55 |
 , number of active PDE molecules in the dark; N
0, total number of PDE molecules in the outer segment (1/70 PDE/VP, Zhang et al., 2003); ka, PDE forward activation rate; τ−1, PDE backward activation rate
  active PDE lifetime.
Hodgkin and Nunn (1988) and Nikonov et al. (2000), in tiger salamander retina.
Rieke and Baylor (1996), in toad retina.
The theoretical model also allowed us to anticipate dark noise in normal cells, one that reflects fluctuations in both cGMP and cytoplasmic Ca2+. The fit between experimental and theoretical data in normal cells (new Fig. 6 on the following page) using the corrected values of ω1 and ω2 indicates the Ca2+ clearance rate from the bass single cone outer segment has a time constant of 44 ± 9 ms (n = 10), not very different from the value in the original article. This fact reveals, simply, that in intact cells cytoplasmic Ca2+ fluctuations are dominant contributors to current noise.
The values listed in the new Table II reveal that dark PDE activity appears not to be remarkably different in rods and cones, contrary to our previous conclusion. The assumption we made in DISCUSSION that the rate of PDE inactivation in cones is the same in darkness and in light is incorrect. Our suggestion that the inactivation rate of light-activated PDE is much faster in cones (mean lifetime 55 ms) than in rods stands because it is based on a model that simulates the kinetics of the photocurrent in the two photoreceptor types.


