Abstract
Cyclic nucleotide-gated (CNG) channels play a critical role in olfactory and visual transduction. Site-directed mutagenesis and inside-out patch-clamp recordings were used to investigate ion permeation and selectivity in two mutant homomeric rat olfactory CNGA2 channels expressed in HEK293 cells. A single point mutation of the negatively charged pore loop (P-loop) glutamate (E342) to either a positively charged lysine or arginine resulted in functional channels, which consistently responded to cGMP, although the currents were generally extremely small. The concentration–response curve of the lysine mutant channel was very similar to that of wild-type (WT) channels, suggesting no major structural alteration to the mutant channels. Reversal potential measurements, during cytoplasmic NaCl dilutions, showed that the lysine and the arginine mutations switched the selectivity of the channel from cations (PCl/PNa = 0.07 [WT]) to anions (PCl/PNa = 14 [Lys] or 10 [Arg]). Relative anion permeability sequences for the two mutant channels, measured with bi-ionic substitutions, were NO3 − > I− > Br− > Cl− > F− > acetate−, the same as those obtained for anion-selective GABA and glycine channels. The mutant channels also seem to have an extremely small single-channel conductance, measured using noise analysis of about 1–2 pS, compared to a WT value of about 29 pS. The results showed that it is predominantly the charge of the E342 residue in the P-loop, rather than the pore helix dipoles, which controls the cation–anion selectivity of this channel. However, the outward rectification displayed by both mutant channels in symmetrical NaCl solutions suggests that the negative ends of the pore helix dipoles may play a role in reducing the outward movement of Cl− ions through these anion-selective channels. These results have potential implications for the determinants of anion–cation selectivity in the large family of P-loop–containing channels.
INTRODUCTION
Cyclic nucleotide-gated (CNG) channels are critical for both olfactory and visual transduction, coupling their odor- or light-induced activation to the generation of an electrical signal (e.g., Schild and Restrepo, 1998; Frings, 2001; Kaupp and Seifert, 2002). The CNG channels are tetrameric proteins with each subunit comprised of large cytoplasmic carboxy and amino termini separated by six transmembrane domains (S1–S6), with the pore-forming P-loop between S5 and S6. Such a P-loop is a highly conserved structural feature in the channel forming subunits of the voltage-dependent cation channels and in those of a number of other types of K+ channels (MacKinnon, 1995). Thus an understanding of how the basic P-loop structure in the CNG channels relates to the properties of ion permeation has implications, not only for olfactory and visual transduction, but also for the molecular mechanisms of permeation throughout a large family of cationic channels.
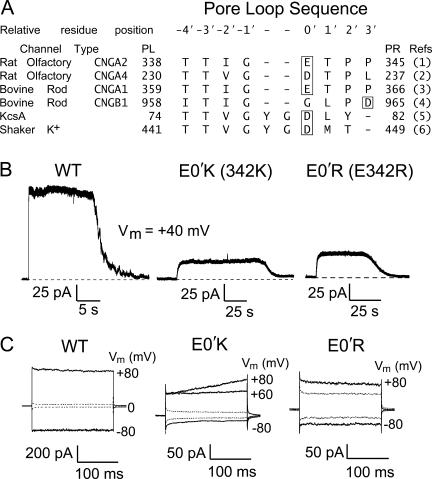
The P-loop of various cation channels contains a highly conserved acidic residue, which in the KcsA K+ channel resides at the external end of the selectivity filter (Doyle et al., 1998). In recombinant CNG channels, this acidic glutamate residue (E0′; see Fig. 1 A) in the α subunit (CNGA1 in rod or CNGA2 in olfactory) is thought to form part of the narrowest section of the pore (Becchetti et al., 1999) and constitutes a high-affinity intrapore cation-binding site important for blockage by external divalent cations and spermine (Root and MacKinnon, 1993; Eismann et al., 1994; Nevin et al., 2000). Neutralization of this residue by mutating E0′ to asparagine, serine, or alanine also decreases the single-channel conductance for monovalent ions, affects divalent ion permeation, and reduces the channel open probability, although regions outside the P-loop may also contribute to these key channel properties (Bucossi et al., 1996; Dzeja et al., 1999; Gavazzo et al., 2000).
Figure 1.
A comparison of CNG and K+ P-loop amino acid sequences and examples of macroscopic currents in WT and mutant CNGA2 channels activated by 5 mM cGMP. (A) A comparison of amino acid sequence alignment of the putative pore region amongst CNG and K+ channel subunits. The references in the last column are: 1, Dhallan et al. (1990); 2, Bradley et al. (1994); 3, Kaupp et al. (1989); 4, Körschen et al. (1995); 5, Schrempf et al. (1995); 6, Tempel et al. (1987). (B) Gap-free recordings of cGMP-activated macroscopic currents in E0′K (E342K) and E0′R (E342R) CNGA2 channels in inside-out patches of HEK 293 cells at Vm = +40 mV. The dashed line gives the zero-current level. Currents were filtered at 2 kHz. (C) Representative recordings of macroscopic currents in different inside-out patches in the three CNGA2 channels in the presence (filled line) and absence (dashed line) of cGMP in response to a voltage step of ±80 mV, from a holding potential of 0 mV. The average values obtained in response to voltage steps at +60 mV for the WT CNG channel currents were ∼480 ± 240 pA (n = 5), and for the E0′K mutant and the E0′R mutant CNG channel currents were ∼55 ± 17 pA (n = 21) and 33 ± 6 pA (n = 21), respectively. For the E0′K channels, the current trace at Vm of +80 mV often showed a slow and gradual increase, which reached a stabilized level after ∼2 s (not depicted). This delayed increase in current at +80 mV was more evident when the current sizes were >50 pA. It was not so evident at less positive voltages, as illustrated by the current response at +60 mV (C). No such delayed increase in current response was observed for the E0′R channels.
Despite intensive investigation of these P-loop residues in channel function, there is little information on how anion–cation selectivity is achieved in these cation channels. In ligand-gated ion channels, ion charge (anion–cation) selectivity can be reversed with mutations to key charged residues located close to the intracellular mouth of the pore (for reviews see Keramidas et al., 2004; Barry and Lynch, 2005; see also Keramidas et al., 2002; Moorhouse et al., 2002; Carland et al., 2004, for examples of single mutations reversing charge selectivity in glycine and GABAC receptor channels).
We hypothesized that the P-loop glutamate is involved in determining the relative cation to anion selectivity in CNG channels and tested this by substituting positively charged lysine or arginine residues for the glutamate in the P-loop.
MATERIALS AND METHODS
Transient Expression of CNGA2 Subunit cDNAs in HEK293 Cells
A copy of the original cDNA encoding the rat olfactory CNGA2 subunit from R. Reed (Johns Hopkins University School of Medicine, Baltimore, MD) was provided to us by A. Cunningham (Sydney Children's Hospital, Sydney, Australia) (equivalent to CNCα3 of Bönigk et al., 1999).
Restriction digests were used to isolate the CNGA2 insert from the original vector and to resubclone the full-length cDNA into the pcDNA 3.1(−) vector (Invitrogen), which included the 5′ untranslated region (see RESULTS). The construct was sequenced to confirm that it was correct. Site-directed mutagenesis was performed using the oligonucleotide-directed polymerase chain reaction method (Ho et al., 1989) and the successful incorporation of mutations was confirmed by sequencing the cDNA clones. Plasmid DNA encoding wild-type (WT) or mutant (E342K or E342R) CNGA2 channels, together with a separate plasmid cDNA for the CD4 surface antigen, were cotransfected into HEK 293 cells (American Type Culture Collection accession no. CRL-1573). Earlier experiments used a calcium phosphate precipitation transfection protocol (Chen and Okayama, 1987) and later experiments polyethylenimine (jetPEI; Polyplus-transfection), which provided a more reliable means of generating successful channel expression. CD4 antibody-coated polystyrene beads were used to mark successfully transfected cells (Dynabeads M-450, Dynal A.S.). Transfected cells were cultured in Eagle's minimum essential medium in Hank's salts (Sigma-Aldrich) supplemented with 2 mM glutamine and 10% FCS on poly-d-lysine– and collagen (IV)–coated coverslips and incubated in 5% CO2 at 37°C. Cells were used for patch-clamp recordings 24–72 h after transfection.
Solutions
Membrane currents were measured using the inside-out patch-clamp configuration (Hamill et al., 1981). The control bath and pipette solution contained 145 mM NaCl, 10 mM HEPES, and 2 mM EDTA, titrated to pH 7.4 with 1 M NaOH. Pipette solutions were filtered with a 0.2-μm filter (Gelman Sciences) before use. For bath application, different concentrations of cGMP (or cAMP in six of the nine WT PCl/PNa measurements) were added directly to control or test solutions and applied to the excised patches using a gravity-fed perfusion system consisting of 10 adjacent and parallel capillary polyethylene tubes. The patches or cells were positioned in front of the outflow of the perfusion tubes at a distance of ∼100 μm.
For the anion–cation selectivity measurements, potentials (dilution potentials) were measured in three different bath solutions with different concentrations of NaCl. The first control solution (1.0 NaCl) had the same 145 mM NaCl concentration as the pipette, the second (0.5 NaCl) had half the NaCl concentration (75 mM NaCl), and the third (0.25 NaCl) had a quarter the concentration (37.5 mM NaCl). Each solution also had 10 mM HEPES titrated to pH 7.4 with ∼5 mM NaOH. The 0.5 NaCl and 0.25 NaCl solutions were kept isotonic by the additions of 136 mM and 189 mM sucrose, respectively, based on the data in Wolf et al. (1980).
For the relative anion–anion selectivity experiments with the E0′K and E0′R mutant CNG channels, bi-ionic potentials were measured in which the control (NaCl) solution again had the same 145 mM NaCl concentration as the pipette and the subsequent test solutions had the Cl− in the NaCl solution completely replaced by the halides, F−, Br−, or I−, or by NO3 − or acetate−. Each solution also had 10 mM HEPES titrated to pH 7.4 with ∼5 mM NaOH. The reference electrode in the bath solution was a 145 mM NaCl/3–4% agar salt bridge.
Electrophysiological Recording
Experiments were performed at a room temperature of 21 ± 1°C. Recording electrodes were fabricated from filamented, borosilicate glass capillaries (GC150F-15; 1.5 mm O.D. × 0.86 mm I.D., Harvard Apparatus Ltd.), using a Flaming/Brown Micropipette electrode puller (model P-87, Sutter Instruments). The tip of the pipettes was then fire polished to give a pipette resistance of 3–5 MΩ. Currents were low pass filtered at 2 kHz and sampled at 10 kHz using an Axopatch 1D patch-clamp amplifier (Axon Instruments, Inc.), unless otherwise specified. Currents were measured in response to a series of 180–200 ms voltage pulses between −80 and +80 mV in increments of 20 mV and from a holding potential of 0 mV. Current–voltage (I-V) relationships were obtained by plotting the average steady-state currents in various test solutions against membrane potentials. Control (leak) currents, before and after the application of cGMP, were averaged and subtracted from currents in the presence of cGMP. Membrane potentials were corrected for liquid junction potentials using the Windows version of the JPCalc program (Barry, 1994). Mean values are quoted as mean ± SEM.
Data Analysis
Off-line analysis and graphing of current traces was conducted using pCLAMP 8.0 (Axon Instruments, Inc.) and SigmaPlot (Jandell Scientific) on a Pentium III computer. Concentration–response curves for cGMP were generated by measuring the current response at ±60 mV at different cGMP concentrations, and this relationship was then fitted with the Hill equation:
 |
(1) |
where Inorm is the normalized current amplitude (I/Imax), C is the cGMP concentration, EC50 is the concentration of cGMP that gives 50% of the maximal response, and h is the Hill coefficient.
To analyze the ion selectivity data, current–voltage curves were plotted for currents in each bathing solution and the zero- current reversal potentials, Vrev, were determined from polynomial fits to the curves. The Vrev was then plotted against the Na+ activity (aNa) for the WT CNGA2 channels, and against the Cl− activity (aCl) for the mutant channels (see Fig. 6). The NaCl activity coefficients were determined by iterative interpolation (using SigmaPlot) from the tables in Robinson and Stokes (1965). The values of the relative Cl− to Na+ permeability ratio, PCl/PNa, were obtained using the Goldman-Hodgkin-Katz (GHK) equation (e.g., Hille, 2001),
 |
(2) |
to fit the values of Vr ev to the three data points in the plots of Vrev against aNa or aCl (see Fig. 6) using SigmaPlot. Permeability ratios were determined for individual patches and the values averaged to obtain their means and SEM.
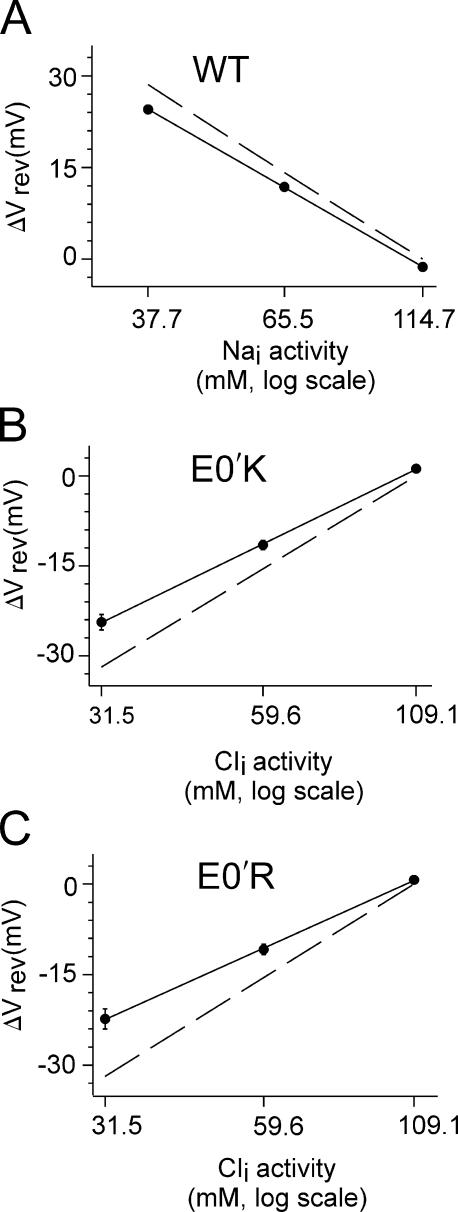
Figure 6.
Anion–cation selectivity of WT and mutant E0′K (E342K) and E0′R (E342R) CNGA2 channels. (A) The average shift in reversal potential, ΔVrev plotted against cytoplasmic Na+ activity and fitted with a solid line, indicates that PCl/PNa = 0.07 ± 0.02 for the WT channel (compared with the value of 0.07 ± 0.01, as given in Table I, obtained from averaging the fits of individual experiments; n = 9). The dashed line represents the prediction of a perfectly selective Na+ channel and is shown for comparison. (B and C) Similarly, the averaged ΔVrev plotted against Cl− activity and fit with the GHK equation indicates that PCl/PNa = 9.5 ± 1.4 for the E0′K mutant channel and 7.1 ± 0.5 for the E0′R mutant channel (compared with values of 14.4 ± 2.5 and 9.8 ± 1.8 as given in Table I, obtained from averaging the fits of individual experiments; n = 14 and 10). The dashed lines in both graphs are the predictions of perfectly selective Cl− channels and are shown for comparison), indicating that both are strongly anion selective. It should be noted that because of the additional Na+ in the NaOH added to titrate the HEPES for all the solutions (see MATERIALS AND METHODS), there is a difference between the Nai and Cli activities and in the slopes of the shifts for what would be perfectly selective Na+ and Cl− channels.
For the bi-ionic measurements to determine the relative permeability of the test anion, X−, with respect to Cl−, the cytoplasmic (internal) Cl− was completely replaced by the test anion X− (F−, Br−, I−, NO3 −, or acetate−). The zero-current reversal potential was determined from the current–voltage relationship and the GHK equation, expressed as
 |
(3) |
The value of PX /PCl was determined, taking into account the value of PCl/PNa obtained from the dilution potential experiments for each patch, and the values were averaged to obtain their means and SEM.
Noise Analysis
The noise analysis method (Heinemann, 1995) was used to determine the unitary current of the mutant and WT CNGA2 channels in response to different concentrations of cGMP, or during the washout of cGMP. The mean macroscopic cGMP-elicited current (I) and current variance (σ2) for a patch was obtained from 1–5-s segments of current recordings in the presence of cGMP after subtracting values obtained during equivalent control periods (without cGMP). The relationship between I and σ2 was fitted by the equation (Gray, 1994)
 |
(4) |
where σ2 is the current variance, i is the mean unitary channel current, I is the mean macroscopic current, and n is the total number of channels.
Testing for Endogenous cGMP-gated Channels
Because of the small amplitude of the cGMP-activated currents with the E0′K or E0′R mutant channels, we also conducted control experiments on HEK293 cells expressing only the CD4 antigen (mock-transfected cells).
For both WT and mutant CNGA2 channels, current traces were observed to increase immediately (within a few seconds) after the application of cytoplasmic cGMP or cAMP. Moreover, these evoked currents would then revert back to the initial current levels within a few seconds after the return to the control solution (see Fig. 1 B). Only those currents that were clearly activated in response to cytoplasmic cyclic nucleotides and were also reversible on return to the control symmetrical NaCl solution were accepted for further analysis. Any patches that displayed significant leakage currents before the application of cyclic nucleotides, or during the experiment, were discarded.
For the mock-transfected cells, in contrast, no immediate response to the application of cGMP/cAMP was ever observed (n = 33). In a few cases, a small increase in current was seen during long applications of cGMP/cAMP (e.g., for >1 min), but the current response was never able to be reversed even when the control solution was applied for >5 min. In addition, such an increase in current response was also sometimes seen in the absence of any agonist, suggesting that the membrane patch had just become more leaky.
RESULTS
To investigate ion charge (anion–cation) selectivity in CNG channels, we have mutated the negatively charged glutamate residue in CNGA2 channels (E342 or E0′; see Fig. 1 A for relative residue notation) to a positively charged lysine (E0′K) or arginine (E0′R). We achieved considerably improved expression levels in HEK293 cells with the present construct compared with that used in a previous preliminary study of ours. (A previous preliminary investigation [Barry, P.H., S. Bieri, A.M. Cunningham, R. Kaur, A. Keramidas, A.J. Moorhouse, W. Qu, and X.O. Zhu. 2001. IUPS Congress Proceedings. Abstract a1304] with an earlier cDNA construct appeared to show a selectivity reversal for an E0′K mutation, but the currents were extremely small, somewhat variable, and inconsistent, and we were unable to further unequivocally substantiate the results with that preparation. The present construct includes the 5′ untranslated region of the cDNA and produces much larger WT currents and very consistent mutant channel currents. We do acknowledge the contributions particularly of Drs. Zhu, Bieri, and Kaur and Prof. Cunningham, in addition to those of some of the authors of this paper, to that preliminary investigation.) With this new construct, both E0′K and E0′R mutant channels yielded consistent macroscopic channel currents, which were measured with voltage-clamp recordings on inside-out patches.
We used 5 mM cGMP to activate maximum currents in both E0′K and E0′R mutant channels, since CNGA2 channels are more sensitive to cGMP than cAMP (Dhallan et al., 1990, Bradley et al., 1994; Li and Lester, 1999). With both mutants, cGMP elicited clear currents without any desensitization, but with markedly smaller current amplitudes than those in WT channels (see Fig. 1 B for examples of gap-free recordings). For currents recorded in response to voltage pulses (dilution potentials, bi-ionic potentials, and agonist–concentration response measurements), the average currents in E0′K and E0′R channels at Vm = +60 mV were 55 ± 17 pA (n = 21) and 33 ± 6 pA (n = 21), respectively, compared with 480 ± 240 pA (n = 5) for WT CNGA2 channels.
Our later noise measurements suggest that a substantial decrease in single channel conductance and a decrease in maximum channel open probability was the reason for these smaller currents in the mutant CNG channels. As already described in the previous section, control experiments in mock-transfected cells indicated the absence of any endogenous cGMP-activated currents in those cells. In addition, the mutant channels also showed clear outward rectification compared with WT channels (Fig. 1 C), with currents at a Vm of −60 mV being 35 ± 4% (n = 21) of those at +60 mV for E0′K channels, and 41 ± 4% (n = 21) for E0′R channels. For E0′K channels, when Vm was stepped from 0 to +80 mV, there was a small progressive increase in current amplitude within the first second (e.g., Fig. 1 C and see Fig. 7), which was not seen at any other test voltage used. The possibility that such an effect reflected a gradual relief of block by large HEPES anions in the solution was tested by doing similar measurements in the absence of HEPES (buffering the solutions with Tris-HCl), but the effect at + 80 mV remained (unpublished data). No such effect was observed in either WT or E0′R mutant channels within the test voltage range.
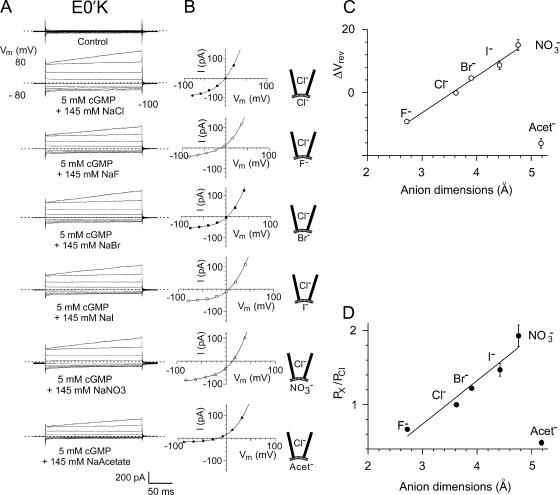
Figure 7.
The current–voltage relationships and relative anion selectivity of the E0′K (E342K) CNGA2 channels in bi-ionic solutions with Cl− ion substitutions by other halide, NO3 −, and acetate− anions. (A) Macroscopic cGMP-activated currents in different bi-ionic solutions in one inside-out patch with mutant E0′K CNGA2 channels. Note that in this particular recording the currents were unusually large. For each set of currents, the cytoplasmic NaCl control solution is replaced by NaF, NaBr, NaI, NaNO3, and NaAcetate. (B) Current–voltage curves for the currents shown in A. In each case the average control currents in the absence of cGMP have been subtracted, as in the procedures used for Figs. 3–5 . Again, the zero current level is shown by the short-dashed line for each set of traces. The membrane potential, Vm, values have all been corrected for liquid junction potentials. A negative shift for ΔVrev indicates that the anion is less permeant than Cl− and a positive shift that it is more permeant. The reversal potentials (in mV) for this one patch were as follows: Cl− (−0.5), F− (−11), Br− (3.5), I− (5.5), NO3 − (13), and acetate− (−18). C and D give the average data for all the recordings from the E0′K anion selectivity experiments and show the shifts in reversal potential (C) and relative permeabilities (D) of the anions as a function of anion size (calculated using the GHK equation; Eq. 3). D shows for the halides and NO3 − that as the dimensions of the anion increases (and magnitude of the hydration energy decreases), its relative permeability decreases. However, the larger acetate− has a much lower relative permeability than the larger halides and NO3 −, suggesting a different interaction with the channel. For the halides, the anion dimension is taken as the diameter, and for the nonspherical NO3 − and acetate− ions, the median dimension is used. The mean values for relative anion permeabilities in all the mutant E0′K patches are given in Table II.
Agonist Concentration–Response Data
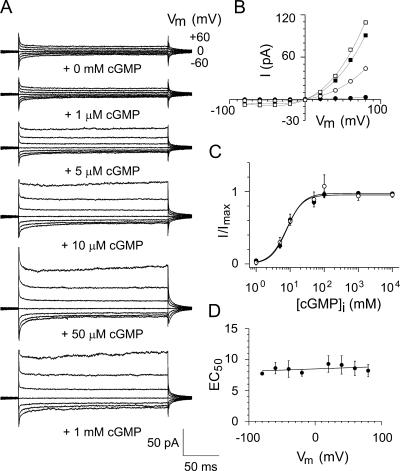
We also examined the cGMP concentration dependence in the E0′K mutant channels. As with WT CNGA2 channels (Bradley et al., 1994), E0′K mutant channels were also very sensitive to cytoplasmic cGMP with a saturating concentration of ∼50 μM (Fig. 2 A), an average EC50 of 8.6 ± 1.2 μM (n = 5), and a mean Hill coefficient (h) of 2.4 ± 0.6 (n = 5) at a Vm of +60 mV (Fig. 2 C). The EC50 values did not show any clear voltage dependence (Fig. 2, C and D) and were higher than those in WT channels (1.4 ± 0.1 μM at + 60 mV; Bradley et al., 1994), suggesting a slight decrease in cGMP sensitivity. The Hill coefficient was similar to that of WT channels (Bradley et al., 1994). The strong current rectification was observed for both E0′K and E0′R channels at all cGMP concentrations used.
Figure 2.
Concentration–response data for mutant E0′K (E342K) CNGA2 channels. (A) Representative macroscopic currents for one inside-out patch at different concentrations of cGMP. The currents were measured in response to voltage steps ranging from −60 to +60 mV. (B) Corresponding current–voltage (I-V) curves (1 μM, filled circles; 5 μM, open circles; 50 μM, filled squares; 100 μM, open squares) for the data in A. For each data point, the average control current in the absence of cGMP has been subtracted from the average current in its presence. (C) Concentration–response curves at a membrane potential of +60 mV (filled circles) and −60 mV (open circles) relative to the maximum current in each case. The continuous lines were obtained by fitting a Hill function to the data. (D) Relationship between the average values of the EC50 and voltage (Vm). This indicated that the EC50 was essentially voltage independent. For this and other membrane patches, the mean Hill coefficient, h, was 2.4 ± 0.6 (n = 5) and the mean EC50 was 8.6 ± 1.2 μM (n = 5).
The similarity between the agonist concentration response data for the E0′K mutant channels and those of the WT channels suggests the mutations have not affected the structure of the channels in any major way.
Anion–Cation Selectivity of the Mutant Channels
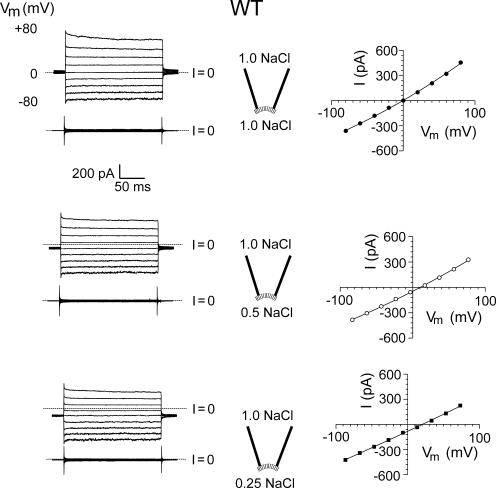
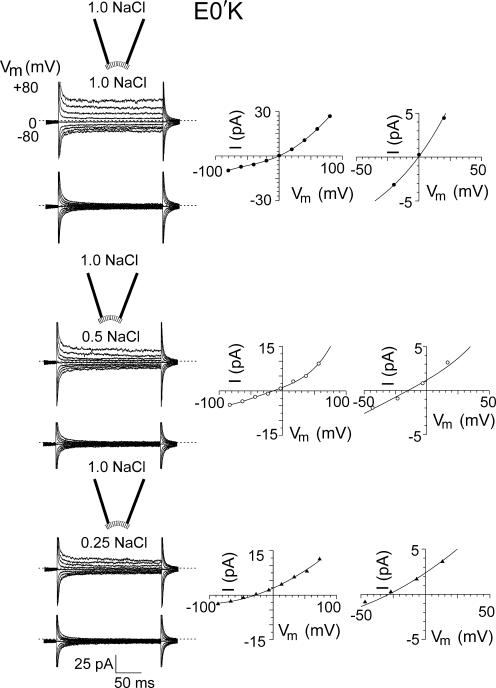
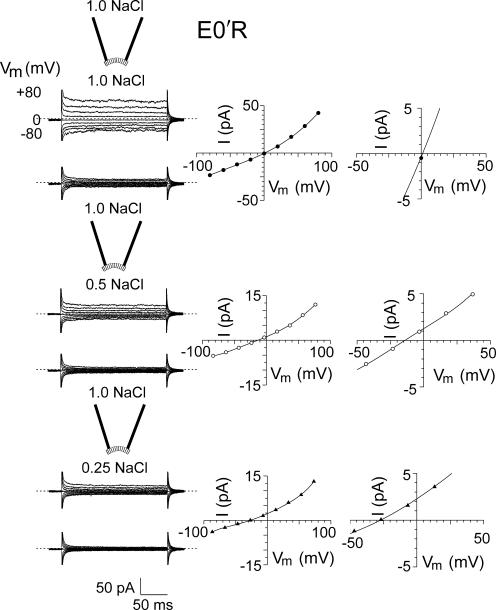
To study the anion–cation selectivity of the mutant channels, we bath applied different NaCl solution dilutions to inside-out patches, from symmetrical full NaCl (145 mM) solution to 0.5 (75 mM) and 0.25 NaCl (37.5 mM) dilutions, with the pipette solution kept constant (see MATERIALS AND METHODS for full ionic composition of solutions). Such dilutions were in a direction to shift the Na+ equilibrium potential to positive potentials and the Cl− equilibrium potential to negative potentials. Currents were elicited by applying a saturating concentration of cGMP (5 mM) in individual intracellular NaCl solutions, and were recorded at different membrane potentials using a voltage step protocol from a holding potential of 0 to ±80 mV (Fig. 3). Leak currents obtained in the 1.0 NaCl, 0.5 NaCl, and 0.25 NaCl control solutions (without cGMP) were subtracted from the corresponding cGMP-activated current recordings. The I-V relations of macroscopic current recordings in cation-selective WT channels, as reported before (Qu et al., 2000), showed a positive shift in the zero-current reversal potential (Vrev) as [Na+]i was decreased (Fig. 3). The mean values of Vrev, corrected for liquid junction potentials, are given in Table I. These values clearly indicated that the WT CNG channels were selective to cations. In contrast, under the same conditions, Vrev for both the E0′K (Fig. 4) and E0′R (Fig. 5) channels dramatically shifted to more negative values, as indicated in Table I, showing that the mutant channels were now anion selective.
Figure 3.
Current–voltage relationships for WT CNGA2 channels in diluted solutions. Macroscopic cGMP-activated currents in different NaCl dilutions in one inside-out patch with WT CNG channels. Approximate solution dilutions (expressed relative to the control NaCl solution of 145 mM NaCl; see MATERIALS AND METHODS for full composition) are given in the pipette insets. The top set of traces in the left panel for each solution indicates the currents in the presence of 5 mM cGMP, recorded in response to 1.5-s voltage pulses from −80 to +80 mV in 20-mV steps, and the bottom set of traces indicates the control currents in the absence of cGMP. The zero current level (I = 0) is shown by the short-dashed line for each set of traces. In the right column the resultant I-V curve for each solution was obtained by subtracting the average control current in the absence of cGMP from the average current in its presence and correcting the membrane potential, Vm, for the effect of liquid junction potentials. For this patch, the Vrev in symmetrical conditions was 0 mV, and the ΔVrev shifts for the 0.5 and 0.25 dilutions were +10.5 and +20.5 mV, respectively, indicating that these WT channels are cation selective. For the mean values for all the WT patches, see Table I.
TABLE I.
Permeation and Conductance Parameters of WT and Mutant CNGA2 Channels
| Parameter | Vrev | ΔVrev (0.5) | ΔVrev (0.25) | PCl/PNa | n | γ | n |
|---|---|---|---|---|---|---|---|
| mV | mV | mV | pS | ||||
| WT CNGA2 | −1.3 ± 0.6 | 11.8 ± 0.6 | 24.5 ± 0.7 | 0.07 ± 0.01 | 9 | 29 ± 6 | 3 |
| E0′K mutant CNGA2 | 1.2 ± 0.4 | −11.5 ± 0.8 | −24.4 ± 1.3 | 14.4 ± 2.5 | 14 | 0.6 ± 0.2 | 3 |
| E0′R mutant CNGA2 | 0.7 ± 0.2 | −10.8 ± 0.9 | −22.4 ± 1.7 | 9.8 ± 1.8 | 10 | 2 ± 1 | 3 |
A summary of the average reversal potentials, Vrev, in control (1 NaCl) solution and their shifts, ΔVrev, in 0.5 NaCl and 0.25 NaCl solution dilutions (see Figs. 3–6 ), relative permeabilities, and single channel conductances, γ. The potentials were all corrected for liquid junction potentials and the relative permeabilities were calculated using the GHK equation (Eq. 2). The single channel conductances were measured from the relationship between mean current and variance at +40 mV, in response to four to five different cGMP concentrations in each patch, and the WT conductance value is in the range of the directly measured single channel γ of 46 ± 20 pS (Qu et al., 2000).
Figure 4.
Current–voltage relationships for mutant E0′K (E342K) CNGA2 channels in diluted solutions. Macroscopic cGMP-activated currents in different NaCl dilutions in one inside-out patch with mutant E0′K (E342K) CNGA2 channels. The experimental procedures are identical to those described for Fig. 3 and represents the equivalent set of current–voltage measurements for these mutant channels to those for the WT ones. As in Fig. 3, the zero current level is shown by the short-dashed line for each set of traces. The right hand column shows the I-V curves at increased resolution to more clearly show the V rev value. For this patch, the Vrev in symmetrical conditions was 0 mV and the ΔVrev shifts for the 0.5 and 0.25 dilutions were −15 and −28 mV, respectively. The negative ΔVrev shifts indicate that this mutant CNG channel is anion selective. For the mean values for all the mutant E0′K patches, see Table I.
Figure 5.
Current–voltage relationships for E0′R (E342R) CNGA2 channels in diluted solutions. Macroscopic cGMP-activated currents in different NaCl dilutions in one inside-out patch with mutant E0′R (E342R) CNGA2 channels. The experimental procedures are identical to those described for Figs. 3 and 4. Again, the zero current level is shown by the short-dashed line for each set of traces. For this patch, the Vrev in symmetrical conditions was 1 mV and the ΔVrev shifts for the 0.5 and 0.25 dilutions were −14.0 and −27 mV, respectively. The negative ΔVrev shifts indicate that this mutant channel is also anion selective. For the mean values for all the mutant E0′R patches, see Table I.
To measure the chloride-to-sodium permeability ratio (PCl/PNa), we plotted Vrev values against internal sodium activities for WT (Fig. 6 A), or against internal chloride activities for the two mutant channels (Fig. 6, B and C), and the relationship was then fitted to the modified GHK equation. The validity of using such an equation for permeability fitting is outlined in Keramidas et al. (2004). The value of PCl/PNa for WT channels (Table I) was similar (0.07 ± 0.01; n = 9) to our previous report (Qu et al., 2000). The value of PCl/PNa for E0′K channels was 14.4 ± 2.5 (n = 14) and the value for E0′R channels was 9.8 ± 1.8 (n = 10), clearly indicating that both mutant channels were now anion selective (Table I). Hence, the E0′K and the E0′R mutations were each able to convert the WT CNGA2 channel from being reasonably strongly cation selective to being reasonably strongly anion selective.
It would seem very reasonable that the outward rectification displayed by both mutant channels in symmetrical NaCl solutions arises because the negative ends of the pore helix dipoles considered to be facing the inner part of the channel are now reducing the outward movement of Cl− ions through these anion-selective channels (see DISCUSSION).
Relative Anion Selectivity of the Mutant CNG Channels
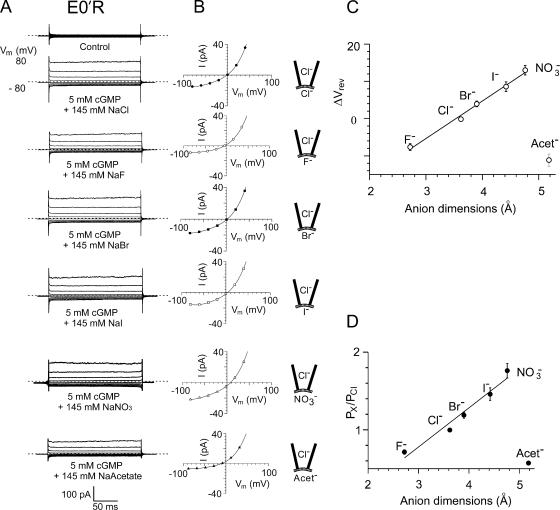
We also investigated the relative anion–anion selectivity of the mutant E0′K and E0′R channels in inside-out membrane patches. In these measurements, the cytoplasmic NaCl control solution was replaced by NaF, NaBr, NaI, NaNO3, and NaAcetate, and the increase in current activated by the addition of 5 mM cGMP was measured. In each case, the current–voltage relationship was plotted, the change in the zero-current reversal potential (ΔVrev) determined, and the relative permeability ratio (PX/PCl) determined using the GHK equation. Figs. 7 and 8 show the results for the mutant E0′K and E0′R channels, where it may be seen for the halide and NO3 − ions that as the anion dimensions increase, the relative permeability of the anion increases. In the case of the halide anions, the increase in permeability also parallels the decrease in the magnitude of the hydration energy required to dehydrate the ion. Acetate, however, has a much smaller permeability than the large halide or NO3 − anions. The permeability sequence of these six anions for both mutant CNG channels was PNO3 > PI > PBr > PCl > PF > Pacet (see Table II for relative selectivity ratios).
Figure 8.
The current–voltage relationships and relative anion selectivity of the E0′R (E342R) CNGA2 channels in bi-ionic solutions with Cl− ion substitutions by other halide, NO3 −, and acetate− anions. The experimental procedures are equivalent to those in Fig. 7 for the E0′K mutant CNG channels and the results are very similar. (A) Macroscopic cGMP-activated currents in different bi-ionic solutions in one inside-out patch with mutant E0′K CNGA2 channels. Again the cytoplasmic NaCl control solution is replaced by NaF, NaBr, NaI, NaNO3, and NaAcetate, and for each set of traces, the zero current level is shown by the short-dashed line. (B) Current–voltage curves for the data shown in A. Currents in the absence of cGMP have been subtracted. The reversal potentials in mV for this one patch were as follows: Cl− (−1.0), F− (−5.0), Br− (2.0), I− (4.0), NO3 − (8.5), and acetate− (−10). C and D give the average data for all the E0′R anion selectivity experiments and show the shifts in reversal potential (C) and relative permeabilities (D) of the anions as a function of anion size. Again, D shows for the halides and NO3 − that as the ionic dimension of the anion increases, its relative permeability decreases. However, again the larger acetate− has a much lower relative permeability than the larger halides and NO3 −, suggestive of a different interaction with the channel. The mean values for relative anion permeabilities in all the mutant E0′R patches are given in Table II.
TABLE II.
Relative Anion Permeabilities of Mutant CNGA2 Channels
| E0′K mutant CNGA2 channel | E0′R mutant CNGA2 channel | |||
|---|---|---|---|---|
| Anion | ΔV rev (mV) | PX/PCl | ΔV rev (mV) | PX/PCl |
| Cl− | −0.1 ± 0.3 | 1.00 | −0.2 ± 0.5 | 1.00 |
| F− | −9.2 ± 0.7 | 0.67 ± 0.02 | −7.6 ± 0.9 | 0.71 ± 0.02 |
| Br− | 4.6 ± 0.4 | 1.22 ± 0.02 | 3.9 ± 0.8 | 1.19 ± 0.04 |
| I− | 8.7 ± 1.4 | 1.47 ± 0.09 | 8.6 ± 1.3 | 1.46 ± 0.08 |
| NO3− | 15.1 ± 1.7 | 1.93 ± 0.15 | 13.0 ± 1.3 | 1.76 ± 0.09 |
| Acetate− | −16.2 ± 1.5 | 0.49 ± 0.03 | −11.1 ± 1.6 | 0.57 ± 0.02 |
Average reversal potentials, ΔVrev, corrected for liquid junction potentials, and relative anion permeabilities, PX/PCl, determined from measurements in bi-ionic solutions in which the cytoplasmic Cl− has been replaced by the test anion (F−, Br−, I−, NO3 −, or acetate−), with example data sets displayed in Figs. 7 and 8. For the E0′K mutant CNGA2 channel, the number of patches that included the halide and NO3 − anions was seven and six for those that also included the acetate− anion. For the E0′R mutant CNG channel, the number of patches that included the halide, NO3 −, and acetate− anions was seven. The relative anion permeabilities were calculated using the form of the GHK equation given in Eq. 3.
Unitary Conductances of the Mutant CNG Channels
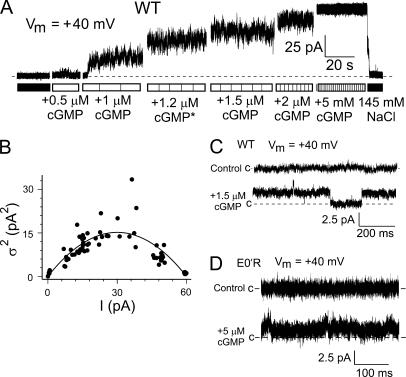
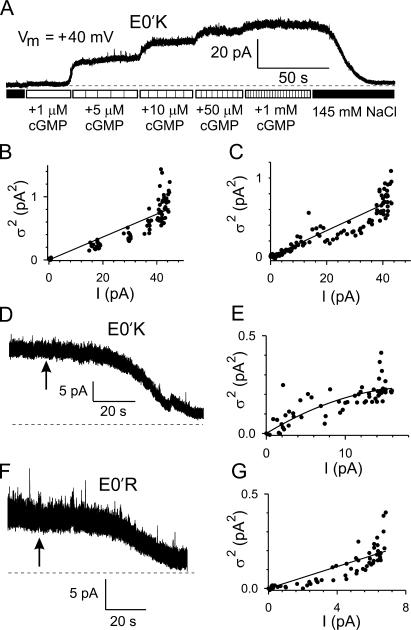
As we and others have previously reported (e.g., Qu et al., 2000), WT CNGA2 channels display clear single channel openings in the presence of cyclic nucleotides (Fig. 9 C). In contrast, we could not resolve any clear and consistent cGMP-activated single channel openings in either the E0′K or E0′R mutant CNG channels, even when the recording bandwidth was increased to 10 kHz (E0′R channel; Fig. 9 D). Consequently, we estimated the unitary amplitude from macroscopic currents using noise analysis techniques (e.g., Heinemann, 1995). Steady-state macroscopic currents of different amplitudes were obtained in the presence of increasing concentrations of cGMP, at a Vm of +40 mV. For WT CNGA2 channels, mean variance increased to a maximum as mean current increased, before decreasing again with further current increases (Fig. 9, A and B), giving a unitary current estimate of 1.15 ± 0.24 pA (corresponding to a γ of 29 ± 6 pS, n = 3). In contrast, there was an essentially linear relationship between mean current and mean variance for both the E0′K (Fig. 10, A and B) and the E0′R CNG channels, suggesting that the maximum open probability was reduced by these mutations. The unitary current was estimated as 0.02 ± 0.01 and 0.08 ± 0.05 pA for the E0′K (n = 3) and E0′R (n = 3) CNG channels, respectively (corresponding to a γ of 0.6 ± 0.2 and 2 ± 1 pS, respectively). Using the slow washout phase of macroscopic cGMP-activated currents, or the linear relationship between variance and current for steady-state currents at a single cGMP concentration, again at +40 mV, gave similar small values for the unitary current (Fig. 10, C–G), which were 0.05 ± 0.01 pA (γ = 1.3 ± 0.3 pS; n = 6) for the E0′K channels and 0.07 ± 0.01 (γ = 1.8 ± 0.3 pS; n = 12) for the E0′R channels. Replacing HEPES with Tris-HCl (E0′K; n = 5) had no major effect on the estimates of unitary currents (unpublished data), while changing the recording bandwidth from 10 to 2 kHz (E0′R; n = 3) only reduced the unitary current amplitude by 12 ± 7%.
Figure 9.
Estimation of unitary (single channel) currents and conductances of WT CNGA2 channels using noise analysis. (A) Activation of WT channels by different concentrations of cGMP at a Vm of +40 mV. The * after the +1.2 μM cGMP is to indicate that this is the estimated concentration of a mixture of the 1 and 1.5 μM cGMP solutions. The dashed line shows the 0 current level. (B) Relationship between the mean current (I) and mean variance (σ2; see MATERIALS AND METHODS) for the trace shown in A, calculated for 1-s sections of the current recorded at each concentration, with control values of I and σ2 subtracted. The estimated single channel current, i, was 1.01 pA. Mean values for i are given in Table I. (C) Continuous representative current recordings for WT CNGA2 channels recorded at 2 kHz. The top trace in each set gives the current in the absence of cGMP and the bottom trace currents in the presence of a low concentration of cGMP, as indicated. The dashed line shows the baseline (closed) current level. The WT CNG channels show clear current steps of ∼2 pA. (D) Continuous representative current recordings for E0′R mutant CNGA2 channels recorded at 10 kHz. The top trace in each set gives the current in the absence of cGMP and the bottom trace currents in the presence of a low concentration of cGMP, as indicated. The dashed line shows the baseline (closed) current level. Despite the very small increase in the mean current in the presence of cGMP, the E0′R channels show no clearly resolved current steps, even at this wider bandwidth.
Figure 10.
Estimation of unitary (single channel) currents and conductances of E0′K (E342K) and E0′R (E342R) CNGA2 channels using noise analysis. (A) Activation of E0′K channels by different concentrations of cGMP at a Vm of +40 mV. The dashed line shows the zero current level. (B) Relationship between mean macroscopic cGMP-activated current (I) and current variance (σ2) for the trace shown in A, calculated for 5-s sections of the current recorded at each agonist dose, with control values of I and σ2 subtracted, gave a single channel current, i, of 0.018 pA. (C) Variance vs. mean current for E0′K channels in the same recording as in A but using the gradual decline in I during cGMP washout, giving a similar i value of 0.017 pA. D and E give the relationship between I and σ2 during gradual cGMP washout in another patch with E0′K channels. F and G give the relationship between I and σ2 during gradual cGMP washout for an E0′R channel with i = 0.03 pA. As shown in Table I, average currents indicated single channel conductances of ∼1–2 pS for both channels.
DISCUSSION
The results presented in this paper indicate clearly for the first time that the single E0′K (E342K) and E0′R (E342R) mutations in the P-loop of the recombinant rat olfactory CNG channels (CNGA2) are each sufficient to convert the ion selectivity of the channel from being cation selective to being anion selective. The change was not subtle, with the channel going from being clearly cation selective (PCl/PNa ∼0.07) to being clearly anion selective (PCl/PNa ∼14 [E0′K] and ∼10 [E0′R]). This suggests that it is primarily the polarity of the side chain charge at this important 0′ residue that electrostatically allows anions or cations to permeate through the selectivity filter of the pore and thereby determines the ion charge selectivity in these channels.
We also investigated the relative anion–anion selectivity of the mutant channels for the halide anions (F−, Cl−, Br−, and I−), together with NO3 − and acetate− anions. Both mutant CNG channels displayed the same relative permeability sequence: NO3 − > I− > Br− > Cl− > F− > acetate− (Table II, Fig. 7 D, and Fig. 8 D). Interestingly, the permeability sequence for both mutant CNG channels was the same as, and quantitatively very similar to, that found for both the native anion-selective GABAA and glycine receptor channels (Fatima-Shad and Barry, 1993). Each of these permeability sequences also differs from the sequence of relative ion mobilities in free solution (uBr > uI > uCl > uNO3 > uF > uacet; from limiting equivalent conductivity values in Robinson and Stokes, 1965). These results thus clearly demonstrate the anion selectivity of these mutant CNG channels and suggests some interaction of the anions with the selectivity filter region.
Although the pore helix dipoles may not play a major role in determining anion–cation selectivity in CNGA2 channels, we believe that they may be responsible for the strong outward rectification displayed by both the E0′K and E0′R mutant channels. This may result because the negative ends of the pore helix dipoles (facing the inner part of the channel) would be expected to reduce the outward movement of the negative Cl− ions in the anion selective E0′K and E0′R mutant channels. If this interpretation is correct, it would also support the contention that the E0′ mutations were only having a local effect on the pore and had not altered the structure or orientation of the pore helices. A parallel example of anion–cation selectivity switching resulting in rectification was observed in mutations to the normally anion-selective GlyR channel (Moorhouse et al., 2002). When two mutations (A-1′E, P-2′Δ) were made to add negative charge to its selectivity filter region, and the channel was made cation selective, it became outwardly rectifying. It was suggested that this was occurring because of the presence of the residual positive charge (R19′), which still remained at the outer end of the channel and was now of opposite polarity to the permeant ions. To confirm this interpretation, when the positive charge was neutralized (R19′A), the rectification was abolished, and when replaced by a negative charge (R19′E), the channel became inwardly rectifying. The results were successfully modeled mathematically and also supported the contention that the two mutations in the selectivity filter region were only acting locally and had not structurally affected the rest of the pore and the R19′ residues (Moorhouse et al., 2002).
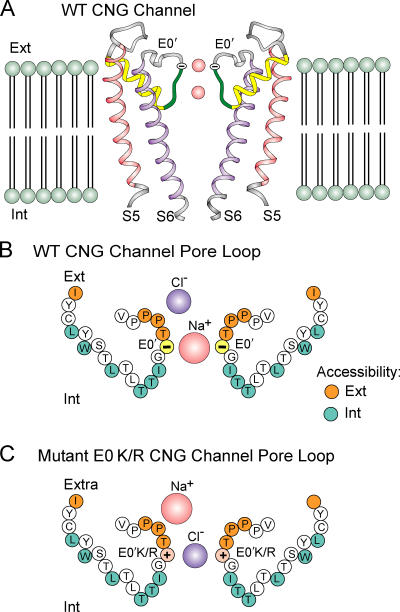
The overall hypothetical model for these selectivity effects in the CNGA2 channels is given in Fig. 11, which schematically shows the pore of the CNG channel based, with modifications, upon the structure of the KcsA potassium channel (Doyle et al., 1998; Roux et al., 2000). Due to the absence of two residues (Gly and Tyr) in the P-loop sequence of the CNG channel (Fig. 1 A) and the marked functional differences in the permeation properties of these different channels, structural alignments are rather tentative. We have therefore simplified our representation of the P-loop in Fig. 11 A. Fig. 11 (B and C) shows the proposed topology of the pore helix and loop sequence suggested by the cysteine mutagenesis experiments of Becchetti et al. (1999). We suggest that the E0′ residue projects its side chain toward the external end of the selectivity filter to predominantly allow cations to pass through the pore (Fig. 11, A and B). When this residue is mutated to a lysine or arginine, a positive side chain now predominantly allows anions to permeate through the pore (Fig. 11 C).
Figure 11.
A schematic diagram of the CNGA2 channel pore illustrating the role of the charges at the 0′ (342) position at the external end of the P-loop to determine anion–cation selectivity. (A) A schematic diagram showing two of the four subunits of the WT CNG channel, based with modifications on the structure of the KcsA channel (modified and redrawn from Fig. 5 of Roux et al., 2000), which had been based on the data of Doyle et al. (1998). The P-loop especially has been shortened to reflect the absence of the G-Y motif that forms a critical part of the K+ selectivity–determining sequence in KcsA (Fig. 1 A) and it has been simplified to a simple ribbon, since its precise structure in the CNG channel is not known. S5 and S6 represent the main transmembrane helical domains and the pore helices are shown as yellow helical ribbons. The single charged residues (E0′) are shown as a yellow circle at the exterior end of the pore. (B) A schematic model of the proposed topology of the channel pore of the cation-selective WT olfactory CNGA2 channel, showing both the pore helices and sections of the loops lining the channel pore. This has been modified from Fig. 13 of Becchetti et al. (1999), which had been based on their MTS accessibility data for bovine rod CNGA1 channels. The angles of the pore helices have been kept the same as those in A. The orange and blue circles represent those residues considered to be accessible from the extracellular and intracellular solutions, respectively. The white circles represent those residues, which were either not accessible to MTS compounds or else were unable to express functional channels when mutated to cysteines. (C) An analogous schematic model of the proposed topology of the anion-selective E0′K or E0′R olfactory CNGA2 channel, with the E0′K/R residue shown in pink. It was assumed that the accessibility of the P-loops has not been changed by either of the above mutations, in the light of the MTS data with the E0′A mutation in rod CNGA1 channels, which showed no overall changes in accessibility (Roncaglia and Becchetti, 2001). The different sizes of the permeating Na+ and Cl− ions are intended to reflect the larger effective radius of the Na+ ion, with its greater hydration energy, which will tend to permeate with more of its hydration shell, as opposed to the smaller effective radius of the Cl− ion, with its much smaller hydration energy, which can more readily permeate with most of its hydration shell stripped off. Ext and Int represent the extracellular and intracellular ends, respectively, of the lipid bilayer or channel.
This picture of the determinants of anion–cation selectivity for the CNG channels differs from that currently envisaged for the cation selectivity of K+ channels. In KcsA, the appropriate electrostatic environment for cations within the pore is considered to be predominantly (∼80%) the result of pore helix dipoles projected toward the internal cavity at the interior end of the selectivity filter (Roux and MacKinnon, 1999; Roux et al., 2000). In contrast for CNG channels, we suggest that pore helix dipoles are not critical for determining anion–cation selectivity but, as indicated above, that this is determined by the polarity of the 0′ residues. However, as discussed earlier, we do suggest that these pore helix dipoles may contribute to the outward rectification of the E0′K/R mutant CNG channels in symmetrical solutions.
It should also be noted that a recent study on the role of the pore helix dipoles in the inward rectifier (Kir2.1), in which positive charges were introduced in the K+ channel signature sequence at the pore helix COOH terminus to counteract the negative dipolar charge at this end of the helices, suggested that for this inward rectifier K+ channel, the helix dipoles did not play a major role in controlling the selective ion permeation of these channels (Chatelain et al., 2005).
Unfortunately, neutralization or inversion of charge at the D80 (D0′ homologous to E0′ in the CNG) residue in KcsA seems to impair functional homomeric channel expression (Heginbotham et al., 1997), so we cannot comment further on its role in anion–cation selectivity in KcsA channels. However, introduction of just two D378T (D0′T) point mutations in Kv 2.1 channels constructed from tandem dimers did reduce relative K+/Na+ selectivity but did not seem to impart significant anion permeability (Kirsch et al., 1995). Neutralization of the homologous D292 (D0′) in a Ca2+-activated BK channel (hslo; D292N) markedly reduced inward cation conductance and decreased channel open time but again there were no reports of changes in anion–cation selectivity (Haug et al., 2004). In fact, we are unaware of any reports where significant changes to anion permeation have been observed in response to mutations to this charged residue, or any other residue in the permeation pathway of P-loop channels. The structure of the KcsA channel indicates that the side chain of the D0′ (D80) residue points toward the protein interior, forming a carboxyl–carboxylate pair with the pore helix residue, E71 (Zhou et al., 2001). However, we suggest for the CNG channel that the 0′ side chain interacts more directly with the permeating ion in the CNG channel than it does in the KcsA channel.
In addition to the changes in ion charge selectivity described above, the cGMP-activated currents in the mutant E0′K and E0′R channels were generally very considerably smaller than those of WT channels. A large part of this appears to be due to the radical decrease in single channel conductance (Table I), although decreases in maximal open probability seemed apparent and are likely to also contribute to the reduced macroscopic currents. Mutations of this negatively charged E0′ residue in other CNG channels also showed decreased currents and decreases in single channel conductance. In bovine rod CNGA1 channels, mutations to asparagine (E363N; E0′N) reduced single channel conductance from ∼27 pS for WT channels to ∼15 pS, and to ∼1–2 pS for mutations to glutamine (E0′Q) and alanine (E0′A) (Sesti et al., 1995a,b ; Bucossi et al., 1996). In contrast, the conservative mutation to aspartate (E0′D) actually increased the single channel conductance (Sesti et al., 1995a). In addition, the E0′Q and E0′N mutations also removed the Li+– Cs+ anomalous mole fraction effect (Sesti et al., 1995b), implying that the presence of charged E0′ residues gave rise to multiple-ion occupancy of this region of the pore. Channel open probability is also significantly influenced by this 0′ residue. For example, channel open probability was reduced from ∼80% in WT channels to 10% in the glycine mutant (E0′G) at + 60 mV (Bucossi et al., 1996) and was shown to be highly voltage dependent in the E0′N mutant channels, varying from ∼40% at +100 mV to only ∼6% at −100 mV (Sesti et al., 1995a). In the E0′G (E340G) mutant of the bovine olfactory CNGA2 channel, the channel open probability in the presence of saturating cAMP decreased to 23% from a WT value of 99% at +80 mV (Gavazzo et al., 2000).
In summary, our results show for CNG channels that changing the polarity of the side chain charge of the P-loop residue at 0′ from negative to positive, switches their selectivity from cation selective to anion selective. We speculate that this 0′ residue is at the extracellular edge of the selectivity filter in the most constricted part of the pore (Fig. 11) in these CNG channels, and that it is the polarity of its side chain, rather than the electrostatic environment of the pore helix dipoles, that determines the ion charge selectivity of the channels.
Acknowledgments
We again acknowledge the contributions particularly of Drs. Zhu, Bieri, and Kaur and Prof. Cunningham, in addition to those of some of the authors of this paper, to the earlier preliminary investigation of the E0′K mutation.
This work was supported by the Australian Research Council and by the National Health and Medical Research Council of Australia.
Olaf S. Andersen served as editor.
Abbreviations used in this paper: CNG, cyclic nucleotide-gated; GHK, Goldman-Hodgkin-Katz; P-loop, pore loop; WT, wild-type.
References
- Barry, P.H. 1994. JPCalc - a software package for calculating liquid junction potential corrections in patch-clamp, intracellular, epithelial and bilayer measurements and for correcting junction potential measurements. J. Neurosci. Methods. 51:107–116. [DOI] [PubMed] [Google Scholar]
- Barry, P.H., and J.W. Lynch. 2005. Ligand-gated channels. IEEE Trans. Nanobioscience. 4:70–80. [DOI] [PubMed] [Google Scholar]
- Becchetti, A., K. Gamel, and V. Torre. 1999. Cyclic nucleotide-gated channels: pore topology studied through the accessibility of reporter cysteines. J. Gen. Physiol. 114:377–392. [DOI] [PMC free article] [PubMed] [Google Scholar]
- Bönigk, W., J. Bradley, F. Müller, F. Sesti, I. Boekhoff, G.V. Ronnet, U.B. Kaupp, and S. Frings. 1999. The native rat olfactory cyclic nucleotide-gated channel is composed of three distinct subunits. J. Neurosci. 19:5332–5347. [DOI] [PMC free article] [PubMed] [Google Scholar]
- Bradley, J., J. Li, N. Davidson, H.A. Lester, and K. Zinn. 1994. Heteromeric olfactory cyclic nucleotide-gated channels: a subunit that confers increased sensitivity to cAMP. Proc. Natl. Acad. Sci. USA. 91:8890–8894. [DOI] [PMC free article] [PubMed] [Google Scholar]
- Bucossi, G., E. Eismann, F. Sesti, M. Nizzari, M. Seri, U.B. Kaupp, and V. Torre. 1996. J. Physiol. 493:409–418. [DOI] [PMC free article] [PubMed] [Google Scholar]
- Carland, J.E., A.J. Moorhouse, P.H. Barry, G.A.R. Johnston, and M. Chebib. 2004. Charged residues at the 2′ position of human GABAC ρ1 receptors invert ion selectivity and influence open state probability. J. Biol. Chem. 279:54153–54160. [DOI] [PubMed] [Google Scholar]
- Chatelain, F.C., N. Alagem, Q. Xu, R. Pancaroglu, E. Reuveny, and D.L. Minor. 2005. The pore helix dipole has a minor role in inward rectifier channel function. Neuron. 47:833–843. [DOI] [PMC free article] [PubMed] [Google Scholar]
- Chen, C., and H. Okayama. 1987. High efficiency expression of mammalian cells by plasmid DNA. Mol. Cell. Biol. 7:2745–2751. [DOI] [PMC free article] [PubMed] [Google Scholar]
- Dhallan, R.S., K.-W. Yau, K.A. Schrader, and R.R. Reed. 1990. Primary structure and functional expression of a cyclic nucleotide-activated channel from olfactory neurons. Nature. 347:184–187. [DOI] [PubMed] [Google Scholar]
- Doyle, D.A., J. Morais Cabral, R.A. Pfuetzner, A. Kuo, J.M. Gulbis, S.L. Cohen, B.T. Chait, and R. MacKinnon. 1998. The structure of the potassium channel: molecular basis of K+ conduction and selectivity. Science. 280:69–77. [DOI] [PubMed] [Google Scholar]
- Dzeja, C., V. Hagen, U.B. Kaupp, and S. Frings. 1999. Ca2+ permeation in cyclic nucleotide-gated channels. EMBO J. 18:131–144. [DOI] [PMC free article] [PubMed] [Google Scholar]
- Eismann, E., F. Müller, S.H. Heinemann, and U.B. Kaupp. 1994. A single negative charge within the pore region of a cGMP-gated channel controls rectification, Ca2+ blockage, and ion selectivity. Proc. Natl. Acad. Sci. USA. 91:1109–1113. [DOI] [PMC free article] [PubMed] [Google Scholar]
- Fatima-Shad, K., and P.H. Barry. 1993. Anion permeation in GABA- and glycine-gated channels of mammalian cultured hippocampal neurons. Proc. R. Soc. Lond. B. Biol. Sci. 253:69–75. [DOI] [PubMed] [Google Scholar]
- Frings, S. 2001. Chemoelectrical signal transduction in olfactory sensory neurons of air-breathing vertebrates. Cell. Mol. Life Sci. 58:510–519. [DOI] [PMC free article] [PubMed] [Google Scholar]
- Gavazzo, P., C. Picco, E. Eismann, U.B. Kaupp, and A. Menini. 2000. A point mutation in the pore region alters gating, Ca2+ blockage, and permeation of olfactory cyclic nucleotide-gated channels. J. Gen. Physiol. 116:311–326. [DOI] [PMC free article] [PubMed] [Google Scholar]
- Gray, P.T.A. 1994. Analysis of whole cell currents to estimate the kinetics and amplitude of underlying events: relaxation and ‘noise’ analysis. In Microelectrode Techniques. Second edition. D. Ogden, editor. The Company of Biologists, Cambridge. 189–207.
- Hamill, O.P., A. Marty, E. Neher, B. Sakmann, and F.J. Sigworth. 1981. Improved patch clamp techniques for high resolution current recording from cells and cell-free membrane-patches. Pflugers Arch. 391:85–100. [DOI] [PubMed] [Google Scholar]
- Haug, T., D. Sigg, S. Ciani, L. Toro, E. Stephani, and R. Olcese. 2004. Regulation of K+ flow by a ring of negative charges in the outer pore of BKCa channels. Part I: aspartate 292 modulates K+ conduction by external surface charge effect. J. Gen. Physiol. 124:173–184. [DOI] [PMC free article] [PubMed] [Google Scholar]
- Heginbotham, L., E. Odessey, and C. Miller. 1997. Tetrameric stoichiometry of a prokaryotic K+ channel. Biochemistry. 36:10335–10342. [DOI] [PubMed] [Google Scholar]
- Heinemann, S.H. 1995. Guide to data acquisition and analysis. In Single-channel Recording. Second edition. B. Sakmann, E. Neher, editors. Plenum Press, New York. 53–91.
- Hille, B. 2001. Ion Channels of Excitable Membranes. Third edition. Sinauer Associates, Sunderland, MA. 814 pp.
- Ho, S.N., H.D. Hunt, R.M. Horton, J.K. Pullen, and L.R. Pease. 1989. Site-directed mutagenesis by overlap extension using the polymerase chain reaction. Gene. 77:51–59. [DOI] [PubMed] [Google Scholar]
- Kaupp, U.B., and R. Seifert. 2002. Cyclic nucleotide-gated ion channels. Physiol. Rev. 82:769–824. [DOI] [PubMed] [Google Scholar]
- Kaupp, U.B., T. Niidome, T. Tanabe, S. Terada, W. Bönigk, W. Suhmer, N. Cook, K. Kangawa, H. Matsuo, T. Hirose, and S. Numa. 1989. Primary structure and functional expression from complementary DNA of the rod photoreceptor cyclic GMP-gated channel. Nature. 342:762–766. [DOI] [PubMed] [Google Scholar]
- Keramidas, A., A.J. Moorhouse, K.D. Pierce, P.R. Schofield, and P.H. Barry. 2002. Cation-selective mutations in the M2 domain of the inhibitory glycine receptor channel reveal determinants of ion charge selectivity. J. Gen. Physiol. 119:393–410. [DOI] [PMC free article] [PubMed] [Google Scholar]
- Keramidas, A., A.J. Moorhouse, P.R. Schofield, and P.H. Barry. 2004. Review. Ligand-gated ion channels: mechanisms underlying ion selectivity. Prog. Biophys. Mol. Biol. 86:161–204. [DOI] [PubMed] [Google Scholar]
- Kirsch, G.E., J.M. Pascual, and C.-C. Shieh. 1995. Functional role of a conserved aspartate in the external mouth of voltage-gated potassium channels. Biophys. J. 68:1804–1813. [DOI] [PMC free article] [PubMed] [Google Scholar]
- Körschen, H.G., M. Illing, R. Seifert, F. Sesti, A. Williams, S. Gotzes, C. Colville, F. Müller, A. Dose, M. Godde, et al. 1995. A 240 kDa protein represents the complete β subunit of the cyclic nucleotide-gated channel from rod photoreceptor. Neuron. 15:627–636. [DOI] [PubMed] [Google Scholar]
- Li, J., and H.A. Lester. 1999. Single-channel kinetics of the rat olfactory cyclic nucleotide-gated channel expressed in Xenopus oocytes. Mol. Pharmacol. 55:883–893. [PubMed] [Google Scholar]
- MacKinnon, R. 1995. Minireview. Pore loops: an emerging theme in ion channel structure. Neuron. 14:889–892. [DOI] [PubMed] [Google Scholar]
- Moorhouse, A.J., A. Keramidas, A. Zaykin, P.R. Schofield, and P.H. Barry. 2002. Single channel analysis of conductance and rectification in cation-selective, mutant glycine receptor channels. J. Gen. Physiol. 119:411–425. [DOI] [PMC free article] [PubMed] [Google Scholar]
- Nevin, S.T., J.L. Haddrill, and J.W. Lynch. 2000. A pore-lining glutamic acid in the rat olfactory cyclic nucleotide-gated channel controls external spermine block. Neurosci. Lett. 296:163–167. [DOI] [PubMed] [Google Scholar]
- Qu, W., X.O. Zhu, A.J. Moorhouse, S. Bieri, A.M. Cunningham, and P.H. Barry. 2000. Ion permeation and selectivity of wild-type recombinant rat CNG (rOCNC1) channels expressed in HEK293 cells. J. Membr. Biol. 178:137–150. [DOI] [PubMed] [Google Scholar]
- Robinson, R.A., and R.H. Stokes. 1965. Electrolyte Solutions. Second edition. Butterworths, London. 571 pp.
- Roncaglia, P., and A. Becchetti. 2001. Cyclic-nucleotide-gated channels: pore topology in desensitizing E19A mutants. Pflügers Arch. 441:772–780. [DOI] [PubMed] [Google Scholar]
- Root, M.J., and R. MacKinnon. 1993. Identification of an external divalent cation-binding site in the pore of a cGMP-activated channel. Neuron. 11:459–466. [DOI] [PubMed] [Google Scholar]
- Roux, B., S. Bernèche, and W. Im. 2000. Ion channels, permeation, and electrostatics: insight into the function of KcsA. Biochemistry. 39:13295–13306. [DOI] [PubMed] [Google Scholar]
- Roux, B., and R. MacKinnon. 1999. The cavity and pore helices in the KcsA K+ channel: electrostatic stabilization of monovalent cations. Science. 285:100–102. [DOI] [PubMed] [Google Scholar]
- Schild, D., and D. Restrepo. 1998. Transduction mechanisms in vertebrate olfactory receptor cells. Physiol. Rev. 78:429–466. [DOI] [PubMed] [Google Scholar]
- Schrempf, H., O. Schmidt, R. Kummerlen, S. Hinnah, D. Muller, M. Betzler, T. Steinkamp, and R. Wagner. 1995. A prokaryotic potassium ion channel with two predicted transmembrane segments from Streptomyces lividans. EMBO J. 14:5170–5178. [DOI] [PMC free article] [PubMed] [Google Scholar]
- Sesti, F., U.B. Kaupp, E. Eismann, M. Nizzari, and V. Torre. 1995. a. Glutamate 363 of the cyclic GMP-gated channel controls both the single conductance and the open probability. Biophys. J. 68:A243. [Google Scholar]
- Sesti, F., E. Eismann, U.B. Kaupp, M. Nizzari, and V. Torre. 1995. b. The multi-ion nature of the cGMP-gated channel from vertebrate rods. J. Physiol. 487:17–36. [DOI] [PMC free article] [PubMed] [Google Scholar]
- Tempel, B.L., D.M. Papazian, T.L. Schwarz, Y.N. Jan, and L.Y. Jan. 1987. Sequence of a probable potassium channel component encoded at Shaker locus of Drosophila. Science. 237:770–775. [DOI] [PubMed] [Google Scholar]
- Wolf, A.V., M.G. Brown, and P.G. Prentiss. 1980. Concentration properties of aqueous solutions: conversion tables. In CRC Handbook of Chemistry and Physics. 61st edition. R.C. Weast and M.J. Astle, editors. CRC Press, Boca Raton, FL. D-227–D-276.
- Zhou, Y., J.H. Morais-Cabral, A. Kaufman, and R. MacKinnon. 2001. Chemistry of ion coordination and hydration revealed by a K+ channel-Fab complex at 2.0 Å resolution. Nature. 414:43–48. [DOI] [PubMed] [Google Scholar]


