

Abstract
We present here evidence for the enhancement, at rest, of an inositol 1,4,5-trisphosphate (IP3)–mediated calcium signaling pathway in myotubes from dystrophin-deficient cell lines (SolC1(−)) as compared to a cell line from the same origin but transfected with mini-dystrophin (SolD(+)). With confocal microscopy, the number of sites discharging calcium (release site density [RSD]) was quantified and found more elevated in SolC1(−) than in SolD(+) myotubes. Variations of membrane potential had no significant effect on this difference, and higher resting [Ca2+]i in SolC1(−) (Marchand, E., B. Constantin, H. Balghi, M.C. Claudepierre, A. Cantereau, C. Magaud, A. Mouzou, G. Raymond, S. Braun, and C. Cognard. 2004. Exp. Cell Res. 297:363–379) cannot explain alone higher RSD. The exposure with SR Ca2+ channel inhibitors (ryanodine and 2-APB) and phospholipase C inhibitor (U73122) significantly reduced RSD in both cell types but with a stronger effect in dystrophin-deficient SolC1(−) myotubes. Immunocytochemistry allowed us to localize ryanodine receptors (RyRs) as well as IP3 receptors (IP3Rs), IP3R-1 and IP3R-2 isoforms, indicating the presence of both RyRs-dependent and IP3-dependent release systems in both cells. We previously reported evidence for the enhancement, through a Gi protein, of the IP3-mediated calcium signaling pathway in SolC1(−) as compared to SolD(+) myotubes during a high K+ stimulation (Balghi, H., S. Sebille, B. Constantin, S. Patri, V. Thoreau, L. Mondin, E. Mok, A. Kitzis, G. Raymond, and C. Cognard. 2006. J. Gen. Physiol. 127:171–182). Here we show that, at rest, these regulation mechanisms are also involved in the modulation of calcium release activities. The enhancement of resting release activity may participate in the calcium overload observed in dystrophin-deficient myotubes, and our findings support the hypothesis of the regulatory role of mini-dystrophin on intracellular signaling.
INTRODUCTION
Duchenne muscular dystrophy (DMD) is the most frequent of genetic diseases (1 boy in 3,500) and affects all muscles (skeletal, smooth, and cardiac). This progressive disease is characterized by the absence of dystrophin due to a defect in the p21 band of the X chromosome (Monaco et al., 1986). Dystrophin is a 427-kD cytoskeletal protein normally expressed at the inner surface of the sarcolemma of muscle fibers (Hoffman et al., 1987) and associated with a large complex of proteins known as the dystrophin-associated proteins (DAPs) (Ervasti and Campbell, 1991). In 1955, Becker and Kiener described another form of progressive muscular dystrophy, the Becker muscular dystrophy (BMD), associated later with the expression of a truncated 229-kD protein, namely mini-dystrophin. It has been shown that the small size of the gene encoding for mini-dystrophin facilitated its expression via a retroviral vector, allowing functional recovery in mdx mice (Deconinck et al., 1996).
In DMD patients, the lack of dystrophin leads to muscle degeneration and progressive weakness. It was proposed that, in dystrophic cells, absence of dystrophin leads to abnormal elevation of the cytosolic resting calcium level (Bodensteiner and Engel, 1978; Imbert et al., 1995). How the absence of dystrophin leads to the cytosolic calcium overload at the origin of the extensive muscle degeneration at the late stages of DMD is still poorly understood. Presently, there is little data concerning a possible role of Ca2+ stored in the SR in calcium mishandling observed in dystrophic cells (Liberona et al., 1998). Furthermore, modifications in the regulation of internal calcium stores have been suggested to be involved in the general calcium disregulation in DMD (Divet and Huchet-Cadiou, 2002; Vandebrouck et al., 2002).
Excitation–contraction coupling in skeletal muscle takes place by release of stored calcium from the SR via ryanodine receptors (RyRs). This release is triggered by an allosteric signal transmitted to the release channels from the dihydropyridine receptors (DHPRs) (Rios and Pizarro, 1991; Ursu et al., 2001; Lorenzon et al., 2004). The presence of IP3 receptors in cultured muscle (Liberona et al., 1998, Powell et al., 2001) and in adult skeletal muscle (Moschella et al., 1995, Salanova et al., 2002) also suggests a role for IP3 signals in both nuclear and cytoplasmic compartments. These cascades result in the up-regulation of gene activity (Powell et al., 2001, Carrasco et al., 2003). An IP3 signaling pathway, which depends on the voltage sensor of the DHPR, was then proposed in cultured muscle (Araya et al., 2003, Eltit et al., 2006).
Previous studies have shown significant local quantal Ca2+ release events at rest using laser scanning confocal fluorescence microscopy (Cheng et al., 1993). RyR channels are known to contribute to these events (Lipp and Niggli, 1994; Mackenzie et al., 2001), and their concerted opening and closing result in a miniature Ca2+ release event called a spark (Lacampagne et al., 1998; Shirokova et al., 1999; Conklin et al., 2000; Kettlun et al., 2003). In mammals, Ca2+ sparks have been described in smooth muscle (Mironneau et al., 1996; Gordienko et al., 1998; Jaggar et al., 2000), cardiac muscle (Niggli, 1999; Cordeiro et al., 2001; Lipp et al., 2002), and skeletal muscle cells (Cheng et al., 1999; Shirokova et al., 1999; Zhou et al., 2003). In smooth muscle cells, sites of spontaneous Ca2+ sparks may coincide with sites of IP3-induced Ca2+ release, suggesting possible intercommunication between RyRs and IP3Rs in functional microdomains (Gordienko and Bolton, 2002; Zhang et al., 2003). In cardiac muscle, spatio-temporal recruitment of Ca2+ sparks underlies the global Ca2+ signal that subsequently activates myocyte contraction. In these cells, activation of IP3Rs that colocalize with RyRs (Lipp et al., 2000) causes the appearance of spontaneous subsarcolemmal Ca2+ sparks (Bootman et al., 2002; Mackenzie et al., 2002). In developing or mature skeletal muscle cells, it is still unknown if IP3Rs could contribute in the initiation and/or propagation of spontaneous calcium release events.
In our previous works using a Sol cell line, intrinsically lacking dystrophin (Sol8 or SolC1(−)), we had selected stable Sol8 subclones, SolD(+), which constitutively express the BMD mini-dystrophin (Marchand et al., 2004). Myotubes from the SolC1(−) cell line exhibited morphological signs of cell death during myogenesis in culture, in parallel with an alteration of Ca2+ homeostasis. Furthermore, expression of BMD mini-dystrophin restored sarcolemmal expression and location of several members of the DAPs complex and allowed these cells to recover an intracellular Ca2+ concentration closer to myotubes from mouse primary cell culture. We also reported evidence for the enhancement of the IP3-mediated calcium signaling pathway in SolC1(−) as compared with SolD(+) myotubes (Balghi et al., 2006). These previous experiments were performed in myotubes stimulated with perfusion of a solution containing high potassium concentration. Global calcium rise observed in this stimulation condition depended on two mechanisms of SR calcium release: a fast SR calcium release, dependent on the RyRs, and a slow release, mediated by IP3Rs. We further demonstrated that the slow release, depending on the regulation of a Gi protein, was increased in the SolC1(−) as compared with the SolD(+) myotubes.
Here we show that the regulation mechanisms described above during stimulation are also involved in the modulation of resting calcium release. With the use of a parameter describing the density of release sites, a pattern of resting release sites was found to be different in dystrophin-deficient SolC1(−) myotubes and in SolD(+) ones. Experiments conducted in this work demonstrate a modulatory effect of mini-dystrophin, at rest, on spontaneous events of calcium release that depends on the IP3 signaling pathway.
MATERIALS AND METHODS
Cell lines
Sol8 myogenic cell line (a gift from I. Martelly, University of Paris XII, Creteil, France) derived from the Sol8 cell line originally obtained from primary culture of normal C3H mouse soleus muscle (Mulle et al., 1988). The method for obtaining cell lines (SolC1(−) and SolD(+)) was described elsewhere (Marchand et al., 2004). In brief, after several steps of cloning, a dystrophin-deficient cell line was obtained, named SolC1(−). The SolD(+) cell line was obtained by transfection of the SolC1(−) cell line with a retrovirus encoding for mini-dystrophin (229 kD). SolC1(−) and SolD(+) cell lines (“Sol” cell lines in the following text) maintain a high ability to fuse and form myotubes. Cells were seeded on gelatin-coated glass coverslips in plastic dishes. Myoblasts were grown to ∼80% confluence in HamF12/DMEM (1:1) medium supplemented with 10% FCS, 1% l-glutamine, and 1% antibiotics. To induce differentiation, the growth medium was changed to a fusion medium (DMEM supplemented with 2% heat inactivated horse serum, insulin [10 μg/ml, Sigma-Aldrich], 1% l-glutamine, and 1% antibiotics). Experiments were performed at the stage of F+4 (4 d after addition of fusion medium) for SolC1(−) and SolD(+) myotubes.
Confocal Ca2+ Measurement
Ca2+ activity was recorded by confocal laser scanning microscopy using a Bio-Rad Laboratories MRC 1024 equipped with a 15-mW Ar/Kr gas laser. The confocal unit was attached to an inverted microscope (Olympus IX70). Fluorescence signal collection was performed through the control software Lasersharp 3.2 (Bio-Rad Laboratories). Myotubes were loaded with 3 μM fluo-4 acetoxymethyl (AM) ester (Molecular Probes) for 15 min at room temperature (20°C) in a resting solution (130 mM NaCl, 5.4 mM KCl, 2.5 mM CaCl2, 0.8 mM MgCl2, 10 mM HEPES, and 5.6 mM glucose, pH 7.4).
Two types of experiments have been performed. First, Ca2+ sparks were identified on two-dimensional images (512 × 512 pixels) with a 60× oil immersion objective (1.4 numerical aperture) and were acquired in line scan mode (x,t images: 1 line/2 ms, 512 × 512 pixels) taking fluorescence variations along a space line as a function of time. Second, density of release sites was obtained by recording sequences of 30–50 images (256 × 256 pixels) with a 20× objective in fast scanning mode. The time resolution was 300 ms for each pixel position.
Ryanodine (Sigma-Aldrich) was incubated at 100 μM for 10 min to inhibit RyRs. For IP3 inhibition studies, myotubes were incubated for 30 min in 50 μM 2-APB (Calbiochem) or for 20 min in the presence of 10 μM U73122 (Sigma-Aldrich). Pertussis toxin (Calbiochem) was incubated at 1 μg/ml for 1 h.
Intracellular Calcium Concentration Measurements
Intracellular free calcium measurements were performed by means of a ratiometric fluorescence method using an OSP100 microscopic photometry system (Olympus) and the calcium fluorescent probe Indo-1. The ratiometric method and the calibration procedure have been published elsewhere (Grynkiewicz et al., 1985; Cognard et al., 1993). The two emission fluorescence values of the free and Ca2+-bound forms of Indo-1 (at 485 and 405 nm, respectively) were separated, filtered, and collected by two photomultipliers. The intracellular free calcium concentrations were calculated from the following equation: [Ca2+]i = Kd × β × [(R − Rmin)/(Rmax − R)] (Grynkiewicz et al., 1985). All the experiments were performed at room temperature. In brief, cells were rinsed with standard external solution (130 mM NaCl, 5.4 mM KCl, 2.5 mM CaCl2, 0.8 mM MgCl2, 10 mM HEPES, 5.6 mM d-glucose, pH 7.4 with NaOH) and incubated for 45 min at room temperature in the same solution supplemented with 3 μM (final concentration) of the acetoxy-methyl ester form of Indo-1 (Indo-1/AM; Sigma-Aldrich). BAPTA-AM (Sigma-Aldrich) was used at different concentrations: 100 nM, 300 nM, 1 μM, 3 μM, and 10 μM.
Image Processing
Calcium images were analyzed with two different computer programs developed in our laboratory under IDL 5.3 structured language.
Line-scan Image Processing.
Ca2+ sparks were analyzed using the HARVELE software (Sebille et al., 2005), which automatically detects local Ca2+ release events on a series of x,t images. For each spark, five parameters were determined: ΔF/F0 (normalized maximum amplitude of fluorescence), rise time (RT) in ms, FWHM (full width at half maximum) in μm, FDHM (full duration at half maximum) in ms, and frequency in sparks/s. The frequency parameter represents here the frequency of the occurring of several events in each site measured with line scan recording and reveals the intrinsic kinetics properties of releasing sites. Parameters were represented as distribution histograms.
Density of Release Sites.
Sequences of images in fast mode were analyzed with a program allowing us to calculate the standard deviation of the recorded fluorescence in each pixel as a function of time. During the acquisition sequence, when several releases were observed in the same location, the calculated standard deviation of pixels in this location was higher than in areas without calcium increase. The result obtained was an image with discrete spots of elevated standard deviation (see Results and Fig. 3) on which it was easy to count the number of release sites in the sequence. From that process a parameter can be derived that describes the density of release sites in myotubes: the number of events/μm2 (in μm−2).
Figure 3.

Density of release sites in myotubes from SolC1(−) and SolD(+). Time sequences of 30–50 fast confocal images (1 image every 300 ms) have been recorded in fluo-4–loaded myotubes from both cell types. (A and B) Two different fast-recorded images extracted from a sequence with spots of fluorescence in two distinct myotubes (as indicated by white arrows). Each spot corresponds to a localized calcium release event. Sequences of images in fast mode were analyzed with a program allowing us to calculate the standard deviation of the recorded fluorescence in each pixel as a function of time. (C) Image resulting from this analysis. From that process, the number of sites was counted and the density of calcium release sites (i.e., the number of sites/μm2 [in μm−2]) was determined for both Sol myotubes. Bar, 15 μm.
Immunological Staining
Cultured cells were stained by an indirect immunofluorescence method. Cells were rinsed in TBS (20 mM Tris base, 154 mM NaCl, 2 mM EGTA, 2 mM MgCl2, pH 7.5) and fixed with either 4% paraformaldehyde (PFA) in TBS for 20 min or methanol (stored at −20°C) for 6 min, at room temperature. Only samples fixed with PFA were permeabilized with TBS/0.5% Triton X-100 for 10 min. Calbiochem supplied the anti-RyR. Affinity Bioreagents supplied the anti–IP3R-1 (the same was used for Western blot) and the anti–IP3R-2 epitope affinity–purified polyclonal antibodies (1:250, PA1-901 and 1:100, PA1-904 respectively). No commercial anti–IP3R-3 antibody was available for us to perform immunolocalization of this isotype. Cells were incubated with primary antibodies in TBS/1% BSA (Sigma-Aldrich) for 1 h. After washing in TBS, cells were incubated for 30 min with the secondary antibody Rhodamine red-X (RRX) conjugated goat anti-rabbit (1:200, Jackson ImmunoResearch Laboratories) and/or secondary antibody FITC-conjugated goat anti-mouse (1:200, Jackson ImmunoResearch Laboratories). Samples were mounted in Vectashield Medium (Vector Laboratories, Inc.) for viewing with a confocal laser scanning microscope using a Bio-Rad Laboratories MRC 1024. Immunostaining images were processed (no gamma adjustment) and assembled in Powerpoint 2000.
Statistical Analysis
All results are expressed as mean ± SEM of n observations. Sets of data were compared using Student's t test. All statistical tests were performed using GraphPad Prism version 3.0 or 4.0 for Windows (GraphPad Software).
RESULTS
Morphology of Calcium Release Events in Sol Cells
In previous experiments, several calcium release properties were revealed in myotubes from the dystrophin-deficient SolC1(−) cell line and the SolD(+) cell line (expressing mini-dystrophin). First, fluo-4–loaded SolC1(−) myotubes exhibited large calcium release and spontaneously propagating Ca2+ waves (Marchand et al., 2004). Second, we demonstrated that global calcium rise, induced by the perfusion of a solution containing a high potassium concentration, was higher in SolC1(−) than in SolD(+) myotubes (Balghi et al., 2006). Finally, in recent observations, both cell types displayed spontaneously discrete release events at rest with very different apparent activity between the two cell types. The aim of the present study was to examine resting release events recorded in SolC1(−) and SolD(+) myotubes in order to compare them in the two cell types.
After incubation of myotubes with fluo4-AM, Ca2+ release events were localized on x,y images and were recorded in a line scan mode (x,t images). These events were analyzed using the HARVELE software developed in our lab (Sebille et al., 2005) that first allows an automated detection of signals in x,t images and second calculates morphological parameters of each detected event. Fig. 1 displays examples of line-scan recordings in SolC1(−) (Fig. 1 A) and in SolD(+) myotubes (Fig. 1 B). Fig. 1 (C and D) illustrates the software process for measuring morphological parameters. For each selected spark, four morphological parameters were determined: the normalized difference between the fluorescence of the peak and the background (ΔF/F0: amplitude), the rise time (RT in ms) (Fig. 1 C), the FDHM (in ms) and the FWHM (in μm) (Fig. 1 D). These parameters were collected from events recorded in SolC1(−) (733 events) and SolD(+) (280 events), and then sorted for a representation of histogram distribution (Fig. 2). Distributions of spark amplitude, duration, and size were found unsymmetrical due to the inherent property of off-center sampling in line-scan confocal imaging. Parameters from the two populations of events were then compared with the nonparametric Mann-Whitney U test. It is also worth noting that small events (with amplitude value <0.3) were deliberately deselected, due to the measurement errors on these low and noisy signals. Hence, the nonmodal distribution, theoretically demonstrated and found when all sparks are selected (Cheng et al., 1999), was not obtained in our results. With the statistical test, calcium release event duration (FDHM) was found slightly longer in SolC1(−) than in SolD(+) (SolC1(−): median = 64.5 ms; SolD(+): median= 55.2 ms; P = 0.009). The spread (FWHM) was also slightly higher in SolC1(−) than in SolD(+) (SolC1(−): median= 3.31 μm; SolD(+): median = 3.00 μm; P < 0.001). No significant differences were found between the two cell types in amplitude (SolC1(−): median = 0.82; SolD(+): median = 0.80; not significantly different [ns]), rise time parameter (SolC1(−): median = 44.00 ms; SolD(+): median = 44.10 ms; ns), as well as the fifth measured parameter, the frequency (SolC1(−): 1.87 s−1; SolD(+): 1.83 s−1). Therefore, this analysis indicates that Ca2+ calcium release events occurring at rest in SolC1(−) displayed similar morphological properties to those in SolD(+) myotubes.
Figure 1.

Examples of line-scan recordings in SolC1(−) (A) and in SolD(+) (B) fluo-4–loaded myotubes. Space bar (x), 5 μm. Time bar (t), 100 ms. A selected area during the detection is indicated by the white square in A. C and D illustrate the software process for measuring morphological parameters on selected areas. For each selected event, five parameters were determined: the normalized difference between the fluorescence of the peak and the background (ΔF/F0: amplitude), the rise time (RT in ms), the FDHM (in ms), the FWHM (in μm), and the frequency. (C) Profile of one spark in a three-dimensional representation (shaded surface) indicating rise time (RT) and fluorescence amplitude. (D) The white contour represents the half maximum slide on which the FWHM and the FDHM (view from the top) are measured.
Figure 2.
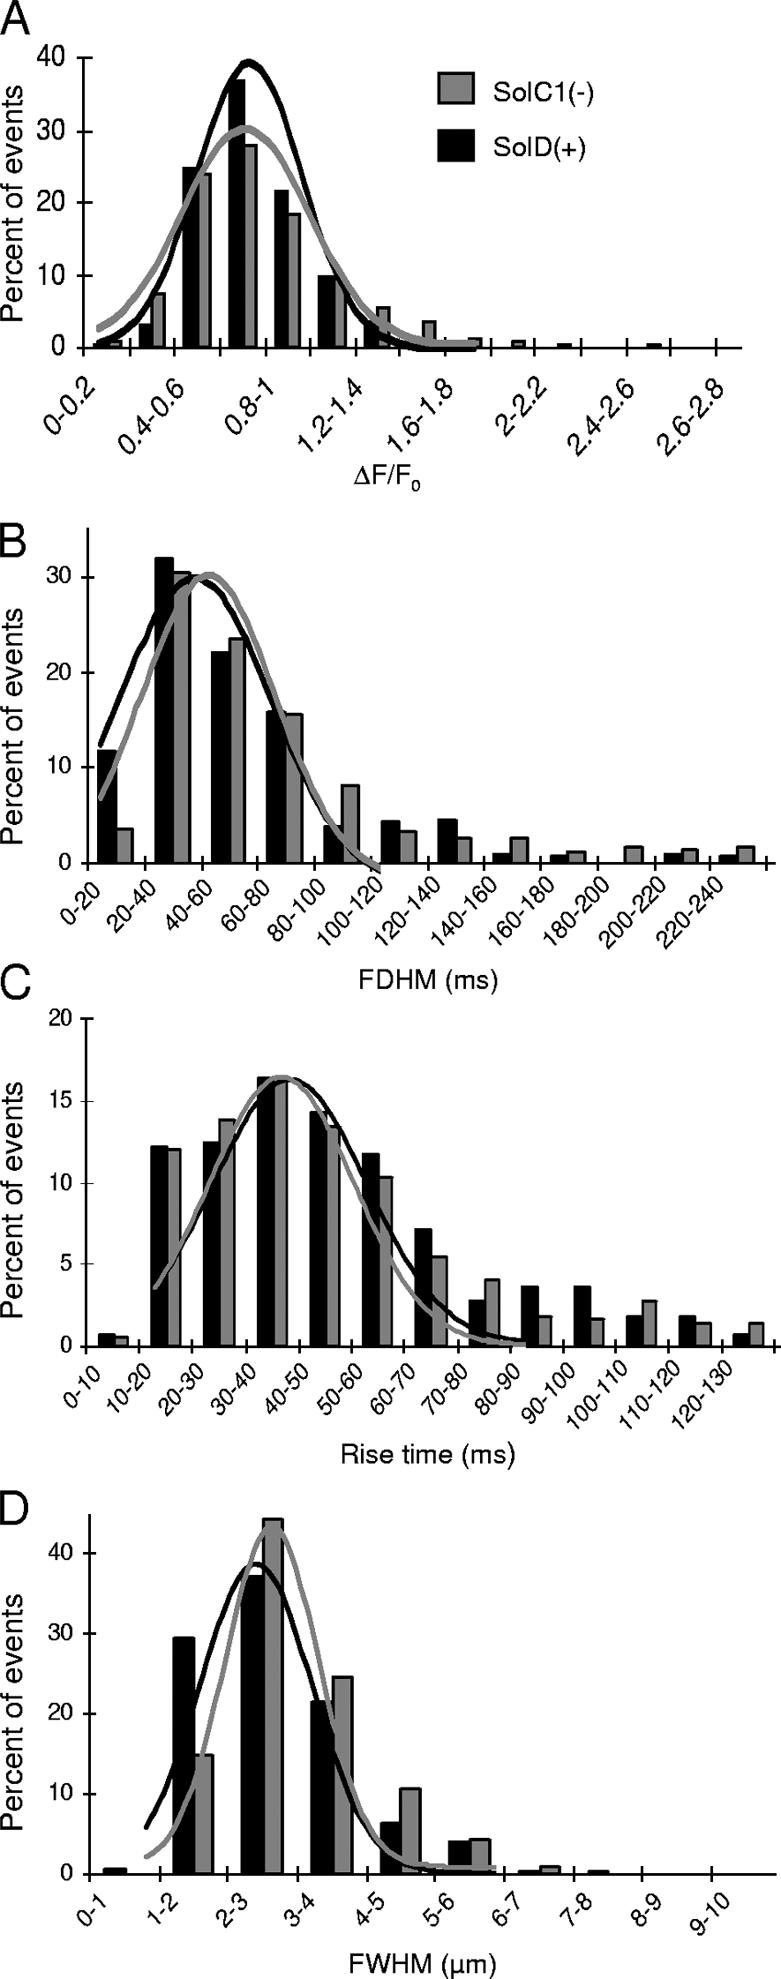
Characterization of calcium event morphology in myotubes from SolC1(−) and SolD(+). Distribution Histograms of ΔF/F0 (A), FDHM (B), RT (C), and FWHM (D) of calcium events identified in SolC1(−) (gray bars, n = 733) and SolD(+) (black bars, n = 280) myotubes. Each bin includes the upper value. For illustrative purposes, distributions were fitted by Gaussian profiles. Median values were calculated and differences were evaluated with the nonparametric Mann-Whitney U test. Coefficient variations for distributions were as follows: SolC1(−): ΔF/F0, 42%; FDHM, 63%; RT, 52%; FWHM, 31%; and SolD(+): ΔF/F0, 28%; FDHM, 62%; RT, 49%; FWHM, 35%.
SolC1(−) Exhibited More Sites of Calcium Release than SolD(+)
In our preliminary experiments, we observed that the number of sites discharging calcium was more elevated in SolC1(−) than in SolD(+) myotubes. To quantify this difference, time sequences of fast confocal images have been recorded in fluo-4–loaded myotubes from both cell types. Hence, in each sequence, 30–50 fluorescence images with 300-ms time resolution (time between two fluorescence acquisitions for each pixel position) were recorded on the same microscope field in myotube preparations. As examples, Fig. 3 (A and B) displays two different fast-recorded images extracted from a sequence with spots of fluorescence in two distinct myotubes (as shown with white arrows). Each spot, corresponding to a localized calcium release event, is observed in one image of the sequence, and several events can originate from the same location in the field during the acquisition sequence. Sequences of images in fast mode were analyzed with a program allowing us to calculate the standard deviation of the recorded fluorescence in each pixel as a function of time. During the acquisition sequence, when several releases were observed in the same location, the calculated standard deviation of pixels in this location was more elevated as compared with areas without calcium increase. The result obtained was an image with discrete spots of elevated standard deviation (Fig. 3 C) on which it was easy to visually count the number of sites of release in the sequence. From that process, a parameter can be derived that describes the density of calcium release sites in myotubes (RSD in the following text): the number of sites/μm2 (in μm−2). At rest, in physiological conditions corresponding to a 5.4 mM external potassium concentration, SolC1(−) and SolD(+) myotubes exhibited 1.43 ± 0.17 10−4 and 0.72 ± 0.12 10−4 sites/μm2, respectively. Further experiments have then been performed to explore these differences.
Membrane Potential and Density of Release Sites
To understand a possible role of membrane potential in these activities, RSD was measured with various extracellular [K+] solutions, known to modify membrane potential of myotubes. Perfusion of low extracellular K+ solutions (2 mM: hyperpolarizing solution) or high K+ solutions (10 and 20 mM: depolarizing solutions) only weakly modified the number of sites/μm2 in SolC1(−) and SolD(+) myotubes. In each case, SolC1(−) exhibited higher values than SolD(+) myotubes (Fig. 4). With the patch clamp technique, application of a current clamp protocol for measuring membrane potential in whole cell configuration demonstrated both similar resting potentials in SolC1(−) and SolD(+) and confirmed hyperpolarizing and depolarizing effects of perfusions (unpublished data). Variations of membrane potential had no significant effects on RSD in our cellular models. Moreover, no change in calcium release event frequency has been detected during these experiments (unpublished data).
Figure 4.

Membrane potential and density of release site. RSD was measured with various extracellular [K+] solutions, known to modify membrane potential in SolC1(−) (squares) and SolD(+) (triangles) myotubes. Perfusion of low extracellular K+ solutions (2 mM: hyperpolarizing solution) or high K+ solutions (10 and 20 mM: depolarizing solutions) weakly modified the number of sites/μm2 in SolC1(−) and SolD(+) myotubes. In each case, SolC1(−) exhibited higher values than SolD(+) myotubes (Fig. 4). For each point, the number of myotubes analyzed is given near the symbol. Variations of membrane potential had no significant effect on RSD in our cellular models.
Effect of Calcium Levels on Resting Calcium Release Site Density
Previous results demonstrated higher resting [Ca2+]i in SolC1(−) myotubes as compared with SolD(+) myotubes (Marchand et al., 2004), and it is also well known that calcium release channels are calcium sensitive. To determine if such elevated calcium levels in dystrophin-deficient cells could explain per se a higher RSD, experiments with modified resting [Ca2+]i were conducted. Myotube preparations were incubated with various concentrations of BAPTA-AM (100 nM, 300 nM, 1 μM, 3 μM, and 10 μM), maintaining various calcium levels by chelating different amounts of intracellular free Ca2+. Subsequently, two sets of experiments were performed as follows. First, intracellular free calcium concentrations were determined with a ratiometric fluorescence method using a microscopic photometry system and the calcium probe Indo-1. Second, density of release sites was measured with confocal microscopy and fluo-4. Both sets of experiments were performed in each BAPTA-AM incubation condition and Fig. 5 depicts measured RSD as a function of [Ca2+]i in both SolC1(−) and SolD(+) myotubes. Starting from the control conditions, incubation with increased [BAPTA-AM] in both myotube types resulted in a decrease of resting [Ca2+]i (50 nM [Ca2+]i with 10 μM chelator). The density of calcium release events, which was more elevated in SolC1(−) (squares) than in SolD(+) (triangles) in control conditions (arrows), was reduced in both cells when [BAPTA-AM] was increased in the incubation medium. It is also worth noting that in both cells, RSD measured in controls was maintained even when a significant reduction in [Ca2+]i was observed. For example, in SolC1(−), the same RSD value was observed at 80 nM [Ca2+]i and 140 nM [Ca2+]i (control). At lower concentrations, event density was strongly reduced within a short concentration window (20 nM) and the same low RSD value was reached in both cells at low [Ca2+]i levels (50 nM). Nevertheless, sigmoid patterns of calcium release event site extinction were different between the dystrophin-deficient SolC1(−) and the mini-dystrophin–transfected SolD(+) cells. Indeed, RSD decreased at [Ca2+]i lower than 85 nM and 95 nM in SolC1(−) and SolD(+), respectively, and the half-extinction [Ca2+]i value was 60 nM and 80 nM for SolC1(−) and SolD(+), respectively. These results indicated on the one hand that the amount of myoplasmic free calcium had an effect on calcium release event activity in changing the number of calcium release sites. On the other hand, because the calcium-dependent extinction pattern (due to an increased [BAPTA]) was different between SolC1(−) and SolD(+) myotubes, the higher RSD in SolC1(−) in physiological conditions could not be explained by a causal effect of elevated resting [Ca2+]i alone. Finally, these curves demonstrate a more elevated Ca2+ sensitivity of calcium release event activity in dystrophin-deficient myotubes as compared with myotubes expressing mini-dystrophin.
Figure 5.

Release site density as a function of intracellular calcium concentration. The number of calcium release sites was determined using confocal microscopy in SolC1(−) and SolD(+) myotubes incubated with fluo-4-AM and different concentrations of BAPTA-AM. Intracellular calcium concentrations were also determined in SolC1(−) and SolD(+) myotubes, in the same BAPTA-AM conditions using cytofluorimetry technique and the Ca2+ probe Indo-1. Then, RSD obtained for each BAPTA concentration was reported as a function of the intracellular calcium concentration in SolC1(−) (squares) and SolD(+) (triangles) myotubes. For each point, the number of myotubes analyzed is given near the symbol. BAPTA-AM concentrations were 100 nM, 300 nM, 1 μM, 3 μM, and 10 μM incubated for 20 min, as illustrated by a large gray arrowhead on the graph. Data were fitted using Boltzmann equation (black and gray lines).
The “Release Site Density” Parameter Was Modified with the Use of SR Channel Blockers
To determine which types of calcium release channels are involved in calcium release events signaling in Sol cells, several Ca2+ release channel inhibitors were applied in our preparations and RSD was measured (Fig. 6). To completely inhibit Ca2+ release through RyRs, ryanodine was used at 100 μM (Gordienko and Bolton, 2002). Exposure of SolD(+) myotubes to ryanodine for 10 min almost abolished the spontaneous calcium RSD (Fig. 6 A). The same exposure of SolC1(−) myotubes to ryanodine instead spared a substantial density of events. These results suggest, first, a strong sensitivity of the density of calcium release events to ryanodine in SolD(+) myotubes and, second, that a ryanodine-insensitive component of calcium release channels could be involved particularly in SolC1(−) myotubes. We also tested the effect of thapsigargin, an inhibitor of the SR Ca2+-ATPase, on ryanodine-treated Sol cells. In both cells, the subsequent increase of calcium, reflecting the amount of calcium stored in the SR, was similar in ryanodine-treated and untreated cells (unpublished data), indicating that the main effect of ryanodine in our treatment condition was the blockade of RyR calcium channels.
Figure 6.

Effects of ryanodine (100 μM), U73122 (10 μM), and 2-APB (50 μM) on density of release sites. (A) Effects of treatment with ryanodine, incubated at 100 μM for 10 min, on the density of calcium release sites in SolC1(−) (white bars) and SolD(+) (black bars) myotubes. (B) Effect of treatment with U73122 (incubated at 10 μM for 20 min) or 2-APB (incubated at 50 μM for 30 min) on RSD in SolC1(−) (white bars) and SolD(+) (black bars). SolC1(−): control, n = 251; ryanodine, n = 178; 2-APB, n = 195; U73122, n = 213. SolD(+): control, n = 185; ryanodine, n = 193; 2-APB, n = 189; U73122, n = 177. ns, not significantly different. ***, P < 0,001; **, 0.001 ≤ P < 0,01; *, 0.01 ≤ P < 0.05 (Student's t test).
Surprisingly, application of IP3 pathway inhibitors also reduced the RSD value in both SolC1(−) and SolD(+) myotubes. Incubation with 50 μM 2-APB, a direct inhibitor of IP3 receptors, reduced RSD in both myotubes, but particularly in SolC1(−) myotubes (88% decrease, Fig. 6 B, white bars). An identical level of RSD parameter was reached with 2-APB application on SolD(+) myotubes (76% decrease, Fig. 6 B, black bars). A similar decrease was obtained after incubation with the use of a PLC inhibitor (U73122: 10 μM) in both SolC1(−) and SolD(+) myotubes. Furthermore, combination of ryanodine and 2-APB completely inhibited calcium release events in both myotubes (unpublished data).
These functional observations raised questions regarding (a) the involvement of IP3 receptors in the calcium release events signaling occurring at rest and (b) an overactivation of this IP3 signaling pathway in dystrophin-deficient myotubes.
Immunolocalization of Involved SR Calcium Channels
Immunostaining experiments have been conducted in order to localize SR calcium channels that could be involved in these release activities. As shown previously (Marchand et al., 2004), RyRs appeared randomly distributed in Sol myotubes (Fig. 7, A and D) without any alignment on transversal sarcomerization as in fibers. The same distribution of RyRs was observed in SolD(+) myotubes (Fig. 7 B) and in SolC1(−) myotubes (Fig. 7 A). Furthermore, in the same myotubes, immunostaining with antibodies against the isotype 2 of IP3R showed a peripheral and fully cytoplasmic localization in SolC1(−) (Fig. 7 C) and in SolD(+) (Fig. 7 D). As shown by yellow arrows, it is worth noting that locations with elevated staining for IP3R-2 correspond to areas with low staining for RyR in both SolC1(−) (Fig. 7, compare B with A) and SolD(+) myotubes (Fig. 7, compare E with D). This suggests that in these myotubes in maturation, RyRs and IP3Rs could be situated in different and spatially segregated internal membranes. A clear staining of IP3R-1, as shown in primary mouse cultures (Powell et al., 2001), was found in SolC1(−) myotubes (Fig. 7 E). The major part of the staining was observed in the nuclear envelope region (localized around nuclei loaded with the fluorescent TO-PRO-3 probe) and a minor part in the myoplasm. In SolD(+) myotubes (Fig. 7 F), IP3R-1 was also localized in the nuclear envelope region, but the staining was fainter than in SolC1(−). These qualitative data demonstrate that IP3R-1 and IP3R-2 are expressed in SolC1(−) and SolD(+) myotubes. Unfortunately, we were not able to localize the third isoform with the available IP3R-3 antibodies.
Figure 7.

Immunolocalization of RyRs and IP3Rs in SolC1(−) and SolD(+) myotubes. Immunolabelings of SR calcium release channels in SolC1(−) (A–C) and in SolD(+) myotubes (D–F) were observed with laser scanning confocal microscopy (LSCM). The same random distribution of RyRs (anti-RyR; Calbiochem) was observed in SolC1(−) myotubes (A) and in SolD(+) myotubes (D). In the same myotubes, immunostaining with antibodies against IP3R-2 was performed in SolC1(−) (B) and in SolD(+) (E). Yellow arrows, locations corresponding to elevated staining for IP3R-2 and low staining for RyR. IP3R-1 staining is localized in the nuclear envelope region and in the cytoplasm in SolC1(−) (C) and in SolD(+) (F) myotubes. Insets, staining of selected nuclei (dotted squares) loaded with the fluorescent TO-PRO-3 probe. IP3R-1 and IP3R-2 localizations were detected using polyclonal antibodies, PA1-901 and PA1-904, respectively.
These immunocytochemistry analyses, combined with previous results obtained with RT-PCR and Western blot (Balghi et al., 2006), reveal the presence of a potential IP3-dependent calcium release system. The above data indicate the presence of an IP3-mediated system of calcium release in both SolC1(−) (lacking dystrophin) and SolD(+) (expressing mini-dystrophin) myotubes, this system playing a role in intracellular calcium homeostasis not only during stimulation (Balghi et al., 2006) but also continuously at rest.
DISCUSSION
We performed experiments in this study on two types of myotubes originating from the same Sol8 cell line (Marchand et al., 2001): (1) dystrophin-deficient myotubes, SolC1(−) and (2) myotubes transfected to express the BMD mini-dystrophin, SolD(+). When mini-dystrophin was restored, it was observed that, first, the members of the DAPs complex were readdressed and, second, intracellular Ca2+ levels were found similar to those observed in myotubes from mouse primary cell culture (Marchand et al., 2004). This model allows the physiological exploration of two cellular systems with the only difference being the presence (or not) of mini-dystrophin.
We have demonstrated that signaling of resting release events was different in dystrophin-deficient SolC1(−) and in SolD(+) myotubes. The number of sites discharging calcium, quantified with the RSD parameter was more elevated in SolC1(−) than in SolD(+) myotubes. Variations of membrane potential had no significant effect on RSD and differences in resting [Ca2+]i alone (Marchand et al., 2004) cannot explain higher RSD in SolC1(−) myotubes. Blockade of IP3 pathway significantly reduced RSD in both cell types but with a stronger effect in dystrophin-deficient SolC1(−) myotubes. Immunocytochemistry allowed us to localize RyRs as well as IP3R-1 and IP3R-2 isoforms, indicating the presence of both RyR-dependent and IP3-dependent release systems in the Sol cells. We previously reported evidence for the enhancement of the IP3 mediated calcium signaling pathway in SolC1(−) as compared with SolD(+) myotubes (Balghi et al., 2006). We demonstrated that, with a high K+-stimulation, an IP3-dependent slow release, depending on the regulation of a Gi protein, was increased in the SolC1(−) as compared with the SolD(+) myotubes. Here we show that, at rest, these regulation mechanisms are also involved in the modulation of calcium release activities. The enhancement of RSD could then play a significant role in the calcium overload observed in dystrophin deficient myotubes.
Quantification and Modulation of Calcium Release Event Activity
Most of the experiments presented here were motivated by the observation, at rest, of numerous release events in fluo-4–loaded SolC1(−) myotubes. Moreover, under the same conditions, spark-like events were very rare in both SolD(+) and primary culture myotubes (unpublished data). This difference was more easily observed in recording fast x-y images with a 20× objective. This kind of recording contains 30–50 images with 300-ms time resolution (time between two fluorescence acquisitions for each pixel position, i.e., for each location in myotubes). We observed that such experiments allowed us to capture events from all sites of release because of the long overall time of recording (10–15 s), but all the events from sites may not be captured. Indeed, one event with duration of several tens of milliseconds may occur during a 300-ms gap between two images, making it nonrecordable. To quantify the observed difference, a tool for image analysis, based on standard deviation measurements, has been developed in the laboratory to count the number of calcium release sites (RSD). This analysis, associated with complementary morphological studies, provided a complete overview of the properties of spontaneous release events in Sol myotubes.
Previous studies in smooth muscle showed that changes in membrane potential modulate both frequency and amplitude of Ca2+ release events (Jaggar et al., 1998, 2000; Cheranov and Jaggar, 2002). In the present report, exposure of myotubes to various extracellular K+ concentrations had no strong effect on the RSD. Furthermore, application of the L-type channel inhibitor, nifedipine, had no significant effect on the RSD parameter in Sol cells (unpublished data). Taken together, these results are in agreement with experiments from Shirokova et al. (1998) showing that in voltage control conditions, locations of spontaneous release were not sensitive to depolarization pulses in myotubes from primary culture. Hence, in Sol cell lines as well as in developing myotubes, SR calcium release channels involved in spontaneous events may not be sensitive to changes in membrane potential, suggesting uncoupling with DHPRs. Furthermore, whatever the imposed potential, RSD values obtained in SolD(+) never reached those in SolC1(−). This result suggests that control of calcium release event activities, in Sol cell lines, is clearly dissociated from electrical properties of the membrane.
Resting free calcium concentration in cells lacking dystrophin was shown higher than in normal cells in mdx mouse fibers (Turner et al., 1988), in muscle biopsies from DMD patients (Imbert et al., 1995) and in SolC1(−) myotubes (Marchand et al., 2004). Because of the known property of myoplasmic calcium ions to induce opening of SR calcium channels, RyRs (Conklin et al., 2000) and IP3Rs (Tovey et al., 2001), these data raised the question that the high calcium release event activity observed in SolC1(−) myotubes could be due to the high [Ca2+]i. Combined measurements of calcium levels and RSD were performed on BAPTA-loaded preparations (Fig. 5). These experiments allowed us to display the density of events as a function of [Ca2+]i. As expected, at low concentrations of myoplasmic free calcium, RSD was reduced. This reduction could be due to (a) reduced calcium concentration inside stores, (b) calcium channel inactivation, or (c) a reduction of the calcium-induced calcium release (CICR) mechanism. However, with increasing calcium, RSD increased up to a plateau and the levels reached at the plateau were significantly different between SolC1(−) and SolD(+). Furthermore, sigmoid patterns of RSD extinction were different between the dystrophin-deficient SolC1(−) and the mini-dystrophin transfected SolD(+) cells. It is also worth noting that incubation with BAPTA-AM will not only reduce intracellular calcium concentration but will also add in the myoplasm a calcium chelator with high affinity, the BAPTA. The presence of this artificial buffering component will consequently reduce Ca2+ increase during the release from the SR, modifying calcium channel gating properties and calcium-dependent inactivation effect. Consequences of these changes could then be the inhibition of CICR and the modification of a mechanism at the origin of spontaneous release events. Nevertheless, if the active buffering role of BAPTA may play in the reduction of the “RSD” parameter, this reduction effect is related to calcium sensitivity of release channels. Hence, differences observed between SolC1(−) and SolD(+) reflected modifications of the intrinsic properties of release channels when mini-dystrophin is expressed (SolD(+)) as compared with when dystrophin is absent (SolC1(−)).
Morphometric analysis of calcium release events (Fig. 6) showed that the amplitude of spontaneous release from SolC1(−) and SolD(+) myotubes was not significantly different (0.82 and 0.80, respectively), indicating similar levels of Ca2+ stored in the SR in SolC1(−) and in SolD(+). Hence, differences in RSD observed between SolC1(−) and SolD(+) myotubes may not be due to different levels of stored calcium but to changes in the mechanism at the initiation of release activities or to a reduced CICR.
Calcium Channels Involved in Release Activities in Sol Myotubes
Isotypes I and III of the RyR family are known to contribute to elementary calcium release events at rest in skeletal muscle cells (Shirokova et al., 1998; Rios et al., 2001). In our experiments, the use of ryanodine at high concentrations significantly reduced RSD in Sol myotubes. This reduction could be either attributed to a blockade of release through most RyRs or to calcium store depletion after partial opening of these calcium channels. With thapsigargin exposure, increased calcium, reflecting the amount of calcium stored in the SR, was similar in ryanodine-treated and untreated cells (unpublished data). This result indicates that in these conditions, the main effect of ryanodine (100 μM for 10 min) was the inhibition of RyR calcium channels. With ryanodine application, the reduction of RSD was different in SolC1(−) and SolD(+). Indeed, rare calcium release events were found in SolD(+) preparations, whereas a significant calcium release event activity was still observed in SolC1(−) myotubes. These results suggest the presence of a calcium release mechanism, at rest, insensitive to ryanodine, which is more apparent in SolC1(−).
It has been clearly demonstrated in many cells that stimuli operate through phospholipase C to generate IP3 that induces Ca2+ release from internal store (Berridge, 1993). In smooth muscle cells, Ca2+ puffs evoked by activation of clusters of IP3Rs have been presented (Boittin et al., 2000), but in skeletal muscle cells, the role of IP3 pathway in resting calcium signaling is still poorly documented. Several studies from Jaimovich's group, however, have shown that IP3Rs are involved in calcium signaling in developing skeletal muscle cells (Jaimovich et al., 2000; Powell et al., 2003). In our experiments, the two IP3 pathway inhibitors, 2-APB and U73122, significantly reduced RSD in both cell types. This observation suggests that IP3Rs participate in calcium release events occurring at rest in Sol cells. With application of 2-APB, a direct inhibitor of IP3R calcium channels, the stronger reduction of RSD was observed in SolC1(−) myotubes (88% decrease as compared with 76% in SolD(+)). These results suggest that the IP3R-related component of release activity is elevated when dystrophin is absent (SolC1(−)) and reduced when mini-dystrophin is expressed (SolD(+)). When this component is inhibited, both cell types displayed the same release event activity. These data enlighten the importance of the IP3 signaling pathway in resting calcium signaling and homeostasis, particularly in dystrophin-deficient skeletal muscle cells.
Cross-talk between RyRs and IP3Rs?
Previous studies demonstrated that Ca2+ sparks originating from the opening of RyRs in skeletal muscle displayed a duration (FDHM) of ∼30 ms (Shirokova et al., 1999). Ca2+ puffs initiated by IP3Rs in Xenopus oocyte and in rat ureteric myocytes exhibited release events with duration between 200 and 250 ms (Berridge, 1997; Boittin et al., 2000). It has also been shown, in smooth muscle cells, that stimulation of the IP3 pathway increased the duration of spontaneous release events (Zhang et al., 2003). In our experiments, duration (median) of release events was 64.5 ms and 55.2 ms in SolC1(−) and SolD(+) myotubes, respectively. Furthermore, numerous calcium events with duration >100 ms have been recorded in both myotubes, suggesting patterns of release similar to the pattern of Ca2+ puffs. Previous studies hypothesized, in smooth muscle cells, a possible interaction between RyRs and IP3Rs and that Ca2+ release events could originate from a “cross-talk” between these channels (Gordienko and Bolton, 2002; Zhang et al., 2003). Thus, one can postulate that RyRs and IP3Rs might both participate in the initiation and propagation of resting events, leading to a mixture of sparks and puffs. Different contribution levels of these two channels could explain differences in RSD between SolC1(−) and SolD(+) myotubes.
Dystrophin Deficiency and Calcium Signaling in Resting Cells
Three main results are of particular interest in this work. First, this study indicates a possible role, at rest, of local Ca2+ release from the SR in Ca2+ mishandling in dystrophin-deficient cells. Second, it strongly supports the hypothesis of a deregulation of Ca2+ release in a dystrophin-deficient cell line, which is attenuated by expression of mini-dystrophin. Finally, it establishes evidence for a significant role of IP3Rs in spontaneous Ca2+ release events in dystrophin-deficient cells. Because these spontaneous events are known to contribute to the resting level of calcium (Berridge, 1997), these events could be involved in increased resting free calcium, which leads to cell death. Hence, these results combined with our previous work (Balghi et al., 2006) provide evidence for the regulation by mini-dystrophin of an IP3 pathway, which is overactivated in dystrophin-deficient cells. Expression of this protein, which is a candidate for gene therapy, contributes both during stimulation and in resting condition to a more controlled calcium homeostasis.
Acknowledgments
We thank Prof. Isabelle Martelly for providing the original Sol8 cell line and Dr. Werner Melzer for his critical reading of the manuscript. We thank Françoise Mazin for her expert technical assistance in cell culture. The authors thank Elise Mok for her editorial assistance.
This work was supported by grants from Centre National de la Recherche Scientifique (CNRS UMR 6187), University of Poitiers, and the Association Française contre les Myopathies. This work is part of the thesis project of Haouaria Balghi supported by a fellowship from the Association Française contre les Myopathies.
Olaf S. Andersen served as editor.
Abbreviations used in this paper: AM, acetoxymethyl; 2-APB, 2-aminoethoxydiphenyle borate; BMD, Becker muscular dystrophy; CICR, calcium-induced calcium release; DHPR, dihydropyridine receptor; DMD, Duchenne muscular dystrophy; FDHM, full duration at half maximum; FWHM, full width at half maximum; IP3, inositol 1,4,5- trisphosphate; IP3R, IP3 receptor; RSD, release site density; RT, rise time; RyR, ryanodine receptor; SR, sarcoplasmic reticulum.
References
- Araya, R., J.L. Liberona, J.C. Cardenas, N. Riveros, M. Estrada, J.A. Powell, M.A. Carrasco, and E. Jaimovich. 2003. Dihydropyridine receptors as voltage sensors for a depolarization-evoked, IP3R-mediated, slow calcium signal in skeletal muscle cells. J. Gen. Physiol. 121:3–16. [DOI] [PMC free article] [PubMed] [Google Scholar]
- Balghi, H., S. Sebille, B. Constantin, S. Patri, V. Thoreau, L. Mondin, E. Mok, A. Kitzis, G. Raymond, and C. Cognard. 2006. Mini-dystrophin expression down-regulates overactivation of G protein-mediated IP3 signaling pathway in dystrophin-deficient muscle cells. J. Gen. Physiol. 127:171–182. [DOI] [PMC free article] [PubMed] [Google Scholar]
- Berridge, M.J. 1993. Inositol trisphosphate and calcium signaling. Nature. 361:315–325. [DOI] [PubMed] [Google Scholar]
- Berridge, M.J. 1997. Elementary and global aspects of calcium signaling. J. Physiol. 499(Pt 2):291–306. [DOI] [PMC free article] [PubMed] [Google Scholar]
- Bodensteiner, J.B., and A.G. Engel. 1978. Intracellular calcium accumulation in Duchenne dystrophy and other myopathies: a study of 567,000 muscle fibers in 114 biopsies. Neurology. 28:439–446. [DOI] [PubMed] [Google Scholar]
- Boittin, F.X., F. Coussin, J.L. Morel, G. Halet, N. Macrez, and J. Mironneau. 2000. Ca2+ signals mediated by Ins(1,4,5)P(3)-gated channels in rat ureteric myocytes. Biochem. J. 349:323–332. [DOI] [PMC free article] [PubMed] [Google Scholar]
- Bootman, M.D., M.J. Berridge, and H.L. Roderick. 2002. Activating calcium release through inositol 1,4,5-trisphosphate receptors without inositol 1,4,5-trisphosphate. Proc. Natl. Acad. Sci. USA. 99:7320–7322. [DOI] [PMC free article] [PubMed] [Google Scholar]
- Carrasco, M.A., N. Riveros, J. Rios, M. Muller, F. Torres, J. Pineda, S. Lantadilla, and E. Jaimovich. 2003. Depolarization-induced slow calcium transients activate early genes in skeletal muscle cells. Am. J. Physiol. Cell Physiol. 284:C1438–C1447. [DOI] [PubMed] [Google Scholar]
- Cheng, H., W.J. Lederer, and M.B. Cannell. 1993. Calcium sparks: elementary events underlying excitation-contraction coupling in heart muscle. Science. 262:740–744. [DOI] [PubMed] [Google Scholar]
- Cheng, H., L.S. Song, N. Shirokova, A. Gonzalez, E.G. Lakatta, E. Rios, and M.D. Stern. 1999. Amplitude distribution of calcium sparks in confocal images: theory and studies with an automatic detection method. Biophys. J. 76:606–617. [DOI] [PMC free article] [PubMed] [Google Scholar]
- Cheranov, S.Y., and J.H. Jaggar. 2002. Sarcoplasmic reticulum calcium load regulates rat arterial smooth muscle calcium sparks and transient K(Ca) currents. J. Physiol. 544:71–84. [DOI] [PMC free article] [PubMed] [Google Scholar]
- Cognard, C., B. Constantin, M. Rivet-Bastide, and G. Raymond. 1993. Intracellular calcium transients induced by different kinds of stimulus during myogenesis of rat skeletal muscle cells studied by laser cytofluorimetry with Indo-1. Cell Calcium. 14:333–348. [DOI] [PubMed] [Google Scholar]
- Conklin, M.W., C.A. Ahern, P. Vallejo, V. Sorrentino, H. Takeshima, and R. Coronado. 2000. Comparison of Ca2+ sparks produced independently by two ryanodine receptor isoforms (type 1 or type 3). Biophys. J. 78:1777–1785. [DOI] [PMC free article] [PubMed] [Google Scholar]
- Cordeiro, J.M., K.W. Spitzer, W.R. Giles, P.E. Ershler, M.B. Cannell, and J.H. Bridge. 2001. Location of the initiation site of calcium transients and sparks in rabbit heart Purkinje cells. J. Physiol. 531:301–314. [DOI] [PMC free article] [PubMed] [Google Scholar]
- Deconinck, N., T. Ragot, G. Marechal, M. Perricaudet, and J.M. Gillis. 1996. Functional protection of dystrophic mouse (mdx) muscles after adenovirus-mediated transfer of a dystrophin minigene. Proc. Natl. Acad. Sci. USA. 93:3570–3574. [DOI] [PMC free article] [PubMed] [Google Scholar]
- Divet, A., and C. Huchet-Cadiou. 2002. Sarcoplasmic reticulum function in slow- and fast-twitch skeletal muscles from mdx mice. Pflugers Arch. 444:634–643. [DOI] [PubMed] [Google Scholar]
- Eltit, J.M., A.A. Garcia, J. Hidalgo, J.L. Liberona, M. Chiong, S. Lavandero, E. Maldonado, and E. Jaimovich. 2006. Membrane electrical activity elicits IP3-dependent slow Ca+2 signals through a Gbeta gamma/phosphatidylinositol 3-kinase gamma pathway in skeletal myotubes. J. Biol. Chem. 281:12143–12154. [DOI] [PubMed] [Google Scholar]
- Ervasti, J.M., and K.P. Campbell. 1991. Membrane organization of the dystrophin-glycoprotein complex. Cell. 66:1121–1131. [DOI] [PubMed] [Google Scholar]
- Gordienko, D.V., and T.B. Bolton. 2002. Crosstalk between ryanodine receptors and IP(3) receptors as a factor shaping spontaneous Ca2+-release events in rabbit portal vein myocytes. J. Physiol. 542:743–762. [DOI] [PMC free article] [PubMed] [Google Scholar]
- Gordienko, D.V., T.B. Bolton, and M.B. Cannell. 1998. Variability in spontaneous subcellular calcium release in guinea-pig ileum smooth muscle cells. J. Physiol. 507:707–720. [DOI] [PMC free article] [PubMed] [Google Scholar]
- Grynkiewicz, G., M. Poenie, and R.Y. Tsien. 1985. A new generation of Ca2+ indicators with greatly improved fluorescence properties. J. Biol. Chem. 260:3440–3450. [PubMed] [Google Scholar]
- Hoffman, E.P., R.H. Brown Jr., and L.M. Kunkel. 1987. Dystrophin: the protein product of the Duchenne muscular dystrophy locus. Cell. 51:919–928. [DOI] [PubMed] [Google Scholar]
- Imbert, N., C. Cognard, G. Duport, C. Guillou, and G. Raymond. 1995. Abnormal calcium homeostasis in Duchenne muscular dystrophy myotubes contracting in vitro. Cell Calcium. 18:177–186. [DOI] [PubMed] [Google Scholar]
- Jaggar, J.H., V.A. Porter, W.J. Lederer, and M.T. Nelson. 2000. Calcium sparks in smooth muscle. Am. J. Physiol. Cell Physiol. 278:C235–C256. [DOI] [PubMed] [Google Scholar]
- Jaggar, J.H., A.S. Stevenson, and M.T. Nelson. 1998. Voltage dependence of Ca2+ sparks in intact cerebral arteries. Am. J. Physiol. 274:C1755–C1761. [DOI] [PubMed] [Google Scholar]
- Jaimovich, E., R. Reyes, J.L. Liberona, and J.A. Powell. 2000. IP(3) receptors, IP(3) transients, and nucleus-associated Ca2+ signals in cultured skeletal muscle. Am. J. Physiol. Cell Physiol. 278:C998–C1010. [DOI] [PubMed] [Google Scholar]
- Kettlun, C., A. Gonzalez, E. Rios, and M. Fill. 2003. Unitary Ca2+ current through mammalian cardiac and amphibian skeletal muscle ryanodine receptor channels under near-physiological ionic conditions. J. Gen. Physiol. 122:407–417. [DOI] [PMC free article] [PubMed] [Google Scholar]
- Lacampagne, A., M.G. Klein, and M.F. Schneider. 1998. Modulation of the frequency of spontaneous sarcoplasmic reticulum Ca2+ release events (Ca2+ sparks) by myoplasmic [Mg2+] in frog skeletal muscle. J. Gen. Physiol. 111:207–224. [DOI] [PMC free article] [PubMed] [Google Scholar]
- Liberona, J.L., J.A. Powell, S. Shenoi, L. Petherbridge, R. Caviedes, and E. Jaimovich. 1998. Differences in both inositol 1,4,5-trisphosphate mass and inositol 1,4,5-trisphosphate receptors between normal and dystrophic skeletal muscle cell lines. Muscle Nerve. 21:902–909. [DOI] [PubMed] [Google Scholar]
- Lipp, P., and E. Niggli. 1994. Modulation of Ca2+ release in cultured neonatal rat cardiac myocytes. Insight from subcellular release patterns revealed by confocal microscopy. Circ. Res. 74:979–990. [DOI] [PubMed] [Google Scholar]
- Lipp, P., M. Laine, S.C. Tovey, K.M. Burrell, M.J. Berridge, W. Li, and M.D. Bootman. 2000. Functional InsP3 receptors that may modulate excitation-contraction coupling in the heart. Curr. Biol. 10:939–942. [DOI] [PubMed] [Google Scholar]
- Lipp, P., M. Egger, and E. Niggli. 2002. Spatial characteristics of sarcoplasmic reticulum Ca2+ release events triggered by L-type Ca2+ current and Na+ current in guinea-pig cardiac myocytes. J. Physiol. 542:383–393. [DOI] [PMC free article] [PubMed] [Google Scholar]
- Lorenzon, N.M., C.S. Haarmann, E.E. Norris, S. Papadopoulos, and K.G. Beam. 2004. Metabolic biotinylation as a probe of supramolecular structure of the triad junction in skeletal muscle. J. Biol. Chem. 279:44057–44064. [DOI] [PubMed] [Google Scholar]
- Mackenzie, L., M.D. Bootman, M.J. Berridge, and P. Lipp. 2001. Predetermined recruitment of calcium release sites underlies excitation-contraction coupling in rat atrial myocytes. J. Physiol. 530:417–429. [DOI] [PMC free article] [PubMed] [Google Scholar]
- Mackenzie, L., M.D. Bootman, M. Laine, M.J. Berridge, J. Thuring, A. Holmes, W.H. Li, and P. Lipp. 2002. The role of inositol 1,4,5-trisphosphate receptors in Ca2+ signaling and the generation of arrhythmias in rat atrial myocytes. J. Physiol. 541:395–409. [DOI] [PMC free article] [PubMed] [Google Scholar]
- Marchand, E., B. Constantin, H. Balghi, M.C. Claudepierre, A. Cantereau, C. Magaud, A. Mouzou, G. Raymond, S. Braun, and C. Cognard. 2004. Improvement of calcium handling and changes in calcium-release properties after mini- or full-length dystrophin forced expression in cultured skeletal myotubes. Exp. Cell Res. 297:363–379. [DOI] [PubMed] [Google Scholar]
- Marchand, E., B. Constantin, C. Vandebrouck, G. Raymond, and C. Cognard. 2001. Calcium homeostasis and cell death in Sol8 dystrophin-deficient cell line in culture. Cell Calcium. 29:85–96. [DOI] [PubMed] [Google Scholar]
- Mironneau, J., S. Arnaudeau, N. Macrez-Lepretre, and F.X. Boittin. 1996. Ca2+ sparks and Ca2+ waves activate different Ca2+-dependent ion channels in single myocytes from rat portal vein. Cell Calcium. 20:153–160. [DOI] [PubMed] [Google Scholar]
- Monaco, A.P., R.L. Neve, C. Colletti-Feener, C.J. Bertelson, D.M. Kurnit, and L.M. Kunkel. 1986. Isolation of candidate cDNAs for portions of the Duchenne muscular dystrophy gene. Nature. 323:646–650. [DOI] [PubMed] [Google Scholar]
- Moschella, M.C., J. Watras, T. Jayaraman, and A.R. Marks. 1995. Inositol 1,4,5-trisphosphate receptor in skeletal muscle: differential expression in myofibres. J. Muscle Res. Cell Motil. 16:390–400. [DOI] [PubMed] [Google Scholar]
- Mulle, C., P. Benoit, C. Pinset, M. Roa, and J.P. Changeux. 1988. Calcitonin gene-related peptide enhances the rate of desensitization of the nicotinic acetylcholine receptor in cultured mouse muscle cells. Proc. Natl. Acad. Sci. USA. 85:5728–5732. [DOI] [PMC free article] [PubMed] [Google Scholar]
- Niggli, E. 1999. Localized intracellular calcium signaling in muscle: calcium sparks and calcium quarks. Annu. Rev. Physiol. 61:311–335. [DOI] [PubMed] [Google Scholar]
- Powell, J.A., M.A. Carrasco, D.S. Adams, B. Drouet, J. Rios, M. Muller, M. Estrada, and E. Jaimovich. 2001. IP(3) receptor function and localization in myotubes: an unexplored Ca(2+) signaling pathway in skeletal muscle. J. Cell Sci. 114:3673–3683. [DOI] [PubMed] [Google Scholar]
- Powell, J.A., J. Molgo, D.S. Adams, C. Colasante, A. Williams, M. Bohlen, and E. Jaimovich. 2003. IP3 receptors and associated Ca2+ signals localize to satellite cells and to components of the neuromuscular junction in skeletal muscle. J. Neurosci. 23:8185–8192. [DOI] [PMC free article] [PubMed] [Google Scholar]
- Rios, E., and G. Pizarro. 1991. Voltage sensor of excitation-contraction coupling in skeletal muscle. Physiol. Rev. 71:849–908. [DOI] [PubMed] [Google Scholar]
- Rios, E., N. Shirokova, W.G. Kirsch, G. Pizarro, M.D. Stern, H. Cheng, and A. Gonzalez. 2001. A preferred amplitude of calcium sparks in skeletal muscle. Biophys. J. 80:169–183. [DOI] [PMC free article] [PubMed] [Google Scholar]
- Salanova, M., G. Priori, V. Barone, E. Intravaia, B. Flucher, F. Ciruela, R.A. McIlhinney, J.B. Parys, K. Mikoshiba, and V. Sorrentino. 2002. Homer proteins and InsP(3) receptors co-localise in the longitudinal sarcoplasmic reticulum of skeletal muscle fibres. Cell Calcium. 32:193–200. [DOI] [PubMed] [Google Scholar]
- Sebille, S., A. Cantereau, C. Vandebrouck, H. Balghi, B. Constantin, G. Raymond, and C. Cognard. 2005. Calcium sparks in muscle cells: interactive procedures for automatic detection and measurements on line-scan confocal images series. Comput. Methods Programs Biomed. 77:57–70. [DOI] [PubMed] [Google Scholar]
- Shirokova, N., J. Garcia, and E. Rios. 1998. Local calcium release in mammalian skeletal muscle. J. Physiol. 512(Pt 2):377–384. [DOI] [PMC free article] [PubMed] [Google Scholar]
- Shirokova, N., R. Shirokov, D. Rossi, A. Gonzalez, W.G. Kirsch, J. Garcia, V. Sorrentino, and E. Rios. 1999. Spatially segregated control of Ca2+ release in developing skeletal muscle of mice. J. Physiol. 521:483–495. [DOI] [PMC free article] [PubMed] [Google Scholar]
- Tovey, S.C., P. de Smet, P. Lipp, D. Thomas, K.W. Young, L. Missiaen, H. De Smedt, J.B. Parys, M.J. Berridge, J. Thuring, et al. 2001. Calcium puffs are generic InsP(3)-activated elementary calcium signals and are downregulated by prolonged hormonal stimulation to inhibit cellular calcium responses. J. Cell Sci. 114:3979–3989. [DOI] [PubMed] [Google Scholar]
- Turner, P.R., T. Westwood, C.M. Regen, and R.A. Steinhardt. 1988. Increased protein degradation results from elevated free calcium levels found in muscle from mdx mice. Nature. 335:735–738. [DOI] [PubMed] [Google Scholar]
- Ursu, D., S. Sebille, B. Dietze, D. Freise, V. Flockerzi, and W. Melzer. 2001. Excitation-contraction coupling in skeletal muscle of a mouse lacking the dihydropyridine receptor subunit gamma1. J. Physiol. 533:367–377. [DOI] [PMC free article] [PubMed] [Google Scholar]
- Vandebrouck, C., D. Martin, M. Colson-Van Schoor, H. Debaix, and P. Gailly. 2002. Involvement of TRPC in the abnormal calcium influx observed in dystrophic (mdx) mouse skeletal muscle fibers. J. Cell Biol. 158:1089–1096. [DOI] [PMC free article] [PubMed] [Google Scholar]
- Zhang, W.M., K.P. Yip, M.J. Lin, L.A. Shimoda, W.H. Li, and J.S. Sham. 2003. ET-1 activates Ca2+ sparks in PASMC: local Ca2+ signaling between inositol trisphosphate and ryanodine receptors. Am. J. Physiol. Lung Cell. Mol. Physiol. 285:L680–L690. [DOI] [PubMed] [Google Scholar]
- Zhou, J., G. Brum, A. Gonzalez, B.S. Launikonis, M.D. Stern, and E. Rios. 2003. Ca2+ sparks and embers of mammalian muscle. Properties of the sources. J. Gen. Physiol. 122:95–114. [DOI] [PMC free article] [PubMed] [Google Scholar]