Abstract
The phenomenon of ligand-induced ion channel gating hinges upon the ability of a receptor channel to bind ligand molecules with conformation-specific affinities. However, our understanding of this fundamental phenomenon is notably limited, not only because the changes in binding site structure and ligand conformation that occur upon gating are largely unknown but, also, because the strength of these ligand–receptor interactions are experimentally elusive. Both high- and low-efficacy ligands pose a number of analytical and experimental challenges that can render the estimation of their conformation-specific binding affinities impossible. In this paper, we present a novel assay that overcomes some of the hurdles presented by weak agonists of the muscle nicotinic receptor and allows the estimation of their closed-state affinities. The method, which we have termed the “activation-competition” assay, consists of a single-channel concentration–response assay performed in the presence of a binary mixture of ligands of widely different efficacies. By plotting the channel response (i.e., the open probability) as a function of the concentration of each agonist in the mixture, interpreting the observed response in the framework of a plausible kinetic scheme, and fitting the open probability surface with the corresponding function, the affinities of the closed receptor for the two agonists can be simultaneously extracted as free parameters. Here, we applied this methodology to estimate the closed-state affinity of the muscle nicotinic receptor for choline (a very weak agonist) using acetylcholine (ACh) as the partner in the mixture. We estimated the dissociation equilibrium constant of choline (KD) from the wild type's closed state to be 4.1 ± 0.5 mM (and that of ACh to be 106 ± 6 μM). We also discuss the use of accurate estimates of affinities for low-efficacy agonists as a tool to discriminate between binding and gating effects of mutations, and in the context of the rational design of therapeutic drugs.
INTRODUCTION
The nicotinic acetylcholine receptor (AChR) is activated by a variety of naturally occurring and synthetic ligands. The surge in structural information about the AChR (Brejc et al., 2001; Miyazawa et al., 2003; Celie et al., 2004), the recognition of the involvement of nicotinic pathways in cognitive function and dysfunction (Levin and Simon, 1998; Hahn et al., 2003), and the consistently growing repertoire of subtype-specific ligands with therapeutic potential (Holladay et al., 1997; Romanelli and Gualtieri 2003; Bunnelle et al., 2004) inevitably call for a parallel development of rigorous functional assays.
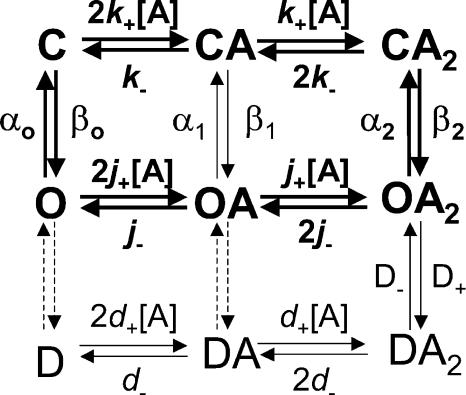
From a thermodynamic standpoint, the function of ligand-gated ion channels is relatively simple: the receptor channel can interconvert among a discrete number of different conformations, and each of these can bind ligands with distinct affinities (Fig. 1). Thus, the equilibrium constant of the closed ⇌ open isomerization of the liganded form of a receptor (i.e., the “efficacy,” here denoted as θ2) can be viewed as dictated by the gating equilibrium constant of the unliganded receptor (θo), and the ratio of the affinities of the open (1/JD) and the closed (1/KD) states for the ligand in question (Monod et al., 1965; Karlin, 1967; Jackson 1984, 1994). In the case of a receptor with two transmitter binding sites, like the muscle AChR, we have:
 |
(1) |
Figure 1.
Thermodynamic cycles and AChR function. An MWC-type of kinetic scheme (Monod et al., 1965) applied to the particular case of the (muscle) AChR. C, O, and D denote the closed, open, and desensitized conformations of the channel, respectively. In this paper, we refer to the two types of nonconductive conformations (closed and desensitized), collectively, as shut states. A denotes an agonist molecule that can bind to the neurotransmitter binding sites. The broken arrows indicate the uncertainty as to the extent to which recovery from desensitization of mono- and unliganded AChRs proceeds directly (Desensitized→Closed) or through an open-channel conformation (Desensitized→Open→Closed). The cycle considered for arriving at Eq. 1 is displayed in bold.
Hence, a physically meaningful description of the interaction between a receptor and a ligand should be expressed in terms of conformation-specific ligand-dissociation equilibrium constants, rather than in terms of phenomenological descriptors such as EC50 values. Since it is currently unfeasible to “trap” the protein in one of its various conformations, though, such detailed information has been difficult to obtain experimentally, and affinity measurements derived from, say, equilibrium binding assays only provide a weighted average of the different conformation-specific affinities.
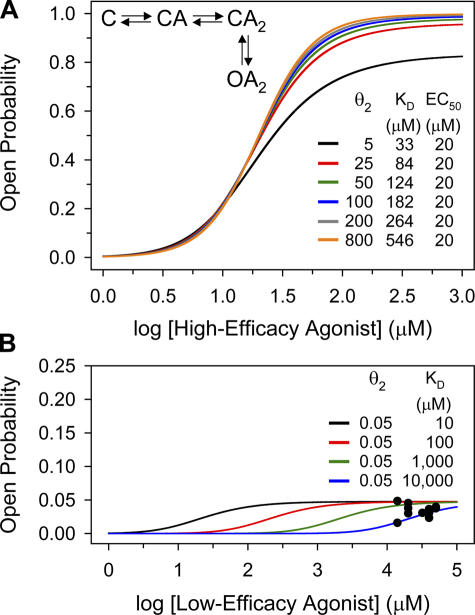
Electrophysiological recordings provide the only experimental means to estimate conformation-specific affinities of ion channels for agonists. However, classical concentration–response relationships at the single-channel level (i.e., plots of equilibrium open probability vs. agonist concentration) and, more recently developed, global-fitting full-maximum-likelihood methods (i.e., estimation of agonist association and dissociation rate constants from maximum-likelihood fits of mechanisms to dwell-time series; Qin et al., 1996; Hatton et al., 2003) have limited applicability in the case of agonists with very high or very low efficacies. The affinity for high-efficacy agonists cannot be easily extracted from concentration–response curves because efficacy and affinity become increasingly correlated as the efficacy increases (Fig. 2 A). In these cases, affinities cannot be easily extracted from global-fitting methods either because the proportion of missed events increases with the efficacy of the agonist (in the AChR, higher efficacies are associated with faster opening rate constants; Grosman et al., 2000b), and the ability to correct for these missed intervals has practical limits. The estimation of affinities for low-efficacy agonists also poses some challenges, most notably (in the case of the AChR) the narrow range of concentrations over which clusters of single-channel openings can be defined. This is because the small gating-equilibrium constant in the presence of low-efficacy agonists is due to a slow opening rate constant (rather than a fast closing rate constant; Grosman, et al., 2000b) and, thus, high concentrations are needed to elicit identifiable clusters. The problem with using such high agonist concentrations is that ACh-like molecules (i.e., quaternary ammonium compounds or protonated tertiary amines) block the pore domain of the open channel often with an affinity not much smaller than that of the closed-channel transmitter binding sites (1/KD). As a result, the limit on the highest concentration of ligand that can be tested, set by channel block, is not much higher than the lowest concentration that is needed to elicit identifiable clusters. Moreover, the open probability (Popen) values obtained in spite of these technical difficulties are so low that the patch-to-patch variation is often comparable to their means and are, therefore, unreliable (Fig. 2 B). Given that low-efficacy agonists constitute a substantial fraction of the known molecules that bind to, and activate nicotinic receptors, the lack of information about conformation-specific affinities severely limits our insight into the structural determinants of binding and (liganded) gating. It is worth noting here that this important deficiency probably extends to all neurotransmitter-gated ion channels (e.g., Erreger et al., 2004).
Figure 2.
Simulated 1-D concentration–response relationships for high- and low-efficacy agonists. (A) The different plots are concentration–response curves simulated according to the linear kinetic scheme shown in the inset (see Eq. 7). These six hypothetical high-efficacy agonists have the same EC50 value (20 μM) but differ in their closed-state affinities (1/KD) and diliganded gating equilibrium constant values (θ2). Note that as the efficacy increases (i.e., as the maximum Popen approaches unity), different combinations of KD and θ2 values make almost indistinguishable predictions. This, superimposed on the inherent patch-to-patch variation of the experimental observations, makes it impossible to simultaneously extract both parameters for high-efficacy agonists from this type of assay. This problem would be solved if the θ2 value of the ligand in question were known from independent experiments, so that its value can be fixed during the fit. However, the accurate estimation of θ2 values for high-efficacy agonists is not trivial. (B) These plots are also concentration–response curves simulated according to the kinetic scheme shown in the inset of A but, in this case, they correspond to four hypothetical low-efficacy agonists with the same gating equilibrium constant (θ2 = 0.05) and different KD values. The scatter plot superimposed on the simulated line plots corresponds to wild-type single-channel data obtained from 23 independent patches exposed to different concentrations of the low-efficacy agonist choline (θ2 = 0.035). Each data point corresponds to a different patch. Note that even though the four sets of simulated parameters make different predictions, the maximum Popen values are small and comparable to the typical patch-to-patch variation of the Popen estimates. This makes it practically impossible to extract the affinities for weak agonists from observations of this sort.
An equally important aspect of molecular recognition is the understanding of how the structure of the receptor itself, and changes to it, affects the affinities for ligands. In many cases, the effects of mutations on the AChR's transmitter binding site affinities are investigated by analyzing single-channel recordings elicited in the presence of ACh. However, the validity of ACh as a sensitive functional probe is questionable in the case of “gain-of-function” mutants that open faster than the wild type (a very common phenotype) because the wild-type opening rate constant (∼50,000 s−1) is very close to the fastest transition rate that can practically be estimated with current methods of analysis (∼130,000 s−1; Burzomato et al., 2004). In such instances, the use of low-efficacy agonists becomes an appealing alternative (Grosman and Auerbach, 2000; Grosman et al., 2000a). For low-efficacy agonists to be useful in this context, however, the estimates of wild-type affinities are required. Again, this is another good reason why the development of assays aimed at estimating conformation-specific affinities for low-efficacy agonists is of fundamental importance.
We present, here, the details of a novel single-channel based methodology, which we have termed the “activation-competition assay,” that allows the estimation of the closed state's affinity for low-efficacy agonists. Since one of the major hurdles is the narrow range of concentrations over which single-channel clusters can be identified with these agonists, we reasoned that using a mixture of two ligands, a high-efficacy agonist and the low-efficacy agonist of interest, could overcome this limitation. Although low concentrations of low-efficacy agonists fail to elicit identifiable clusters, low concentrations can be sufficient to displace high-efficacy ligands from the transmitter binding sites and reduce the Popen in a detectable manner; this effectively widens the range of weak agonist concentrations that can be tested. By plotting the channel response (Popen) as a function of the concentration of each agonist in the binary mixture, interpreting the observed response in the framework of a plausible kinetic scheme, and fitting the Popen surface with the corresponding function, the affinities of the closed AChR for the two agonists can be simultaneously extracted as free parameters. Here, we applied this methodology to study the activation of the adult mouse muscle AChR by its two endogenous ligands of markedly different efficacies: ACh and choline. We estimated the dissociation equilibrium constants of ACh (KD, ACh) and choline (KD, Choline) from the transmitter binding sites of the wild type's closed state to be 106 ± 6 μM and 4.1 ± 0.5 mM, respectively. Also, we present an example of the use of weak (or “partial”) agonists to probe the ligand binding properties of fast-opening, gain-of-function mutants.
MATERIALS AND METHODS
Heterologous Expression of Wild-type and αS269I AChRs
Adult mouse muscle AChR cDNA clones (Gardner, 1990; Sine, 1993) were provided by S.M. Sine (Mayo Clinic, Rochester, NY) in the CMV-based expression vector pRBG4 (Lee et al., 1991). The αS269I mutation was introduced using the QuikChange Site-directed Mutagenesis Kit (Stratagene). The complete DNA sequences of all inserts were confirmed by dideoxy sequencing. HEK 293 cells were maintained in Dulbecco's Modified Eagle Medium (Invitrogen) at 37°C in a 5% CO2 incubator and were used for heterologous expression of wild-type and mutant AChRs. Approximately 24 h before transfection, HEK 293 cells were seeded onto 35-mm plastic culture dishes. The cells were transiently transfected using the calcium-phosphate precipitation method, the final transfection mixture containing (in mM) 140 NaCl, 0.75 Na2HPO4, 125 CaCl2, 25 HEPES/NaOH, pH 7.05, and ∼1 μg of total cDNA per 35-mm dish. The transfection was allowed to proceed at 37°C for ∼15 h, after which the medium was changed.
Single-channel Recordings
Recordings were performed in the cell-attached configuration (Hamill et al., 1981) at ∼22°C, ∼24 h after changing the culture medium. Patch pipettes pulled from borosilicate capillaries (Sutter Instruments) were coated with Sylgard (Dow Corning Corporation) and fire polished. Pipette resistances typically ranged between 8 and 10 MΩ. To maximize control on the voltage applied to the patch, a potassium-based bath solution was used. This solution, which was also used in the pipette, contained (in mM) 142 KCl, 5.4 NaCl, 1.8 CaCl2, 1.7 MgCl2, and 10 HEPES/KOH, pH 7.4. In addition, the pipette solution contained the agonist(s) (ACh, choline, or both) at the indicated concentrations. The chloride salts of ACh and choline were obtained from Sigma-Aldrich and were used without further purification. All other chemicals were obtained from Acros Organics.
For the activation-competition assay of the wild-type AChR, the concentration of ACh in the pipette solution was varied from 0 to 200 μM, whereas that of choline was varied from 0 to 50 mM (Table I). For the one-dimensional (1-D) concentration–response assay of the αS269I mutant, the concentration of choline in the pipette solution was varied from 200 μM to 50 mM. Unless otherwise stated, the patch pipette was held at a potential of +100 mV (i.e., the transmembrane potential was −100 mV). Single-channel currents were recorded using an Axopatch 200B amplifier (Molecular Devices), stored in videotape format using a PCM-VCR combination (VR-10B, f c = 37 kHz; Instrutech Corporation), and digitized at 100 kHz (National Instruments card PCI-MIO-16E-4).
TABLE I.
Composition of the Different Binary Mixtures of Agonists Used in the Activation-competition Assay
| [ACh] (μM) | |||||||||||||
|---|---|---|---|---|---|---|---|---|---|---|---|---|---|
| [Choline] (mM) | 0 | 5 | 10 | 14 | 20 | 32 | 50 | 70 | 100 | 120 | 140 | 200 | |
| 0 | X | X | X | X | X | X | X | X | X | X | |||
| 0.2 | X | X | X | ||||||||||
| 0.5 | X | X | X | ||||||||||
| 1 | X | X | X | ||||||||||
| 2 | X | X | X | X | X | X | X | X | X | X | |||
| 5 | X | X | X | ||||||||||
| 10 | X | X | X | ||||||||||
| 14 | X | X | X | ||||||||||
| 20 | X | X | X | X | X | X | X | X | X | X | |||
| 32 | X | X | X | ||||||||||
| 40 | X | X | X | ||||||||||
| 50 | X | X | X | ||||||||||
Data Analysis
Preprocessing.
The QuB suite of programs (www.qub.buffalo.edu) was used for data analysis, in combination with subroutines developed in-house. As a first step, the digitized single-channel recordings were inspected visually. Sections of the data with extra noise (e.g., arising from membrane instability), with simultaneous openings of more than one channel, or with endogenous channel activity were excluded from subsequent analyses. Occasionally, some patches displayed a small fraction of clusters of openings with a Popen that differed considerably from that of the mean behavior. These sections were also excluded from the present analysis. The remaining data were segmented into stretches no longer than 500 ms, and these were subjected to idealization (effective bandwidth ≅ DC-18 kHz) using a segmental k-means method based on a hidden Markov modeling procedure (SKM option in QuB; Qin, 2004). Amplitudes of single-channel currents, as well as the mean durations of all open and shut intervals within these segments, were also estimated during the idealization step. The resulting idealized segments were concatenated such that all excluded portions of the recording were considered as baseline. This ensured that all idealized openings retained their “positions” in real time. All idealized files corresponding to recordings displaying stable current amplitudes were channeled into the subsequent analytical procedures.
Cluster Identification.
Clusters of single-channel openings were defined as series of openings separated by shuttings (i.e., sojourns in a nonconductive conformation) shorter than a critical time, tcrit. All shuttings shorter than tcrit were interpreted as sojourns in closed states, whereas all shuttings longer than tcrit were interpreted as sojourns in desensitized states. However, due to the exponential nature of dwell-time distributions, no tcrit value can perfectly separate “short” from “long” sojourns, and some misclassification is, therefore, inevitable. This is a well-recognized problem in single-channel analysis, and a number of approaches, which differ in the particular aspect of the misclassification that is controlled, have been suggested. We chose to use the general idea behind the criterion proposed by Jackson et al. (1983), according to which tcrit is the time value that minimizes the fraction of misclassified shuttings. The fraction of events that are misclassified when making such a “brick-wall” cut to an exponential distribution is given by:
 |
(2) |
where a and τ denote the areas and time constants of the dwell-time distribution, and t crit denotes the time value used to make the “cut” between the mth and the (m + 1)th components of a total of n exponential components. The t crit value that minimizes the fraction of misclassified intervals in Eq. 2 can be found by numerically solving Eq. 3 (we used Maple 6.0 software; Waterloo Maple):
 |
(3) |
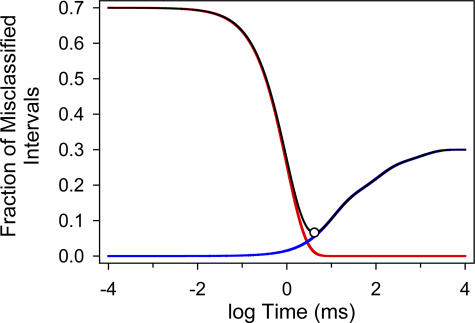
A modification that we deemed necessary with respect to previous applications of this criterion is that, here, Eqs. 2 and 3 include the areas and time constants of all the components of the distribution, not only those of the two components flanking the cut. Thus, the first term on the righthand side of Eq. 2 gives the fraction of intervals that happen to be longer than t crit despite belonging to one of the components to the left of the cut (1 ≤ i ≤ m), whereas the second term gives the fraction of intervals that happen to be shorter than t crit despite belonging to one of the components to the right of the cut (m + 1 ≤ j ≤ n). To illustrate this procedure graphically, Eq. 2 is plotted in Fig. 3 for a shut-time distribution with simulated parameters.
Figure 3.
Estimation of the critical time (t crit) for cluster definition. The black line plots the fraction of misclassified shuttings (Eq. 2) for a hypothetical shut-time distribution consisting of four components. The areas (ai) and time constants (τi) are: a1 = 0.7, τ1= 1.0 ms; a2 = 0.15, τ2 = 10.0 ms; a3 = 0.1, τ3 = 100.0 ms; and a4 = 0.05, τ4 = 1000.0 ms. If the cut were intended to separate shuttings belonging to component 1 from those belonging to components 2–4, then the time value that minimizes the fraction of (inevitably) misclassified intervals (t crit) can be calculated (Eq. 3) to be 4.16 ms (open circle). At t = 4.16 ms, the fraction of misclassified shuttings (black line) is at the minimum value of 0.066. The red line gives the fraction of total shuttings that belong to component 1 and yet are misclassified as belonging to components 2–4. The blue line gives the fraction of total shuttings that belong to components 2–4 and yet are misclassified as belonging to component 1. Note that at t = t crit, the contributions of the red line and the blue line plots to the misclassified fraction are different. This was also the case for all the experimentally obtained distributions analyzed in this paper.
Because kinetic models cannot be avoided in QuB, the parameters of the probability density function (pdf) that best describes each shut-time distribution were computed from the estimates of transition rates with approximate allowance for missed events (Qin et al., 1996). In turn, these transition rates were estimated from maximum-likelihood fits to each idealized sequence of dwell times using the MIL option in QuB (Qin et al., 1996). The kinetic schemes used in this step were not ascribed any particular physical meaning and were simply chosen so as to maximize the likelihood of the parameters. This procedure is justified insofar as we are not using the transition rates themselves but the time constants and areas calculated from them. It has been shown that kinetic models that include all possible shut state ⇌ open state transitions but do not allow for any shut state ⇌ shut state or open state ⇌ open state transition (sometimes referred to as “uncoupled” models) can be used to obtain the best possible fit to the idealized sequence of open and shut times (Kienker, 1989; Rothberg and Magleby, 1998; Gil et al., 2001). However, the large number of free parameters in these models (2 × number of shut states × number of open states, without imposing any detailed balance constraint) makes the fit with MIL (Qin et al., 1996) increasingly more difficult as the number of states in the kinetic scheme increases. Most notably, the maximization algorithm becomes prone to get “trapped” in local maxima, an observation made by others as well (Qin, and Li, 2004). Empirically, we found that fits of our data with linear, (shut state)n ⇌ (open state)m models, albeit attaining a lower maximum likelihood than uncoupled models with the same number of shut and open states, yielded areas and time constants that were very close to those obtained with the uncoupled model but were much less prone to technical problems. Hence, depending on the total number of states in the model, the transition rates of one or the other model were fitted to the dwell-time series using the full maximum-interval-likelihood approach in QuB. The number of shut and open states that best describes the data was determined by applying the Schwarz criterion (one of several statistical criteria; Schwarz, 1978), according to which every additional transition rate in the kinetic model is justified as long as it increases the maximum log-likelihood value by at least [ln(N)]/2, where N is the total number of events in the dwell-time series after imposing the time resolution. The latter was 25 μs, for both open and shut times, for all analyzed dwell-time series. It is useful to note here that the pdf that results from applying the missed-event correction implemented in MIL (a first-order approximation; Roux and Sauvé, 1985; Qin et al., 1996) to the estimated transition rates retains the form of a mixture of exponential densities with the same number of components as the perfect-resolution pdf.
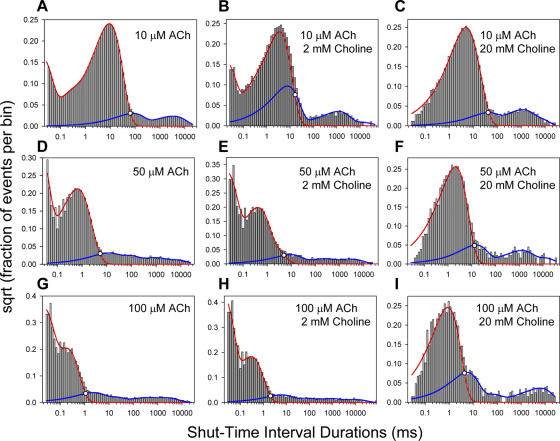
Fig. 4 shows examples of experimental shut-time distributions obtained over a range of ACh-choline concentrations. Since shut-time distributions were typically best described by more than two components, and because time constants attributable to sojourns in closed states are not necessarily much shorter than those attributable to dwells in desensitized conformations (especially at low agonist concentrations), the cut site was not always obvious. To facilitate this, we checked for consistency among the t crit values estimated for different patches exposed to the same agonist solution and examined the trend in the t crit values across the range of concentrations studied. For example, at a fixed concentration of choline (Table I), increasing concentrations of ACh are expected to increase the (intracluster) Popen and, thus, to reduce t crit. At the fixed concentrations of ACh used here (Table I), on the other hand, increasing concentrations of choline are expected to decrease the Popen and, therefore, to increase t crit. The t crit values thus estimated were used to segment the idealized dwell-time series into clusters, but only those containing a minimum of five openings (and four closures) were retained for further analysis; we found that imposing this threshold was often necessary to eliminate openings of dubious origin. Intracluster open- and shut-interval durations of any given patch were averaged to calculate their respective means (τopen and τclosed), which, after the appropriate corrections to account for channel block, were combined to calculate the mean intracluster Popen:
 |
(4) |
The reported Popen values and standard errors were calculated from the means of individual patches. In Figs. 5 and 6, we present examples of single-channel clusters identified using the procedures discussed above.
Figure 4.
Examples of experimentally obtained shut-time distributions, and calculation of t crit values. For each histogram, the red and blue lines are the mixtures of exponential densities corresponding to the components to either side of the cut (see Materials and Methods). It can be shown that the t crit for any given distribution (open circles) coincides with the time value at which these two exponential densities intersect (Eq. 3). The sum of the red and blue lines gives, of course, the mixture of exponential densities corresponding to all the components of the distribution (bear in mind, though, that the ordinates are plotted as the square root). The t crit value, the total number of shuttings, and the fraction of misclassified shuttings in these example histograms are, respectively, as follows: A: 65.44 ms, 12,051, 0.008; B: 15.92 ms, 19,664, 0.124; C: 45.03 ms, 19,239, 0.012; D: 5.40 ms, 45,564, 0.007; E: 5.14 ms, 34,274, 0.008; F: 12.41 ms, 4,029, 0.022; G: 1.09 ms, 40,149, 0.009, H: 1.99 ms, 29,204, 0.004, I: 4.28 ms, 4,707, 0.054.
Figure 5.
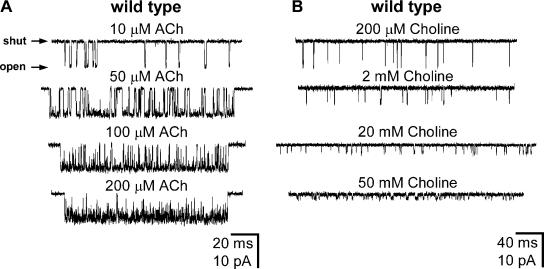
Wild-type AChR single-channel inward currents elicited by various concentrations of ACh (A) or choline (B). Membrane potential ≅ −100 mV. Display f c ≅ 4 kHz. Openings are downward deflections. With the exception of the 200 μM and 2 mM choline traces (which are arbitrarily chosen sections of data), all stretches of currents are example clusters of single-channel openings identified as elaborated in Materials and Methods. In the presence of choline alone, clusters of openings could be identified only at [choline] ≥ 14 mM. For display purposes only, the durations of plotted clusters are similar, but these do not reflect the mean cluster duration under each agonist condition. At the concentrations studied here, fast open-channel block by ACh is manifest as a concentration-dependent increase in the proportion of brief shuttings. Fast open-channel block by choline is manifest as a concentration-dependent decrease in the (apparent) single-channel current amplitude and as a prolongation of the (apparent) open times (Purohit and Grosman, 2006). Note the different time scales in A and B.
Figure 6.
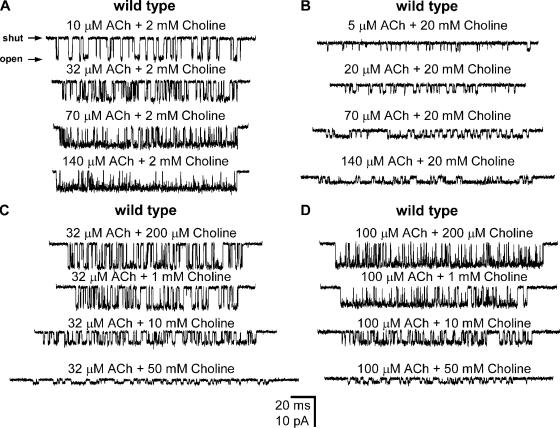
Example clusters of wild-type AChR single-channel inward currents elicited by mixtures of ACh and choline. (A) [ACh]: variable; [Choline]: 2 mM. (B) [ACh]: variable; [Choline]: 20 mM. (C) [ACh]: 32 μM; [Choline]: variable. (D) [ACh]: 100 μM; [Choline]: variable. Membrane potential ≅ −100 mV. Display f c ≅ 4 kHz. Openings are downwards. The durations of plotted clusters do not reflect the mean cluster duration under each agonist condition.
Corrections for Block.
At some of the concentrations employed in the assay, the interaction of both ACh (≥100 μM) and choline (≥1 mM) with the channel's pore domain results in detectable channel block and in the ensuing distortion of the dwell-time distributions. In the range of ACh concentrations tested here, channel block by ACh was manifest mainly as multiple brief shuttings which, in the absence of an appropriate correction, would be erroneously interpreted as closures. To alleviate the effect of this distortion, we assumed that a time value, tblock, can be defined such that all shuttings shorter than tblock correspond to blocking events, and all shuttings longer than this threshold (but shorter than tcrit) correspond to channel closures. tblock was calculated by applying Eqs. 2 and 3, assuming that most blocked sojourns are contained within the briefest shut-time component. The average tblock value across patches was ∼75 μs. Next, we modified the list of dwell times corresponding to the individual clusters such that all shuttings shorter than tblock were “absorbed” by the flanking open-state sojourns, in an attempt to make channel block “disappear.” Dwell times within these “corrected” clusters were then used to calculate, first, the mean open and closed times (τopen and τclosed) and, finally, the Popen (Eq. 4). It should be noted that the Popen values so calculated are overestimated because closures briefer than tblock are also absorbed. For example, closures involving a single sojourn in the diliganded closed state have a mean lifetime of a few tens of microseconds, well below typical tblock values. Not correcting for ACh block at all, on the other hand, would have yielded underestimated Popen values.
Choline also blocks the AChR. However, individual choline block events could not be resolved as discrete shuttings (most likely owing to a much faster kinetics of binding/unbinding to/from the pore). Instead, choline block was manifest as both, the attenuation of the single-channel current amplitude and as the prolongation of apparent open times (see Purohit and Grosman on p. 703 of this issue). The procedure followed to account for this prolongation (which, unless corrected, would have led to the overestimation of the Popen) is presented in detail in the accompanying paper (see Eqs. 6 and 7 in Purohit and Grosman, 2006). In brief, it consisted of dividing the observed mean open-time values (τopen) by a factor that accounts for the slower shutting rate (a factor of ∼12) of choline-blocked channels:
 |
(5) |
where F (the fractional current) is the single-channel current amplitude at each choline concentration normalized by the amplitude measured at low, nonblocking concentrations. In the case of recordings made in the presence of mixtures of ACh and choline, the two corrections were applied sequentially.
Unlike the open-time distributions, the distributions of shut times were not corrected for channel block. Although the effect of block on the duration of shut intervals is more difficult to characterize than that on open intervals, we presented evidence (Purohit and Grosman, 2006) for the notion that, at least in the range of choline concentrations used in these papers, the observed choline-diliganded opening rate remains quite close to its expected value at zero concentration of blocker (i.e., the opening rate constant of the choline-diliganded unblocked AChR). Therefore, a correction was deemed unnecessary.
Constructing Concentration–Response Plots.
Computed mean open (τopen) and mean closed times (τclosed), corrected for channel block as needed, were substituted into Eq. 4 to estimate the corresponding Popen values. For the activation-competition assay, the Popen was plotted as a function of the two independent variables, [ACh] and [choline]. The data were interpreted in the framework of the kinetic scheme in Fig. 7 and were fitted with Eq. 6 (see Results) using SigmaPlot software (SPSS). The transmitter binding site affinities of the closed wild-type AChR for the two agonists were extracted as free parameters of this fit. In the case of the 1-D concentration–response analysis of the αS269I mutant, the plot of Popen vs. [choline] was generated. The data were fitted with Eq. 7 (see Results), and the affinity of the closed αS269I AChR for choline was extracted as a free parameter of the fit.
Figure 7.
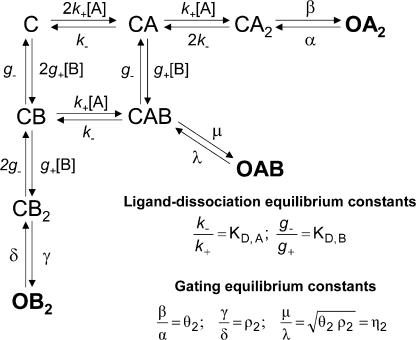
Kinetic scheme used to interpret the activation-competition assay data. A and B denote the two agonists of different efficacy present simultaneously during the assay. The two transmitter binding sites were assumed to have equivalent and independent KD values, whereas unliganded openings, monoliganded openings, desensitized states, and blocked states were omitted (see Discussion for a justification). From the assumed equivalence and independence of the binding free energies associated to each binding site, the gating equilibrium constant of the heterodiliganded receptor was calculated as the geometric mean of the experimentally estimated efficacies of the two agonists in the mixture. The inset shows the definitions of the equilibrium constants in the model. This kinetic scheme is the same as that used by Liu and Dilger (1993) to study the activation of the muscle AChR by mixtures of decamethonium and ACh although, in our case, blocked states were not included; channel block was fully accounted for separately.
Appraisal of the Methodology
One can definitely think of simpler, more direct ways of dealing with channel block. Instead of having to correct the data to account for the distorting effects of block, one could have incorporated this phenomenon into the kinetic scheme in Fig. 7 and fitted the “crude” Popen values with the corresponding function. Exactly the same could be said of our way of classifying shut intervals into closed and desensitized sojourns (for the identification of clusters of single-channel openings), which has always some error associated with it. However, accounting for channel block and desensitization explicitly in the kinetic model would have implied the inclusion of, at least, six more states to the reaction scheme (three open-blocked states and three desensitized states; Fig. 7) and most likely many more (see below). This would have complicated Eq. 6 (by having at least six more unknowns) to a point where the unknowns of interest (i.e., the closed-state affinities) might no longer be estimated reliably. These considerations led us to adopt the sequential approach presented here.
It could also be asked why the KD values for choline and ACh were not calculated from the rate constants of the kinetic scheme in Fig. 7, which, in turn, could have been estimated directly by applying a full-maximum-likelihood approach to the idealized series of openings and shutting within clusters. Our reason for not doing so is that fitting rate constants directly would have implied the use of a kinetic model that correctly accounts for block by the agonist itself. Since the closing rate constant of choline-blocked channels is not zero (i.e., a “linear” block model does not describe the data; Purohit and Grosman, 2006), a complete kinetic scheme should include a reaction step for the association/dissociation of choline to/from the closed-channel pore (not only to/from the open-channel pore), and a step for the gating reaction of the choline-blocked channel (not only of the unblocked channel) for, at least, each diliganded configuration of the receptor (i.e., choline diliganded, ACh diliganded, and heterodiliganded). Similarly, reaction steps should be added to represent block by ACh. Overall, this seems too complex a kinetic model for the transition rates to be estimated correctly; thus, we chose to extract Popen estimates and fit them with Eq. 6.
Recently, a full-maximum-likelihood approach (Qin et al., 1996) was applied to data recorded from the mouse muscle AChR exposed to mixtures of carbachol and choline, using a kinetic model that does not account for channel block (Akk et al., 2005). The results from a number of patches were analyzed independently, and a different KD value for choline was estimated for each of them. The average of the estimates for the wild-type AChR was ∼1.3 mM.
RESULTS
The Activation-competition Assay
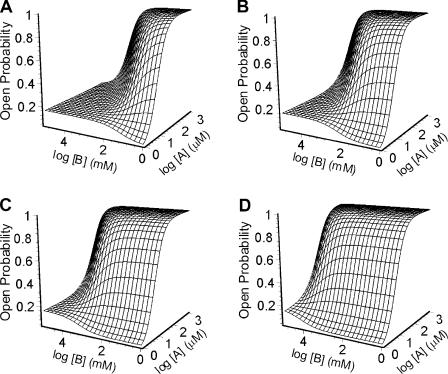
The activation-competition assay introduced here can be regarded as a two-dimensional version of the more common, 1-D, single-channel concentration–response curve. The experimental estimation of binding affinities for low-efficacy agonists poses some challenges that cannot be easily overcome using standard approaches (Fig. 2 B). We found, however, that the use of binary mixtures of ligands containing the low-efficacy agonist of interest and a high-efficacy agonist (the affinity for which need not be known) is a simple “trick” that makes the estimation of affinities for weak agonists feasible. Fig. 8 illustrates this point graphically with simulated data. Unlike the plot in Fig. 2 B, the shape of the surface in Fig. 8 is clearly sensitive to the different affinities of the simulated low-efficacy agonists. Fig. 7 shows the kinetic scheme we used to interpret the activation-competition assay, and Eq. 6 is the function that describes the Popen (i.e., the sum of the occupancy probabilities in OA2, OB2, and OAB) as a function of the concentrations of the two agonists in the mixture. In Eq. 6 (see above), A and B denote the concentrations of the two ligands in the mixture, KD,A and KD,B are their respective dissociation equilibrium constants from the closed-state transmitter binding sites, and θ2, ρ2, and η2 are the gating equilibrium constants of the receptor doubly liganded with A, doubly liganded with B, or heterodiliganded (Fig. 7).
| (6) |
Figure 8.
Simulated plots illustrating the activation-competition assay. The different surfaces correspond to the expected responses in the presence of four hypothetical binary mixtures, consisting of the same high-efficacy agonist and four different low-efficacy agonists. The plots were calculated in the context of the kinetic scheme in Fig. 7, using Eq. 6. For the high-efficacy agonist, A, KD = 50 μM and θ2 = 100. The four low-efficacy agonists, B, have the same diliganded gating equilibrium constant (ρ2 = 0.2; see Fig. 7 for notation) but differ in their affinities. (A) KD,B = 10 μM. (B) KD,B = 100 μM. (C) KD,B = 1 mM. (D) KD,B = 10 mM. The plots illustrate the sensitivity of the “shape” of the surface to differences in the affinities for low-efficacy agonists.
It is important to note, here, that the kinetic scheme in Fig. 7, and therefore Eq. 6, is based on a number of assumptions that are discussed and validated in the Discussion: (a) that the two AChR transmitter binding sites are functionally equivalent and independent (at least in terms of their KD values), (b) that unliganded and monoliganded openings of the wild-type AChR make a negligible contribution to the Popen, and (c) that the gating equilibrium constant of the ACh-choline heterodiliganded receptor (η2) can be calculated as the geometric mean of the respective homodiliganded gating equilibrium constants (θ2 and ρ2; Fig. 7). Finally, desensitized states were not explicitly included in the model because sojourns in these states were considered to be excluded from the clusters of openings and closures that were fitted with Eq. 6 (see Materials and Methods), and because the extent to which entry into desensitization shortens the lifetime of the open state is negligible in the wild-type AChR (Purohit and Grosman, 2006). Likewise, blocked states were omitted from the scheme because their occurrence was accounted for before the fitting with Eq. 6 (see Materials and Methods).
Affinities of the Closed Wild-type AChR for ACh and Choline
Encouraged by the simulations shown in Fig. 8, we embarked on applying the activation-competition assay to experimental data, with the goal of estimating the affinity of the closed-AChR's transmitter binding sites for choline, an endogenous low-efficacy agonist. Over 50 agonist conditions were assayed (Table I), and the corresponding intracluster Popen values, averaged across different patches, were plotted as a function of the concentrations of choline and ACh (Fig. 9). To reduce the number of free parameters in Eq. 6, we fixed the values of the three gating equilibrium constants, (θ2, ρ2, and η2; Fig. 7) to their independently determined values. We fixed the value of θ2 (ACh-diliganded gating) to 25, on the basis of recent single-channel estimates (Hatton et al., 2003), although reported values range from 15 to 50, approximately. We fixed ρ2 (choline-diliganded gating) to 0.035, as determined from the ratio of the opening and closing rate constants of the choline-diliganded AChR (∼125 s−1 and ∼3,900 s−1, respectively; Purohit and Grosman, 2006). Lastly, we fixed η2 (heterodiliganded gating) to (θ2ρ2)0.5 = 0.935, following the assumption that the contributions of the two transmitter binding sites to the total binding free energy are equivalent and independent of each other. To the extent that the heterodiliganded configuration cannot be isolated from the two homodiliganded forms, and that the contribution of heterodiliganded open sojourns to the total Popen is small (see Figs. 13 and 14 in Discussion), the experimental estimation of η2 is not straightforward. Hence, we chose to calculate it.
Figure 9.
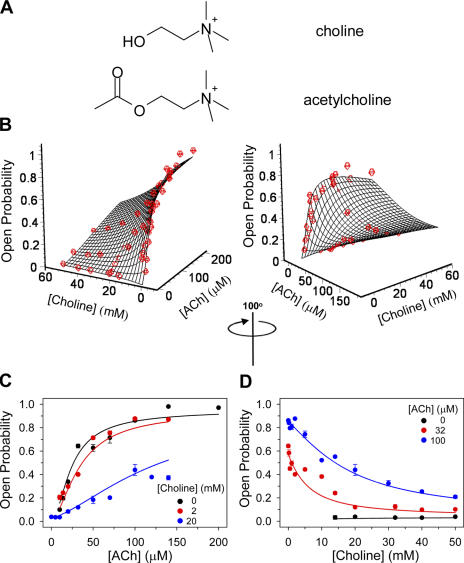
The affinity of the wild-type AChR's closed state for choline. (A) Structures of choline and ACh. (B) The KD values for ACh and choline were estimated by globally fitting Eq. 6 to the entire experimental dataset of an activation-competition assay. KD, ACh and KD, Choline were estimated to be 106 ± 6 μM, and 4.1 ± 0.5 mM, respectively. The other parameters in Eq. 6 were fixed as follows: θ2 = 25, ρ2 = 0.035, and η2 = (θ2ρ2)0.5 = 0.935. Two views of the same 3-D plot, rotated by 100°, are shown. (C) Data displayed as 1-D concentration–response plots, with the concentration of choline in the pipette fixed at the indicated values. Note that the solid lines were calculated using the parameters obtained from the global fit. (D) Data displayed as 1-D concentration–response plots, with the concentration of ACh in the pipette fixed at the indicated values. The solid lines were calculated using the parameters obtained from the global fit. Vertical error bars in C and D are standard errors.
Figure 13.
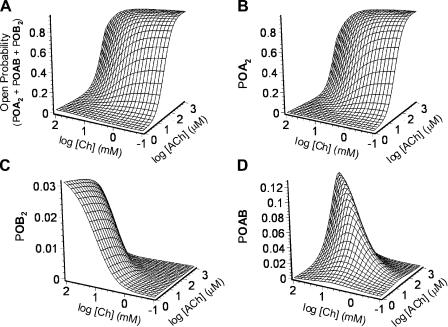
Contribution of homodiliganded and heterodiliganded open probabilities to the total Popen in the presence of a binary mixture of agonists. The Popen due to all three open configurations in Fig. 7 is given by the sum of their respective individual occupancy probabilities. The wild-type KD, ACh and KD, Choline values, estimated as illustrated in Fig. 9, were used, along with the independently estimated values of the three gating equilibrium constants, to calculate (A) the total Popen; (B) the probability of the AChR being open and diliganded with ACh (POA2); (C) the probability of the AChR being open and diliganded with choline (POB2); and (D) the probability of the AChR being open and diliganded with one molecule of ACh and one of choline (POAB). In the wild-type receptor, there is an upper limit for the latter of ∼0.13.
Figure 14.
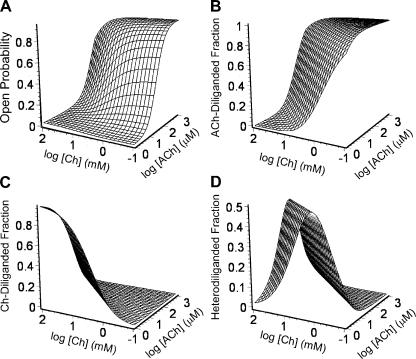
The total Popen and the ACh-diliganded, choline-diliganded, and heterodiliganded fractions. This figure is similar to Fig. 13 but, here, the contributions of the three open configurations to the total Popen are expressed as ratios (fractions). (A) Total Popen (the same plot as in Fig. 13 A). (B) ACh-diliganded fraction = POA2/Popen. (C) Choline-diliganded fraction = POB2/Popen. (D) Heterodiliganded fraction = POAB/Popen. The maximum contribution of ACh-choline heterodiliganded openings to the total Popen is ∼50%, and this fraction decreases steeply outside a narrow range of ACh-choline combinations.
The fit of the 2-D concentration–response surface in Fig. 9 with Eq. 6 yielded the dissociation equilibrium constants of ACh (KD, ACh) and choline (KD, Choline) from the wild-type AChR's closed state. These values are 106 ± 6 μM and 4.1 ± 0.5 mM, respectively. Thus, the affinity of the closed-state transmitter binding sites for ACh is larger than that for choline by a factor of ∼40.
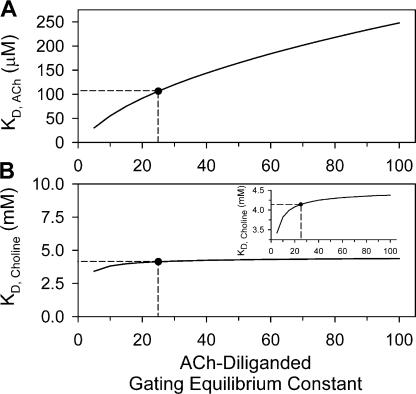
To evaluate how sensitive the KD estimates are to the particular value assumed for θ2, we repeated the fitting procedure assuming different θ2 values ranging from 5 to 100. Fig. 10 shows that KD, ACh estimates depend strongly on the particular value at which θ2 is fixed, ranging from 30.4 μM, at θ2 = 5, to 248 μM, at θ2 = 100. On the other hand, however, KD, Choline estimates are fairly consistent, ranging from 3.4 mM, at θ2 = 5, to 4.4 mM, at θ2 = 100. We conclude that the extraction of KD values for low-efficacy agonists, using the activation-competition assay, is robust even if the gating equilibrium constant of the high-efficacy partner in the mixture (which is generally difficult to estimate accurately) is not known with certainty.
Figure 10.
Sensitivity of closed state affinity estimates to assumptions. The estimation of KD, ACh and KD, Choline, shown in Fig. 9, was based on a number of assumptions. Here, we tested the sensitivity of these estimates to the particular value of ACh-diliganded gating equilibrium constant (θ2) assumed. We refitted the Popen vs. concentration data (Fig. 9) with θ2 fixed at values between 5 and 100. The values of the choline-diliganded (ρ2) and the heterodiliganded (η2) gating equilibrium constants remained fixed at 0.035 and (θ2ρ2)0.5, respectively, as in Fig. 9. These plots show that the KD, ACh estimate is strongly correlated with the value at which θ2 is fixed (A), and that the KD, Choline estimate is, in contrast, quite robust (B). The black circles denote the KD estimates at θ2 = 25, a very likely value for this gating equilibrium constant. The correlation between efficacy and affinity for ACh illustrated in A is the same correlation illustrated in the simulated 1-D concentration–response curve of Fig. 2 A for high-efficacy agonists in general. The activation-competition assay does not overcome this problem; that is why we propose the use of this novel approach as a tool to estimate the affinities for low-efficacy ligands. Note the different scales on the y axes in A and B. In the inset, the y axis in B is magnified.
Affinity of the Closed αS269I AChR for Choline
Although functional studies of site-directed mutants have become the staple fare of structure–function relationships in proteins, a clear identification of the functional aspect that is affected by any given mutation is rarely simple. In the particular case of ligand-gated ion channels, an increased diliganded gating equilibrium constant, for instance, could be due to an effect of the mutation on ligand binding (more specifically on the affinity ratio KD/JD) and/or on unliganded gating (Fig. 1 and Eq. 1), and this distinction is absolutely necessary if we want to understand how structure gives rise to function.
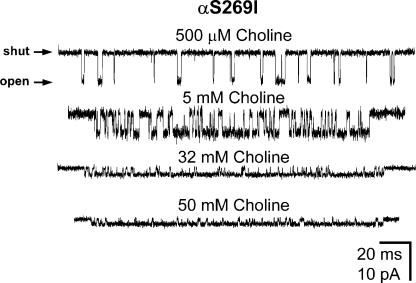
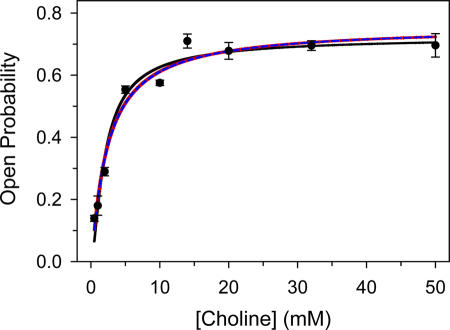
As an example, we analyzed the αS269I AChR, a receptor harboring a mutation in the (extracellular) M2–M3 linker (Croxen et al., 1997). Because this mutant has a gain-of-function phenotype (Croxen et al., 1997; Grosman et al., 2000a), a high-efficacy ligand like ACh becomes an impractical tool to probe the effect of the mutation on ligand binding (Fig. 2 A) and, instead, a weak agonist like choline may be preferred (Grosman and Auerbach, 2000). Fig. 11 shows representative single-channel clusters of openings in the presence of increasing concentrations of choline alone. The use of binary mixtures of ligands was not necessary because the efficacy (θ2) of choline on this mutant is such that the limitations that apply to very high and very low efficacy agonists (Fig. 2), and which prompted the development of the activation-competition assay, do not hold for this receptor–ligand pair. Fig. 12 shows the (1-D) concentration–response relationship obtained after applying the appropriate corrections for choline block to single-channel clusters identified following the same procedures as for the wild type. The Popen curve was fitted with Eq. 7, the one-agonist-only version of Eq. 6. That is, Eq. 7 assumes that the two transmitter binding sites have equivalent and independent KD values, that desensitization shortens the lifetime of this mutant's open state to a negligible extent, and that the contribution of unliganded and monoliganded openings to the total Popen (in the 500 μM to 50 mM choline concentration range used here) is negligible, even when the unliganded gating equilibrium constant of this mutant is larger than the wild type's (Grosman, 2003):
 |
(7) |
where A denotes the concentration of choline, KD is the choline dissociation equilibrium constant from the closed-state transmitter binding sites, and θ2 is the choline-diliganded gating equilibrium constant. The fit of the 1-D concentration–response curve shown in Fig. 12 with Eq. 7 (solid black line), with both KD and θ2 set as free parameters, yielded KD = 2.6 ± 0.5 mM and θ2 = 2.6 ± 0.3. Thus, the ∼75-fold increase in the choline-diliganded gating equilibrium constant caused by the αS269I mutation (2.6/0.035 ≅ 74), is accompanied by only a modest change in the closed-state affinity for choline (2.6 versus 4.1 mM). The increased θ2 value of the mutant must then be due to a higher open-state affinity for choline (i.e., a lower JD value) and/or a larger unliganded gating equilibrium constant (Fig. 1 and Eq. 1). If one could experimentally estimate JD, then one could calculate the unliganded gating equilibrium constant applying Eq. 1. Conversely, if one could experimentally estimate the unliganded gating equilibrium constant, one could calculate JD. Doing this would provide us with a more complete picture of the functional consequences of the αS269I mutation.
Figure 11.
Example clusters of αS269I AChR single-channel inward currents elicited by various concentrations of choline. Membrane potential ≅ −100 mV. Display f c ≅ 4 kHz. Openings are downwards. Clusters were identified as described in Materials and Methods. Note that, since fast open-channel block by choline results in a concentration-dependent prolongation of the (apparent) open times (Purohit and Grosman, 2006), the intracluster Popen “looks” higher than it actually is.
Figure 12.
The affinity of the αS269I AChR's closed state for choline. The KD value for choline was estimated by fitting Eq. 7 (black solid line) to the experimental data of a 1-D concentration–response assay (mixtures of agonists were not necessary here). Both KD, Choline and θ2 were set as free parameters and were estimated to be 2.6 ± 0.5 mM, and 2.6 ± 0.3, respectively. Eq. 7 assumes that both transmitter binding sites have equivalent and independent KD values. The data were also fitted with Eqs. 10–12, and the estimated parameter values are given in Table II. Eq. 10 (red solid line) assumes that the binding sites are different and independent, Eq. 11 (blue dashed line) assumes that the binding sites are equivalent and interacting, and Eq. 12 assumes that the binding sites are different and interacting. The fits with these three expressions are almost indistinguishable. The fit with Eq. 12 (not shown for clarity) yielded KD estimates that were very sensitive to the initial guesses and were very poorly defined (i.e., the coefficients of variation were very large). Vertical error bars are standard errors.
Affinity of the Open αS269I AChR for Choline
Unlike KD values, JD values of the AChR cannot be estimated directly from single-channel concentration–response data. The reason for this is clearly illustrated by Eq. 8. Considering the upper half of the kinetic scheme in Fig. 1, that is, the three closed states (C, CA, and CA2) and the three open states (O, OA, and OA2), and expressing the unliganded and monoliganded gating equilibrium constants in terms of all other equilibrium constants in the scheme, the Popen due to the three open states is given by:
 |
(8) |
From this expression, and remembering that for agonists KD > JD (in the case of ACh, for example, KD ≅ 100 μM, and JD should be a few nanomolar), it follows that if intracluster Popen values could be measured at very low agonist concentrations (comparable to or even lower than JD), then both KD and JD values could be experimentally estimated. However, the lowest concentration of agonist that is needed to elicit identifiable clusters is generally much higher than the corresponding JD value. For instance, as much as 10 μM ACh was needed in this study to elicit clear clusters of wild-type AChR openings, and as much as 14 mM was needed in the case of choline (the JD of which should be in the micromolar range). As a result, JD + A ≅ A, and Eq. 8 becomes Eq. 7, which does not depend on JD. Hence, experimentally obtained concentration–response assays do not provide any information about the affinity of the open-state transmitter binding sites for agonists. Similarly, the impossibility of identifying clusters of unliganded openings arising from individual channels precludes the direct estimation of the unliganded gating equilibrium constant (θo) from recordings made in the absence of agonist.
An alternative approach is to estimate θo from measurements of the Popen in the absence of agonist in patches with a known number of channels; this can be achieved in fast-perfused outside-out patches. Following this procedure, our estimate of θo for the αS269I mutant is (2.3 ± 0.3) 10−6 (unpublished data). Therefore, applying Eq. 1, JD, Choline = 2.4 μM. Thus, the affinity of this mutant for choline increases by a factor of ∼1,000 upon opening (KD, Choline/JD, Choline = 2.6 mM/2.4 μM). However, before we can estimate the extent to which the open-state affinity and the unliganded gating equilibrium constant are affected by the αS269I mutation, we will have to estimate the wild-type value of θo, and then calculate the wild-type value of JD, Choline. This requires a more elaborate experimental assay because the low wild-type unliganded Popen can hardly be measured under our experimental conditions.
DISCUSSION
The Affinity for Low-efficacy Ligands: An Experimentally Elusive Parameter
However paradoxical it may seem at first glance, the affinities of ligand-gated ion channels for agonists are largely unknown. As elaborated above, this is due to a number of experimental and analytical hurdles, and the main goal of this paper was, precisely, to provide a means to overcome some of these difficulties. The activation-competition assay presented here is a novel, 2-D concentration–response assay that enables the simultaneous estimation of the affinities of the closed-channel receptor for a pair of agonists. Although the method can, in principle, be applied to extract the KD values for the two members of the pair, we envisage that it will be particularly useful for the estimation of affinities for low-efficacy agonists because it is the challenges posed by the latter that are specifically addressed by this new approach. In the present study, we estimated the KD for choline, a low-efficacy agonist of the AChR, using ACh as the high-efficacy partner in the mixture.
The Popen vs. concentration data were interpreted in the framework of the kinetic scheme in Fig. 7, which is based on a set of assumptions. First, we assumed the functional equivalence and independence of the two transmitter binding sites. Although the α-δ and α-ɛ/γ agonist binding sites are structurally distinct, their functional equivalence (in terms of their respective KD values) continues to be an unresolved issue (e.g., Sine et al., 1990; Zhang et al., 1995; Wang et al., 1997; Salamone et al., 1999; Hatton et al., 2003). Reports based on the application of global, maximum-likelihood fits to (idealized) adult mouse muscle AChR single-channel currents (using the QuB suite of programs; Qin et al., 1996) have lately suggested that the two binding sites have indistinguishable closed-state affinities for ACh (Salamone et al., 1999), whereas a more recent, comparable analysis of the human counterpart (using the HJCFIT method; Colquhoun et al., 2003) suggested that the affinities are different (Hatton et al., 2003). The extent to which this discrepancy reflects genuine differences between species or differences in the analytical methods employed remains an open question. In the particular case of our activation-competition assay, the assumption of equivalence and independence of the transmitter binding sites turned out to be convenient because it reduces the number of free parameters in Eq. 6 to a manageable level. But if the sites were neither equivalent nor independent of one another, what are we measuring then? For simplicity, we tested the equivalence/independence assumption on the concentration–response data gathered from the αS269I mutant activated (only) by choline. The results of fitting the four possible models (equivalent/independent, equivalent/interacting, different/independent, and different/interacting; see Appendix) are shown in Fig. 12 and Table II. We conclude that, for all four models, a set of parameters can be found that describes very closely the equilibrium concentration–response curve of the αS269I AChR. Under the assumption of equivalence and independence, though, the model is simplest, and the parameter estimates are most uniquely defined. It is evident that observables other than the Popen, more sensitive to the different predictions made by the different models, need to be analyzed before we can settle this vexed question on the basis of a criterion more compelling than that of parsimony. It is our impression that the application of global-fitting maximum-likelihood methods has not been completely successful in this regard either.
TABLE II.
Estimates of KD and θ2 Values for the Choline–αS269I AChR Ligand–Receptor Pair
| Binding site properties | Estimate (mean ± SEM) | C.V. (%) |
|---|---|---|
| Equivalent and independent (Eq. 7 or 9) |
KD =2.58 ±0.46 mM | 17.64 |
| θ2 = 2.65 ± 0.31 | 11.53 | |
| Different and independent (Eq. 10) |
KDA =0.19 ±0.44 mM | 228.5 |
| KDB = 9.47 ± 4.81 mM | 50.73 | |
| θ2 = 3.13 ± 0.62 | 19.97 | |
| Equivalent and interacting (Eq. 11) |
KMONO =0.36 ±0.80 mM | 222.7 |
| KDOUBLY = 4.9 ± 2.25 mM | 46.15 | |
| θ2 = 3.13 ± 0.63 | 20.1 |
KD (dissociation equilibrium constant) and θ2 (diliganded gating equilibrium constant) values were estimated by fitting the appropriate expressions (see Appendix) to the Popen data in Fig. 12. Note the high coefficients of variation (C.V.) associated with the KD estimates obtained by fitting the data with Eqs. 10 and 11. The estimates obtained by fitting the data with Eq. 12 (which assumes that the binding sites are different and interacting) are even more ill defined, and were highly sensitive to the initial guesses; thus, they are not included here. A model that assumes the equivalence and independence of the KD values of the two transmitter binding sites offers the most parsimonious explanation to our observations.
Second, we ignored the occurrence of unliganded and monoliganded openings. This is justified because in the wild-type, the corresponding gating equilibrium constants are so small that the contribution of sojourns in the unliganded or monoliganded open states to the total Popen is negligible at the concentrations of agonist used here to elicit clusters. Even in the absence of a firm estimate, the θo value of the wild-type AChR can be safely assumed to be in the 10−7–10−8 range. From Fig. 1, then, the ACh-monoliganded θ1 value (θ1 = [θ0θ2]0.5) should be close to 10−3, whereas the choline-monoliganded θ1 value should be in the 10−4–10−5 range. These values are, indeed, small.
Finally, the gating equilibrium constant of the ACh-choline heterodiliganded receptor (η2) was fixed to the geometric mean of the respective homodiliganded gating equilibrium constants (θ2 and ρ2). When η2 was allowed to vary during the fitting procedure, the free parameters were estimated to be: KD, ACh = 108 ± 6 μM, KD, Choline = 2.3 ± 0.7 mM, and η2 = 3.1 ± 1.0. Reassuringly, these values compare well with the estimates of KD, ACh = 106 ± 6 μM and KD, Choline = 4.1 ± 0.5 mM, obtained with η2 constrained to its calculated value of 0.935. However, because we find no obvious evidence for deviations from the assumption of equivalence and independence of the two transmitter binding sites (in terms of their contributions to the total binding free energy), we take 106 ± 6 μM and 4.1 ± 0.5 mM as the ACh and choline dissociation equilibrium constants, respectively, from the wild-type AChR in the closed state. It is likely that the difference between the calculated and fitted values of η2 reflects the inherent inaccuracies of the experimental data, and the notion that heterodiliganded receptors do not contribute much to the observed Popen. Figs. 13 and 14 illustrate the contribution of the heterodiliganded and the two homodiliganded forms of the receptor to the total Popen.
Conformation-specific Affinities: Basic and Applied Implications
Understanding the structural basis of a ligand's differential binding to the open and closed forms of a receptor channel represents a large fraction of all we need to know to understand diliganded gating; the rest is unliganded gating. Thus, it is of obvious importance to be able to obtain accurate estimates of conformation-specific affinities. We envision that continued application of the activation-competition assay (to estimate KD values), along with firm estimates of wild-type and mutant unliganded gating equilibrium constants (to calculate JD values), will pave our way toward this paramount goal.
In this paper, we focused on ACh and choline. From their respective θ2 estimates, it can be inferred (Eq. 1) that the increase in affinity for choline upon opening is smaller than that for ACh by a factor of ∼25 ([θ2, ACh/ θ2, Choline]0.5). Because the affinity of the AChR's closed state (1/KD) for choline is lower than that for ACh by a factor of ∼40 (KD, Choline/KD, ACh), it follows that the affinity of the open state (1/JD) for choline must be lower than that for ACh by a factor of ∼1,000 ([θ2, ACh/θ2, Choline)0.5 (KD, Choline/KD, ACh]). Comparatively, then, it is not the binding to the closed state, but the binding to the open state, that is most different between choline and ACh. This highlights the importance of obtaining conformation-specific structural data on the AChR's transmitter binding sites.
From a more practical perspective, we anticipate that improved methodologies to estimate conformation-specific affinities will contribute to further rationalize the process of structure-based drug design in, at least, two ways: first, by providing benchmark affinity values against which the robustness of computational approaches aimed at predicting ligand–protein binding affinities (Morreale et al., 2002; Oostenbrink and van Gunsteren, 2005; Woo and Roux, 2005) can be tested; and second, by providing a “library” of KD, JD, and efficacy values (θ2) that can guide efforts in medicinal chemistry toward the design of ligands with the desired properties (Holladay et al., 1997). In this respect, however, a caveat is in order: what does an experimentally estimated KD value really measure? What happens during a ligand association/dissociation reaction? It is almost certain that binding reactions not only consist of the docking of a ligand to a binding site but, also, involve local rearrangements in the protein, and changes in the conformation of the ligand, that precede the more global conformational change that accompanies gating. Thus, an experimentally obtained KD value would be the equilibrium constant of this complex reaction, which, at least in the muscle AChR, can still be kinetically modeled as a one-step event (e.g., Salamone et al., 1999; Hatton et al., 2003; but see Burzomato et al., 2004, for a probably different situation in the α1β glycine receptor). It is obvious, then, that for computational approaches to make accurate predictions of measured binding affinities, the conformational flexibility of both protein and ligand needs to be fully accounted for in the algorithms. This is not an easy task, however, and constitutes one of the major roadblocks on the way toward the computer-aided rational design of drugs (Teague, 2003).
Low-efficacy Agonists as Tools in Structure–Function Studies
Although the functional consequences of mutations to ligand-gated ion channels are typically classified into “binding” or “gating” effects, we think that it is more sensible to distinguish among effects on the closed-state affinity, the open-state affinity, or the unliganded-gating equilibrium constant (Eq. 1). Also, although most functional studies of AChR mutants use ACh as the ligand (with the understandable justification that ACh is the natural agonist of this receptor), we think that low-efficacy agonists, like choline, offer some important advantages in the case of fast-opening mutants. In the specific case of the αS269I mutation studied here, we can conclude that the closed-state affinity for choline remains practically the same upon mutation (2.6 ± 0.5 mM in the mutant and 4.1 ± 0.5 mM in the wild type). If the open-state affinity also remained largely unaffected by the mutation, then the increase in the choline-diliganded gating equilibrium constant of the αS269I AChR (2.6 in the mutant and 0.035 in the wild type) would be entirely due to the increased unliganded activity (Eq. 1) reported earlier for this mutant (Grosman, 2003). However, because it is still not known how to predict changes in JD on the basis of measured changes in KD, we cannot offer a more complete description of what goes wrong upon the αS269I mutation, at this point. Indeed, what we need to revert this situation is a robust estimate of the wild-type unliganded gating equilibrium constant.
In spite of the many available weak agonists of the AChR, only choline seems to have met the requirements for a convenient functional probe of gain-of-function mutations, thus far. That is, high solubility, structural resemblance to ACh, manageable channel block, and binding/gating properties that can be reliably quantified in the wild-type receptor. It may be noted that some mutations may speed up opening to such an extent that choline may no longer be a useful probe. It is evident that to address these important cases, a wider repertoire of well-characterized low-efficacy agonists is needed.
Acknowledgments
We thank Sergio Elenes and Ying Ni for help with some electrophysiology experiments, Daniel Chang for software development, and Jagoda Jasielec and Jessica Gasser for assistance with cell culture and molecular biology.
This work was supported by National Institutes of Health grant R01 NS042169 to C. Grosman.
Olaf S. Andersen served as editor.
APPENDIX
We tested the assumption that the two AChR transmitter binding sites are functionally equivalent and independent (in terms of their KD values) by fitting the αS269I–choline one-dimensional single-channel Popen curve with the four possible models. We tested this assumption on the αS269I mutant, rather than on the wild type, because the interaction between this mutant and choline can be characterized with a simple 1-D concentration–response relationship (Fig. 12), which greatly facilitates the analysis.
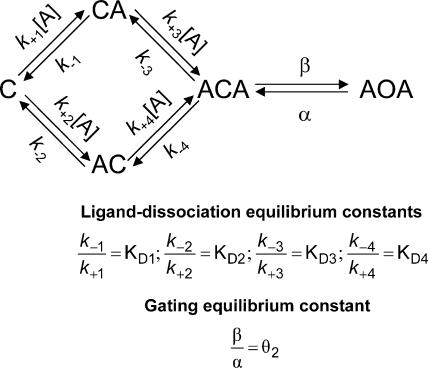
For a receptor with two binding sites, and in the presence of a single ligand, the most general kinetic scheme (omitting unliganded openings, monoliganded openings, and desensitized and blocked states) is given in Fig. 15. The properties of equivalence and independence of the transmitter binding sites can be combined to give rise to four models, each of which is characterized by a different Popen expression.
Figure 15.
Kinetic scheme used to test the assumption of equivalence and independence of the transmitter binding sites in term of their KD values. A denotes the agonist (here, choline), CA and AC denote the two configurations of the closed monoliganded receptor, and ACA and AOA denote the closed and open forms of the diliganded receptor. Different constraints can be applied to the four dissociation equilibrium constants (KD1–KD4) to account for different binding site properties (see Appendix). The inset shows the definitions of the equilibrium constants in the model.
If the two binding sites are equivalent and independent, then (Fig. 15) KD1 = KD2 = KD3 = KD4 = KD, and the Popen (here, PAOA) is given by:
 |
(9) |
where A denotes the ligand concentration, and θ2 is the diliganded gating equilibrium constant. Eq. 9 is, of course, simply another way of writing Eq. 7, but this form is useful for comparison with the expressions corresponding to the models below.
If the two binding sites are different and independent, then KD1 = KD4 = KDA and KD2 = KD3 = KDB, and the Popen is given by:
 |
(10) |
where KDA and KDB are the ligand dissociation equilibrium constants from either binding site regardless of whether both or only one site is occupied.
If the two binding sites are equivalent and interacting, then KD1 = KD2 = KMONO and KD3 = KD4 = KDOUBLY, and the Popen is given by:
 |
(11) |
where KMONO is the ligand dissociation equilibrium constant from either monoliganded receptor configuration (both configurations are equivalent), and KDOUBLY is the ligand dissociation equilibrium constant from either site of the diliganded receptor.
Finally, if the two binding sites are different and interacting, the Popen is given by:
 |
(12) |
where KD4 is expressed in terms of KD1, KD2, and KD3 (KD4 = KD1KD3/KD2, from detailed balance).
The parameter estimates obtained using Eq. 12 (i.e., assuming that the binding sites are different and interacting) were very sensitive to the initial guesses, and the three KD estimates (here, KD1, KD2, and KD3) had very large coefficients of variation. The results of fitting the data with the other three models, using Eqs. 9–11, are summarized in Fig. 12 and Table II.
Abbreviations used in this paper: 1-D, one-dimensional; AChR, nicotinic acetylcholine receptor; Popen, open probability.
References
- Akk, G., L.S. Milescu, and M. Heckmann. 2005. Activation of heteroliganded mouse muscle nicotinic receptors. J. Physiol. 564:359–376. [DOI] [PMC free article] [PubMed] [Google Scholar]
- Brejc, K., W.J. van Dijk, R.V. Klaassen, M. Schuurmans, J. van Der Oost, A.B. Smit, and T.K. Sixma. 2001. Crystal structure of an ACh-binding protein reveals the ligand-binding domain of nicotinic receptors. Nature. 411:269–276. [DOI] [PubMed] [Google Scholar]
- Bunnelle, W.H., M.J. Dart, and M.R. Schrimpf. 2004. Design of ligands for the nicotinic acetylcholine receptors: the quest for selectivity. Curr. Top. Med. Chem. 4:299–334. [DOI] [PubMed] [Google Scholar]
- Burzomato, V., M. Beato, P.J. Groot-Kormelink, D. Colquhoun, and L.G. Sivilotti. 2004. Single-channel behavior of heteromeric alpha1beta glycine receptors: an attempt to detect a conformational change before the channel opens. J. Neurosci. 24(48):10924–10940. [DOI] [PMC free article] [PubMed] [Google Scholar]
- Celie, P.H., S.E. van Rossum-Fikkert, W.J. van Dijk, K. Brejc, A.B. Smit, and T.K. Sixma. 2004. Nicotine and carbamylcholine binding to nicotinic acetylcholine receptors as studied in AChBP crystal structures. Neuron. 41:907–914. [DOI] [PubMed] [Google Scholar]
- Colquhoun, D., C.J. Hatton, and A.G. Hawkes. 2003. The quality of maximum likelihood estimates of ion channel rate constants. J. Physiol. 547:699–728. [DOI] [PMC free article] [PubMed] [Google Scholar]
- Croxen, R., C. Newland, D. Beeson, H. Oosterhuis, G. Chauplannaz, A. Vincent, and J. Newsom-Davis. 1997. Mutations in different functional domains of the human muscle acetylcholine receptor alpha subunit in patients with the slow-channel congenital myasthenic syndrome. Hum. Mol. Genet. 6:767–774. [DOI] [PubMed] [Google Scholar]
- Erreger, K., P.E. Chen, D.J. Wyllie, and S.F. Traynelis. 2004. Glutamate receptor gating. Crit. Rev. Neurobiol. 16(3):187–224. [DOI] [PubMed] [Google Scholar]
- Gardner, P. 1990. Nucleotide sequence of the epsilon-subunit of the mouse muscle nicotinic receptor. Nucleic Acids Res. 18:6714. [DOI] [PMC free article] [PubMed] [Google Scholar]
- Gil, Z., K.L. Magleby, and S.D. Silberberg. 2001. Two-dimensional kinetic analysis suggests nonsequential gating of mechanosensitive channels in Xenopus oocytes. Biophys. J. 81:2082–2099. [DOI] [PMC free article] [PubMed] [Google Scholar]
- Grosman, C. 2003. Free-energy landscapes of ion-channel gating are malleable: changes in the number of bound ligands are accompanied by changes in the location of the transition state in acetylcholine-receptor channels. Biochemistry. 42:14977–14987. [DOI] [PMC free article] [PubMed] [Google Scholar]
- Grosman, C., and A. Auerbach. 2000. Asymmetric and independent contribution of the second transmembrane segment 12' residues to diliganded gating of acetylcholine receptor channels: a single-channel study with choline as the agonist. J. Gen. Physiol. 115:637–651. [DOI] [PMC free article] [PubMed] [Google Scholar]
- Grosman, C., F.N. Salamone, S.M. Sine, and A. Auerbach. 2000. a. The extracellular linker of muscle acetylcholine receptor channels is a gating control element. J. Gen. Physiol. 116:327–339. [DOI] [PMC free article] [PubMed] [Google Scholar]
- Grosman, C., M. Zhou, and A. Auerbach. 2000. b. Mapping the conformational wave of acetylcholine receptor channel gating. Nature. 403:773–776. [DOI] [PubMed] [Google Scholar]
- Hahn, B., C.G.V. Sharples, S. Wonnacott, M. Shoaib, and I.P. Stolerman. 2003. Attentional effects of nicotinic agonists in rats. Neuropharmacology. 44:1054–1067. [DOI] [PubMed] [Google Scholar]
- Hamill, O.P., A. Marty, E. Neher, B. Sakmann, and F.J. Sigworth. 1981. Improved patch-clamp techniques for high-resolution current recording from cells and cell-free membrane patches. Pflugers Arch. 391:85–100. [DOI] [PubMed] [Google Scholar]
- Hatton, C.J., C. Shelley, M. Brydson, D. Beeson, and D. Colquhoun. 2003. Properties of the human muscle nicotinic receptor, and of the slow-channel myasthenic syndrome mutant ɛL221F, inferred from maximum likelihood fits. J. Physiol. 547:729–760. [DOI] [PMC free article] [PubMed] [Google Scholar]
- Holladay, M.W., M.J. Dart, and J.K. Lynch. 1997. Neuronal nicotinic acetylcholine receptors as targets for drug discovery. J. Med. Chem. 40:4169–4194. [DOI] [PubMed] [Google Scholar]
- Jackson, M.B. 1984. Spontaneous openings of the acetylcholine receptor channel. Proc. Natl. Acad. Sci. USA. 81:3901–3904. [DOI] [PMC free article] [PubMed] [Google Scholar]
- Jackson, M.B. 1994. Single channel currents in the nicotinic acetylcholine receptor: a direct demonstration of allosteric transitions. Trends Biochem. Sci. 19:396–399. [DOI] [PubMed] [Google Scholar]
- Jackson, M.B., B.S. Wong, C.E. Morris, H. Lecar, and C.N. Christian. 1983. Successive openings of the same acetylcholine receptor channel are correlated in open time. Biophys. J. 42:109–114. [DOI] [PMC free article] [PubMed] [Google Scholar]
- Karlin, A. 1967. On the application of “a plausible model” of allosteric proteins to the receptor for acetylcholine. J. Theor. Biol. 16(2):306–320. [DOI] [PubMed] [Google Scholar]
- Kienker, P. 1989. Equivalence of aggregated Markov models of ion-channel gating. Proc. R. Soc. Lond. B. Biol. Sci. 236:269–309. [DOI] [PubMed] [Google Scholar]
- Lee, B.S., R.B. Gunn, and R.R. Kopito. 1991. Functional differences among nonerythroid anion exchangers expressed in a transfected human cell line. J. Biol. Chem. 266:11448–11454. [PubMed] [Google Scholar]
- Levin, E.D., and B.B. Simon. 1998. Nicotinic acetylcholine involvement in cognitive function in animals. Psychopharmacology (Berl.). 138:217–230. [DOI] [PubMed] [Google Scholar]
- Liu, Y., and J.P. Dilger. 1993. Decamethonium is a partial agonist at the nicotinic acetylcholine receptor. Synapse. 13:57–62. [DOI] [PubMed] [Google Scholar]
- Miyazawa, A., Y. Fujiyoshi, and N. Unwin. 2003. Structure and gating mechanism of the acetylcholine receptor pore. Nature. 423:949–955. [DOI] [PubMed] [Google Scholar]
- Monod, J., J. Wyman, and J.-P. Changeux. 1965. On the nature of allosteric transitions: a plausible model. J. Mol. Biol. 12:88–118. [DOI] [PubMed] [Google Scholar]
- Morreale, A., F. Maseras, I. Iriepa, and E. Gálvez. 2002. Ligand-receptor interaction at the neural nicotinic acetylcholine binding site: a theoretical model. J. Mol. Graph. Model. 21:111–118. [DOI] [PubMed] [Google Scholar]
- Oostenbrink, C., and W.F. van Gunsteren. 2005. Free energies of ligand binding for structurally diverse compounds. Proc. Natl. Acad. Sci. USA. 102:6750–6754. [DOI] [PMC free article] [PubMed] [Google Scholar]
- Purohit, Y., and C. Grosman. 2006. Block of muscle nicotinic receptors by choline suggests that the activation and desensitization gates act as distinct molecular entities. J. Gen. Physiol. 127:703–717. [DOI] [PMC free article] [PubMed] [Google Scholar]
- Qin, F. 2004. Restoration of single-channel currents using the segmental k-means method based on hidden Markov modeling. Biophys. J. 86:1488–1501. [DOI] [PMC free article] [PubMed] [Google Scholar]
- Qin, F., and L. Li. 2004. Model-based fitting of single-channel dwell-time distributions. Biophys. J. 87:1657–1671. [DOI] [PMC free article] [PubMed] [Google Scholar]
- Qin, F., A. Auerbach, and F. Sachs. 1996. Estimating single-channel kinetic parameters from idealized patch-clamp data containing missed events. Biophys. J. 70:264–280. [DOI] [PMC free article] [PubMed] [Google Scholar]
- Roux, B., and R. Sauvé. 1985. A general solution to the time interval omission problem applied to single channel analysis. Biophys. J. 48:149–158. [DOI] [PMC free article] [PubMed] [Google Scholar]
- Romanelli, M.N., and F. Gualtieri. 2003. Cholinergic nicotinic receptors: competitive ligands, allosteric modulators, and their potential applications. Med. Res. Rev. 23:393–426. [DOI] [PubMed] [Google Scholar]
- Rothberg, B.S., and K.L. Magleby. 1998. Kinetic structure of large-conductance Ca2+-activated K+ channels suggests that the gating includes transitions through intermediate or secondary states. A mechanism for flickers. J. Gen. Physiol. 111:751–780. [DOI] [PMC free article] [PubMed] [Google Scholar]
- Salamone, F.N., M. Zhou, and A. Auerbach. 1999. A re-examination of adult mouse nicotinic acetylcholine receptor channel activation kinetics. J. Physiol. 516:315–330. [DOI] [PMC free article] [PubMed] [Google Scholar]
- Schwarz, G. 1978. Estimating the dimension of a model. Ann. Stat. 6:461–464. [Google Scholar]
- Sine, S.M. 1993. Molecular dissection of subunit interfaces in the acetylcholine receptor: identification of residues that determine curare selectivity. Proc. Natl. Acad. Sci. USA. 90:9436–9440. [DOI] [PMC free article] [PubMed] [Google Scholar]
- Sine, S.M., T. Claudio, and F.J. Sigworth. 1990. Activation of Torpedo acetylcholine receptors expressed in mouse fibroblasts: single channel current kinetics reveal distinct agonist binding affinities. J. Gen. Physiol. 96:395–437. [DOI] [PMC free article] [PubMed] [Google Scholar]
- Teague, S.J. 2003. Implications of protein flexibility for drug discovery. Nat. Rev. Drug Discov. 2:527–541. [DOI] [PubMed] [Google Scholar]
- Wang, H.-L., A. Auerbach, N. Bren, K. Ohno, A.G. Engel, and S.M. Sine. 1997. Mutation in the M1 domain of the acetylcholine receptor α subunit decreases the rate of agonist dissociation. J. Gen. Physiol. 109:757–766. [DOI] [PMC free article] [PubMed] [Google Scholar]
- Woo, H.-J., and B. Roux. 2005. Calculation of absolute protein-ligand binding free energy from computer simulations. Proc. Natl. Acad. Sci. USA. 102:6825–6830. [DOI] [PMC free article] [PubMed] [Google Scholar]
- Zhang, Y., J. Chen, and A. Auerbach. 1995. Activation of recombinant mouse acetylcholine receptors by acetylcholine, carbamylcholine and tetramethylammonium. J. Physiol. 486:189–206. [DOI] [PMC free article] [PubMed] [Google Scholar]


