

Abstract
Intracellular blockade by quaternary ammonium (QA) molecules of many potassium channels is state dependent, where the requirement for channel opening is evidenced by a time-dependent component of block in the macroscopic record. Whether this is the case for Ca2+- and voltage-activated potassium (BK) channels, however, remains unclear. Previous work (Li, W., and R.W. Aldrich. 2004. J. Gen. Physiol. 124:43–57) tentatively proposed a state-dependent, trapping model, but left open the possibility of state-independent block. Here, we found BK channel blockade by a novel QA derivative, bbTBA, was time dependent, raising the possibility of state-dependent, open channel block. Alternatively, the observed voltage dependence of block could be sufficient to explain time-dependent block. We have used steady-state and kinetic measurements of bbTBA blockade in order to discriminate between these two possibilities. bbTBA did not significantly slow deactivation kinetics at potentials between −200 and −100 mV, suggesting that channels can close unhindered by bound bbTBA. We further find no evidence that bbTBA is trapped inside BK channels after closing. Measurements of steady state fractional block at +40 mV revealed a 1.3-fold change in apparent affinity for a 33-fold change in Po, in striking contrast to the 31-fold change predicted by state-dependent block. Finally, the appearance of a third kinetic component of bbTBA blockade at high concentrations is incompatible with state-dependent block. Our results suggest that access of intracellular bbTBA to the BK channel cavity is not strictly gated by channel opening and closing, and imply that the permeation gate for BK channels may not be intracellular.
INTRODUCTION
The mechanism of ion channel opening and closing is widely thought of in terms of a gate that permits or restricts access to the inner pore via a reversible conformational change. Much attention has been focused on locating the gate of K+ channels, as a first step toward understanding the conformational changes that underlie the gating process. Clay Armstrong's innovative use of intracellular organic blockers that could block K+ channels only when they were open (Armstrong, 1966, 1969, 1971) produced the first strong evidence for an intracellular activation gate. The classic features of state-dependent (open channel) block defined in this work (Armstrong, 1971) include (a) time-dependent block of macroscopic current, where steady-state block reaches equilibrium only after open probability is sufficiently high, (b) a “foot in the door” effect of blocker on channel closing, where internally bound quaternary ammonium (QA) ions of a sufficient size were found to delay closure of the activation gate, and (c) “trapping” of a blocker molecule inside the channel pore after closure of the activation gate. These observations strongly suggested that intracellular blockers required channel opening in order to access (and exit) the pore, and implied that the gating structure regulating access of the blocker to the pore must be located on the intracellular face of the channel. Numerous functional studies of K+ channels (Armstrong and Hille, 1972; MacKinnon and Miller, 1989; MacKinnon and Yellen, 1990; MacKinnon et al., 1990; Yellen et al., 1991; Heginbotham et al., 1992; Liu et al., 1997; Shin et al., 2001) and structural studies of bacterial (Doyle et al., 1998; Jiang et al., 2002a; Jiang et al., 2003; Kuo et al., 2003) and mammalian (Long et al., 2005) K+ channels have confirmed Armstrong's original hypothesis.
The structure of the mammalian voltage-gated K+ channel Kv 1.2 (Long et al., 2005) exemplifies the detailed organization of an archetypal K+ channel pore. The S5 and S6 transmembrane domains from each of four subunits define the central pore, a large water-filled cavity constrained at the extracellular end by the narrow selectivity filter, and at the intracellular end by the “bundle crossing,” where the S6 helices come into close apposition. For the majority of K+ channels, permeation of K+ ions appears to be governed by constriction and enlargement of the S6 aperture. On the other hand, it is clear that some related ion channels employ a different gating mechanism. The case for cyclic nucleotide-gated (CNG) channels is particularly compelling, where Flynn and Zagotta (2001) found that although access of internally applied MTSET to pore residues depends upon the state of the channel, those residues are equally accessible to internal Ag+ (roughly equivalent to a K+ ion in size) in the open or closed state. The authors propose that although the larger MTS reagent is gated by conformational changes of the S6 bundle crossing, permeant ions may be gated at the selectivity filter for CNG channels. Similarly, small-conductance Ca2+-activated K+ (SK) channels (Bruening-Wright et al., 2002), ATP-sensitive inward rectifier K+ (KATP) channels (Proks et al., 2003), and KcsA K+ channels (Cordero-Morales et al., 2006) may also be gated at the selectivity filter.
For BK Ca2+- and voltage-activated K+ channels, the location of the permeation gate remains an open question. Although the structure of a bacterial Ca2+-gated K+ channel (MthK) is known (Jiang et al., 2002a), and functional evidence from BK channels is consistent with motion of the intracellular S6 domains during gating (Niu et al., 2004), the mechanism of BK channel gating is far from fully understood. In some ways, intracellular block of BK channels appears similar to classical open channel block. Most notably, block of BK channels by intracellular Shaker ball peptide is state dependent; the peptide blocks only open channels and must exit before channels can close (unpublished data). Several other observations could also be consistent with an intracellular gate for BK channels: mutations in S6 disrupt activation gating (Piskorowski, 2005), BK channels can close when the selectivity filter is occupied by either Na+ or Ba2+ (Miller et al., 1987; Neyton and Pelleschi, 1991), and high concentrations of external K+ have no obvious slowing effect on deactivation of BK channels (Neyton and Pelleschi, 1991; Demo and Yellen, 1992).
In spite of these observations, however, there is equally compelling evidence suggesting that the BK channel gate may lie elsewhere. First, QA molecules, which have been shown functionally to promote C-type inactivation (a form of selectivity filter gating in Kv channels; Choi et al., 1991) and are proposed to induce constriction of the Kcsa selectivity filter in structural studies (Lenaeus et al., 2005), also speed closing of BK channels (Li and Aldrich, 2004), raising the possibility that BK channels gate at the selectivity filter via a C-type collapse mechanism. Also, permeant thallium favors Kcsa selectivity filter collapse (Zhou and MacKinnon, 2003) and speeds BK channel deactivation (Piskorowski and Aldrich, 2006). Second, although binding of the N-terminal inactivation peptide to the intracellular mouth of the pore of many K+ channels follows predictions of open channel block (Demo and Yellen, 1991), the case for BK channels is far more complex and intriguing. Most importantly, binding and unbinding of the BK inactivation particle (provided by the β subunit) does not require channels to visit the fully conducting open state (Benzinger et al., 2006). Third, no evidence has been obtained thus far for trapping of large intracellular blocker molecules like leupeptin, curare, QX-314, and chlorisondamine (Solaro et al., 1997). Fourth, external Rb+ has been shown to destabilize the closed state, presumably due to occupancy of the selectivity filter (slowing deactivation and speeding channel opening; Demo and Yellen, 1992). Finally, a novel conotoxin, K-BtX, appears to stabilize the open state of BK channels from the external side (Fan et al., 2003). It is thus not unreasonable to consider the possibility that BK channels are gated at the selectivity filter, particularly in light of the fact that three other channels activated by intracellular ligands, the CNG, KATP, and SK channels, appear to use selectivity filter gates (Flynn and Zagotta, 2001; Bruening-Wright et al., 2002; Proks et al., 2003).
The classic QA blocker experiments that have worked so well for other K+ channels have been less informative for BK channels because of the relatively large size of the BK channel intracellular cavity. In order for a time-dependent component of block to be visible, the kinetics of block must be slow with respect to the intrinsic rate of channel opening, and the kinetics of block by even the largest molecule tested thus far, decyltriethylammonium (C10), have been too fast to resolve (Li and Aldrich, 2004). We sought to find a QA blocker with sufficiently slow kinetics to allow resolution of time-dependent block and to discern whether intracellular block of BK channels requires channel opening. Here we provide evidence that the QA ion bbTBA (N-(4-[benzoyl]benyl)-N,N,N-tributylammonium bromide) can block both closed and open channels. We conclude that access of bbTBA to the BK channel pore does not appear to be strictly regulated by an intracellular gating structure, and speculate that permeant K+ ions may be gated in the selectivity filter itself.
MATERIALS AND METHODS
Channel Expression
All experiments were conducted using the mSlo gene encoding the mouse BK channel (Butler et al., 1993). Freshly isolated Xenopus oocytes were injected with ∼5 ng or ∼0.05 ng cRNA for macroscopic or microscopic experiments, respectively. Patch clamp recordings were made 1–4 d after injection.
Electrophysiology
All recordings were made from oocyte macropatches using the inside-out patch configuration (Hamill et al., 1981). Pipettes were pulled from borosilicate glass (VWR Scientific) to yield resistances of 1–3 MΔ, and coated with sticky wax (Kerr Corporation). All experiments were performed at 22°C. Data were acquired with an Axopatch 1B or Axopatch 200A amplifier (Axon Instruments, Inc.), low pass filtered at 10 kHz, and digitized using an ITC-16 converter (Instrutech). Sampling interval was set at 10 or 20 μs using Pulse software (HEKA Electronik) and a Macintosh G3 computer. Data were leak subtracted using a −P/4 protocol stepping from leak holding potential of −120 mV. Macroscopic ionic currents were usually averaged from three or more consecutive sweeps. Idealization of microscopic recordings was accomplished using the TAC software suite (Bruxton Corporation); all further analysis of macrosopic and microscopic data was performed with Igor (WaveMetrics, Inc.).
Analysis and Curve Fitting
Dose–response data were fitted with the Hill equation:
 |
(1) |
where IbbTBA and Icontrol = current with and without bbTBA, respectively, Kd = apparent dissociation constant for bbTBA, and n = Hill coefficient. The voltage dependence of kOFF, kON, or Kd was determined by fitting with the Woodhull equation (Woodhull, 1973):
 |
(2) |
where V = test potential, k(0) = the rate at 0 mV, z = valence of bbTBA (+1), and δ = effective electrical distance; together, zδ roughly approximates the voltage dependence of blockade. Voltage dependence of block was also measured by fitting fractional unblock as a function of voltage with a Woodhull equation of the form
 |
(3) |
Conductance–voltage relationships were calculated from isochronal tail current measurements at −80 mV after variable test steps, and normalized to maximal tail current amplitude. This procedure avoids complications induced by fast Ca2+ block of steady-state currents, and thus accurately reflects relative macroscopic open probability (Po) as a function of voltage (Cox, Cui and Aldrich, 1997). The data were fitted with a Boltzman function:
 |
(4) |
where G = conductance, V1/2 = potential for half-maximal activation, and z = apparent equivalent gating charge. Current traces depicted in the figures were zero subtracted for display purposes. In general, the SEM is given with averaged values, while the 95% confidence interval is provided for fitted parameters.
Predictions of Percent Block (Fig. 3 C)
Figure 3.

bbTBA behaves as a traditional pore blocker. (A) Ionic currents were sampled for 30 ms at +120 mV (from a holding potential of −80 mV) five times in each condition (100 μM internal Ca2+ or in the presence of 5 μM bbTBA, 1 mM TBA, or both blockers together) in the order shown in the time course. (B) Each set of five sweeps was averaged to yield the average traces for this experiment in the absence and presence of the indicated blocker solutions. Percent block in each case was then calculated from these average sweeps (for this experiment: bbTBA, 51%; TBA, 65%; both, 72%). Smooth lines represent modeling of ionic current under each condition. For modeling, channel opening (α = 2254 s−1) and closing (β = 46 s−1) rates were determined from a single exponential fit to the control data and assuming Po ∼ 0.98, using 1/τ = α + β and Po = α/(α + β). Kinetics of TBA block were estimated from Li and Aldrich (2004): Kd(0 mV) = 1 mM and zδ = 0.2. bbTBA block was modeled using parameters for the final model (Kd(0) = 9.9 μM and zδ = 0.15). Currents in individual blockers were modeled with Scheme 3. Block by bbTBA + TBA was modeled using either a noncompetitive (Scheme 4, dashed line) or competitive (Scheme 5, solid line) model. Time dependence was drastically slowed in both cases, but the observed steady-state level of block is compatible only with a competitive model of block. (C) The average (±SEM) percent block observed in three patches for bbTBA alone (46%), TBA alone (62%), or both blockers together (71%) follows exactly the predictions of a competitive model of blockade (71%). A noncompetitive model predicts both blockers will block 80% of total current. Predictions of percent block were calculated as described in Materials and methods. The ability of bbTBA to compete for the binding site of a known pore blocker of BK channels strongly suggests that the bbTBA binding site is located in the pore cavity.
Competitive Block.
The apparent Kds (Kapp) for bbTBA or tetrabutylammonium (TBA) were estimated from the average fractional block (F) observed for each blocker alone using FQA = [QA]/[QA] + Kapp QA. This yielded Kapp bbTBA = 5.9 μM and Kapp TBA = 0.628 mM. The Kapp bbTBA in the presence of TBA was then calculated: Kapp bbTBA/TBA = Kapp bbTBA(1 + [TBA]/Kapp TBA = 15.3 μM; the fraction of current blocked by bbTBA in the presence of TBA is thus FbbTBA/TBA = [bbTBA]/[bbTBA]+Kapp bbTBA/TBA = 0.25. Similarly, the Kapp TBA/bbTBA = 1.16 mM, and the FTBA/bbTBA = 0.46. Together, both blockers block 0.25 + 0.46 = 71% of total current.
Noncompetitive Block.
Percent block was calculated by summing the fraction of current blocked by TBA, FTBA = 0.62, and the fraction of current remaining in the presence of TBA that is blocked by bbTBA, FbbTBA/TBA = (1 − FTBA)FbbTBA = 0.18, yielding 80% block.
Final Model for bbTBA Blockade
A final model for state-independent blockade of BK channels by bbTBA was constructed (Scheme 1), which accurately reproduced steady-state and kinetic features of block (see Figs. 1, 3, 5, 8, 10, and 11).
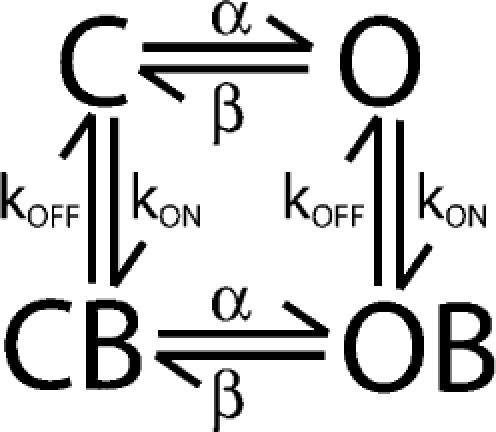 |
(SCHEME 1) |
Figure 1.

Macroscopic bbTBA blockade is dose and voltage dependent. (A) Representative family of steps from a holding potential of −80 mV to +140 mV (100 μM internal Ca2+) in the absence and presence of the indicated concentrations of bbTBA. Traces shown are averages of three consecutive sweeps. (B) Macroscopic fractional block (1 − IbbTBA/Icontrol) was measured from ionic currents, averaged across patches at six different voltages (+40 to +140 mV), and plotted against bbTBA concentration. Smooth curves are Hill fits to the average data (mean ± SEM; n = 6 patches). The structure of bbTBA is indicated in the inset; bbTBA carries a charge of +1. (C) Macroscopic Kds from Hill fits were plotted as a function of test voltage; error bars represent the standard deviation of the Hill fits in B. Parameters (±95% confidence interval) of bbTBA blockade derived from fitting of the data to Eq. 2 were (dashed line) Kd(0 mV) = 9.53 ± 3.32 μM, zδ = 0.148 ± 0.024.
Figure 5.

Average microscopic parameters of bbTBA blockade. (A) Average second order on rates calculated from kinetic measurements at each voltage as in Fig. 4 were fitted to Eq. 2 either by Igor (dashed line) to yield (parameters ± 95% confidence interval) kON(0) = 1.108 ± 0.3 × 10⁸ M−1s−1 and zδON = 0.012 ± 0.093, or with the final model (solid line) with parameters: kON(0) = 1.0 × 10⁸ M−1s−1 and zδON = 0.05. Data were averaged from six patches; error bars represent the standard deviation of fits of kON vs. [bbTBA] as in Fig. 4 C. (B) Average off rates (±SEM; n = 6 patches) were plotted as a function of voltage and fitted to Eq. 2 (dashed line), yielding parameters (±95% confidence interval) kOFF(0) = 562 ± 27 s−1 and zδOFF = 0.07 ± 0.015. (C) Average microscopic Kd measured from steady-state open probability (filled squares) or kinetics (open squares) were plotted as a function of voltage and fitted with Eq. 2 either by Igor (dashed lines) with parameters (±95% confidence interval): steady-state, Kd = 4.8 ± 1.1 μM and zδ = 0.14 ± 0.08; kinetic, Kd = 5.5 ± 1.1 μM and zδ = 0.11 ± 0.07, or the final model (solid lines) with parameters: steady-state, Kd = 5 μM and zδ = 0.15; kinetic, Kd = 6 μM and zδ = 0.15. (In this particular instance, the Kd in the final model was not constrained to the 8–10 μM range, in order to account for microscopic measurements made earlier in time; see Materials and methods). Error bars represent the standard deviation from fits of the Po vs. [bbTBA] curves as in Fig. 4 D. The Kd for the kinetic measurements was taken to be the intersection where kON = kOFF. Data were averaged from six or four patches for kinetic and steady-state measurements, respectively.
Figure 8.

Efficacy of macroscopic bbTBA blockade appears largely independent of open probability. (A) Representative BK currents measured from a single patch at +90 mV from a holding potential of −80 mV, ±5 μM bbTBA in either 100 μM internal Ca2+ (Po ∼ 1) or 1 μM internal Ca2+ (Po ∼ 0.25); fractional block computed from the steady-state currents was 50.1% or 44.7%, respectively. (B) Relative Po was estimated from normalized conductance voltage relationships obtained in the absence (filled symbols) and presence (open symbols) of 5 μM bbTBA, for both 1 μM internal Ca2+ (circles) or 100 μM internal Ca2+ (triangles) solutions. Relative conductance was calculated from tail current amplitudes measured at −80 mV, and then normalized and plotted as a function of test potential. Resulting Po-V curves were fit with a Boltzmann equation (Eq. 4) to yield parameters (±95% confidence interval): 100 μM Ca2+ (control/ +bbTBA), V1/2 = −40 ± 1.5 mV/−42 ± 2.0 mV and z = 1.7 ± 0.15/2.1 ± 0.32; 1 μM Ca2+ (control/+bbTBA), V1/2 = +113 ± 1.2 mV/+107 ± 2.6 mV, z = 1.5 ± 0.9/1.4 ± 0.18. Fractional unblock (IbbTBA/Icontrol) was computed from steady-state currents ± 5 μM bbTBA exposed to 1 μM internal Ca2+ (circles) or 100 μM internal Ca2+ (triangles), plotted as a function of voltage and fitted with Eq. 3, yielding the parameters (±95% confidence interval): 100 μM Ca2+, Kd(0) = 8.9 ± 0.6 μM and zδ = 0.13 ± 0.03; 1 μM Ca2+, Kd(0) = 9.1 ± 3.6 μM and zδ = 0.09 ± 0.08. Measurements in A and B were all made in the same patch. (C) Relative Po and fractional unblock (Iblock/Icontrol) were measured over a range of test potentials from each of 24 patches in solutions ranging from 0 to 100 μM Ca2+, and measurements of fractional unblock at each voltage were binned into Po categories of “low” (0 < Po < 0.2; crosses), “medium” (0.4 < Po < 0.6; circles), and “high” (0.8 < Po < 1.0; triangles). Within each Po category, fractional unblock was averaged at each test potential, plotted ± SEM as a function of voltage, and fitted with Eq. 3 (dashed lines) to yield parameters (±95% confidence intervals): low Po, Kd(0) = 10.1 ± 5.6 μM and zδ = 0.17 ± 0.13; medium Po, Kd(0) = 8.1 ± 2.8 μM and zδ = 0.16 ± 0.09; high Po, Kd(0) = 8.3 ± 1.2 μM and zδ = 0.14 ± 0.03. A fit to the final model of bbTBA block (Kd(0) = 8.9 μM and zδ = 0.15) is also illustrated with a solid line. (D) The same fractional unblock data were then binned into three separate test voltages: +60 mV (circles), +100 mV (triangles), and +150 mV (bowties), and each data point plotted individually versus relative Po estimated from the Po -V curve for that patch. Data points within each voltage category were then fitted with a linear equation. Macroscopic fractional unblock does not depend strongly upon open probability, although block may be slightly less effective at low Po.
Figure 10.

bbTBA blockade of BK channels closely matches predictions of a state-independent model of block. Experiments of type illustrated in Fig. 9 were repeated in 12 patches, and fractional block at +40 mV was plotted versus Po calculated directly from the raw amplitude histograms. Data from each experiment are indicated by a separate filled symbol. Open symbols represent measurements of block at two different Ca2+ concentrations with no washout to confirm stable Po. Crosses represent measurements of block made at only one Ca2+ concentration (stable Po confirmed with washout in two of three cases). Dashed lines represent predictions of fractional block as a function of Po made using parameters from our kinetic measurements of block at +40 mV in 100 μM internal Ca2+ (kON = 1.108 M−1s−1, kOFF = 498 s−1; Fig. 5, A and B) and Schemes 1 (final state independent) and 2 (state dependent). The solid line is a best fit of the data to the linear equation: Fractional Block = (0.073*Po) + 0.45. The 1.3-fold change in apparent affinity of block over a range of Po spanning nearly two orders of magnitude is not compatible with state-dependent block.
Figure 11.

Blockade at high concentrations of bbTBA has three kinetic components. (A) Ionic currents (average of 10 sweeps) in the presence of 75 μM bbTBA at +90 or +150 mV. Holding potential was −80 mV. Triphasic block kinetics become more obvious at higher potentials; current rises during the first phase, then falls during the second phase, and finally rises again to steady-state levels during the third phase. (B) The current trace at +90 mV (+75 μM bbTBA) is shown on an expanded time scale. Smooth lines represent model predictions. The final state-independent model of bbTBA blockade (illustrated in C) was able to reproduce general kinetic and steady-state features of block (black dashed line). Model parameters were α = 2330 s−1 and β = 24 s−1 for channel opening and closing, respectively (using single exponential fits to activation of control current at +90 mV and Po = 0.99, 1/τ = α + β and Po = α/(α + β)), Kd(0) = 9 μM, zδ = 0.15, and 50% channels initially in CB. Minor adjustment of these model parameters (Kd(0) = 11 μM, zδ = 0.15, 35% channels initially in CB) and adding the assumption that bbTBA slows activation (from 2,330 to 1,500 s−1) produced a better fit (solid red line). This adjusted state-independent model fits only when some fraction of channels are blocked at rest (compare with dashed red line where 100% channels start in C). Using the same adjusted parameters (Kd(0) = 11 μM, zδ = 0.15, 35% CB, α = 1500 s−1, β = 24 s−1), the state-dependent model (e.g., Scheme 2) is clearly incompatible with the observed kinetics of block (solid blue line). Importantly, the state-dependent model was never able to reproduce triphasic block kinetics, even with extensive alteration of parameters (including starting up to 100% of channels in the blocked state). (C) Occupancy of the closed (C, blue), open (O, red), open blocked (OB, black), and closed blocked (CB, green) states over time illustrates the origin of triphasic block kinetics. Initial conditions for this occupancy plot modeling block by 75 μM bbTBA at +90 mV were 50% C + 50% CB; the same rate constants that were used for modeling the solid red line in B were used, as illustrated in the inset. Triphasic time-dependent block is a direct result of rapid population of blocked states prior to equilibration of the open state, in direct contrast to state-dependent models that require that the slow C to O transition be rate limiting for block. The triphasic kinetics of block observed at high concentrations of bbTBA strongly suggest that blockade is not state dependent.
This model, based on the simulation protocol developed by Horrigan et al. (1999), consisted of four connected states, with parameters taken from our average macroscopic and microscopic data (see Table I). The final zδ value of 0.15 was calculated from the average values of zδ derived from six different measurements, and closely matches that observed for C10 and TBA (∼0.16 and ∼0.21; Li and Aldrich 2004). Kd(0 mV) was allowed to vary somewhat (8–10 μM) in order to compensate for the observed shift in Kd over time and variability in individual patches. Because microscopic measurements were made earlier in time, the average on and off rates are biased toward the lower Kd(0) observed at that time (∼5 μM; Table I). Assuming that the decline in apparent affinity of bbTBA over time is the result of a degradative process, we expect that the increased Kd reflects a decrease in kON, with relatively little change in kOFF. Thus, in order for our final model to accommodate measurements made later in time, we constrained the model to the macroscopic steady-state parameters Kd(0) = 8–10 μM and zδ = 0.15, and also required that kOFF (0) = 562 s−1, while kON(0) was scaled to match the Kd (kON = 0.625 × 10⁸ M−1s−1). Microscopic measurements of the voltage dependence of kON(0.05) and kOFF(0.7) were assumed to be accurate, and kOFF was adjusted slightly (to 0.1) to yield zδtotal = 0.15. Note that without these adjustments, the kinetic features of block, including the triphasic time dependence observed at high concentrations, were still reproducible. Our final model makes two assumptions: (1) bbTBA binding does not alter the intrinsic rates of channel activation and deactivation (e.g., the same values for α and β were used for the closed/open transition for both unblocked and blocked channels), and (2) intrinsic affinity of bbTBA for the open and closed states is equal (which our data suggest is not entirely accurate; see Figs. 8–10 ).
TABLE I.
Parameters of bbTBA Blockade
| Macroscopic | Microscopic | ||||
|---|---|---|---|---|---|
| Kd vs. V | Frac. block | Kinetics | Steady state | FINAL MODEL | |
| (Fig. 1 C) | (Fig. 8 C) | (Fig. 5) | (Fig. 5 C) | ||
| Kd(0 mV) μM | 9.5 | 8.3, 8.1, 10.1a | 5.5 | 4.8 | 8–10 |
| zδ total | 0.15 | 0.13, 0.16, 0.17a | 0.11 | 0.14 | 0.15 |
| kON(0 mV) M−1 s−1 |
1 × 10⁸ | 0.625 × 10⁸ | |||
| zδON | 0.05 | 0.05 | |||
| kOFF(0 mV) s−1 |
562 | 562 | |||
| zδOFF | 0.07 | 0.1 | |||
The dissociation constant (Kd) reflects the concentration of bbTBA required for half-maximal blockade. The charge carried by bbTBA (z = +1) multiplied by the total electrical distance δ together give zδtotal, an estimate of the total voltage dependence of block. The second order association rate for block at 0 mV (kON (0 mV)) and the charge associated with blocker binding zδON, as well as the rate and voltage dependence of blocker dissociation (kOFF (0 mV) and zδOFF), were calculated from microscopic kinetic measurements as described in Figs. 4 and 5. Macroscopic Kd and zδ were obtained from fitting Kd values (obtained from Hill fits) plotted as a function of voltage (Fig. 1 C) with Eq. 2, or fitting fractional unblock plotted as a function of voltage (Fig. 8 C) to Eq. 3. Microscopic Kd and zδ were measured from fits to Eq. 2 of Kd vs. voltage relationships (Fig. 5 C), where Kd was obtained from either kinetic measurements (Fig. 4 C) or steady state Po (Fig. 4 D). Blocker rates and associated zδ values were obtained from fitting plots of either the on or off rates from dwell time histograms vs. voltage (Fig. 5, A and B) with Eq. 2. A final model was constructed that describes all measurements in this study; this model was used in modeling block (Figs. 1, 3, 5, 8, 10, and 11; see Materials and methods).
Values given are for low, medium, and high Po data sets, respectively.
Figure 9.

Microscopic steady-state block decreases slightly at low Po. (A) A typical experiment where block was evaluated at several different Ca2+ concentrations is illustrated. Each experiment consisted of several “trials,” where block was measured at a particular Ca2+ concentration, beginning with the lowest value (2 μM). Within each trial, a control solution (open circles) was alternated with the corresponding blocker solution (+5 μM bbTBA, filled circles) several times while channel activity was monitored with 10-s sweeps to +40 mV. Po was calculated from each individual sweep by integrating Gaussian fits to raw amplitude histograms (Po = Po/Po + Pc). The illustrated time course allowed us to directly monitor Po during the course of an experiment. Trials consisting of acceptably stable sweeps were identified using the following selection criteria. For Po ≤ 0.15, each control record was required to be ±0.01 Po units of the preceeding control. For Po > 0.15, control Po values that were within 0.1Po unit were accepted (e.g., ±0.05). Thus, for any particular Ca2+ concentration, episodes of block were only accepted when sandwiched by stable control activity. After identifying stable records, raw amplitude histograms were constructed from all acceptable control records and blocker records within a trial (10–40 s total for each) and fitted with Gaussian functions in order to yield the average Po values. Fractional block at that Ca2+ concentration was calculated as 1 − Po bbTBA/Po control. Fractional block for a few experiments was also computed from bursts of activity ± bbTBA, such as those illustrated in B and D on an expanded time scale; percent block from these analyses was within 5% of that calculated from the complete dataset. Long closures were occasionally omitted from records. (B) Representative sweeps illustrating block at low Po (sweeps number 1 and 2 in A). The top row illustrates 4 s of recording in 2 μM internal Ca2+ (sweep 1) and 2 μM Ca2+ + 5 μM bbTBA (sweep 2). Average Po under these conditions for this experiment was 0.09 or 0.05, respectively. 100-ms sections (indicated by brackets) are shown on an expanded time scale below each trace. All sweeps in this figure were filtered at 2 kHz for illustration purposes. (C) Fractional block was calculated from the average raw amplitude histograms for the control (solid line) and 5 μM bbTBA (dashed line) data. For this experiment, at Po = 0.09, fractional block was 44.5%. (D) Block at high Po is illustrated by 500 ms of recording in 100 μM internal Ca2+ (sweep 3) or 100 μM Ca2+ + 5 μM bbTBA (sweep 4), where Po was 0.89 or 0.44, respectively. 100-ms sections (indicated by brackets) are shown below each trace on the same expanded time scale as in B in order to facilitate comparison with the traces in 2 μM Ca2+. (E) Fractional block computed from the raw amplitude histograms for this experiment at Po = 0.9 was 51.2%. The efficacy of microscopic block appears to decrease by ∼6% at low Po.
Solutions
The pipette (external) solution contained (in mM) 140 KMeSO3, 20 HEPES, 2 KCl, and 2 Mg2+ (pH 7.2). The bath (internal) solution contained (in mM) 136 KMeSO3, 20 HEPES, 6 KCl, CaCl2, and HEDTA. The amount of Ca2+ and HEDTA added to the internal solution was varied by estimating the amount of CaCl2 and buffer required to yield a given final Ca2+ concentration with MAX CHELATOR software (Bers, 1982). Thus, solutions of 0–4 μM free Ca2+ were buffered with 2 mM HEDTA, and those containing 10–20 μM free Ca2+ contained 1 mM HEDTA, while 100 μM free Ca2+ solutions were not buffered. To minimize voltage-dependent block by contaminant barium, (+) −18-crown-6-tetracarbolxylic acid (18C6TA) was added to the internal solution just before recording at a final concentration of 40 μM (Cox et al., 1997). Both 18C6TA and bbTBA were prepared as millimolar stocks in internal solution and stored at −20°C before diluting into fresh solutions immediately before beginning experiments. Each patch was constantly bathed with internal solution using a sewer pipe system (DAD-12; Adams and List Assoc., Ltd.), which achieves solution changes in <1 s.
N-(4-[benzoyl]benyl)-N,N,N-tributylammonium bromide (bbTBA) was acquired from Spectra Group Limited, Inc. All experiments were performed using dilutions of an initial 50 mM stock prepared from newly obtained salt, which was stored frozen in small aliquots at −20°C. We did notice a slow decline in efficacy of block over a period of ∼9 mo. This apparent degradation of bbTBA was independent of storage in solution (50 mM stocks frozen at −20°C) or as a salt, based on comparison of Kd at +100 mV of (a) the original stock solution, 3.2 μM, (b) the same stock solution 9 mo later, 4.4 μM, and (c) a freshly made solution prepared from 9-mo-old salt, 4.4 μM. The latter measurements (b and c) were made from Hill fits of dose–response data obtained from single patches, n = 3 patches. The absorption spectra (measured after 9 mo) for the latter two solutions were also comparable (Amax = 0.20 or 0.18, respectively); no measurement had been made for the original stock solution 9 mo prior. This slow decline in efficacy of block adds some variability to our averages, but will otherwise not affect the conclusions of this work, as the fractional block experiments were all performed in an ∼3-mo period, and all comparisons were made to control experiments performed concurrently. Tetrabutylammonium (TBA) was purchased from Alfa Aesar. All other chemicals were purchased from Sigma-Aldrich.
RESULTS
Macroscopic bbTBA Blockade of BK Channels Is Time Dependent
To characterize blockade of BK channels by bbTBA, we first performed dose–response experiments, where macroscopic K+ currents were elicited from inside-out macropatches using a series of voltage steps in the absence and presence of varying concentrations of bbTBA (Fig. 1). Fig. 1 A illustrates blockade of BK currents measured at +140 mV. bbTBA block was dose dependent and fully reversible (see Figs. 3 and 9). In Fig. 1 B, average fractional block, calculated from steady-state ionic currents in the presence and absence of bbTBA, was plotted as a function of bbTBA concentration for each of six test voltages in order to determine the dosage for half-maximal block (Kd). Hill fits of these data yielded Kd values in the low micromolar range, with Hill coefficients near 1. The resulting Kd values were then plotted as a function of test voltage, for voltages ≥+40 mV (Fig. 1 C), where open probability (Po) in 100 μM Ca2+ is expected to saturate. As expected for a charged molecule (see structure in Fig. 1 B), block was modestly voltage dependent, with a Kd at 0 mV of 9.5 μM, and a total voltage dependence zδ of 0.15, similar to other QA blockers in BK channels (Li and Aldrich, 2004). The lesser degree of voltage dependence compared with QA block of Kv channels (zδ ∼ 0.4) may reflect the larger diameter, and presumed lower resistance, of the vestibule in BK channels. Fig. 1 demonstrates that bbTBA behaves as a typical QA blocker, where dose-dependent blockade results from binding of bbTBA to a single voltage-dependent binding site.
A fast time-dependent component of blockade was visible under certain recording conditions where activation is sufficiently fast to allow resolution of block kinetics (see Fig. 1 A). This component of block is examined in more detail in Fig. 2. Representative current families elicited by test potentials ranging from +20 to +120 mV in the absence (Fig. 2 A) and presence (Fig. 2 B) of 5 μM bbTBA illustrate the voltage range over which the time-dependent component is visible in 100 μM Ca2+ internal solution. Because BK channel activation is slowed in the absence of Ca2+ (Cox et al., 1997), the lowest concentration of Ca2+ for which time-dependent block was reliably observed (at extreme positive test potentials) was ∼4 μM Ca2+ (see Fig. 7). Fig. 2 C shows, on a faster time scale, time-dependent block at bbTBA concentrations ranging from 1 to 20 μM at +180 mV in 100 μM Ca2+ solutions. Note that the time constant of the current relaxation is well fitted by a single exponential function (dashed lines) and is linearly related to bbTBA concentration in this range (Pearson's R = 0.998; unpublished data), consistent with a bimolecular blocking reaction.
Figure 2.

bbTBA blockade is time dependent. (A) Representative current families (averages of three consecutive sweeps) measured in 100 μM internal Ca2+ in the absence and (B) presence of 5 μM bbTBA. Test voltages ranged from +20 to +120 mV (in increments of 20 mV). Holding potential was −80 mV. In saturating Ca2+, the time-dependent component of block first becomes obvious at ∼+80 mV. (C) Average currents at +180 mV in the absence and presence of the indicated concentrations of bbTBA, on an expanded time scale. The time-dependent component of blockade is visible at bbTBA concentrations between ∼1 and 100 μM. The time constants of current relaxation in the presence of bbTBA measured from single exponential fits (dashed lines) were 3.71 ms (1 μM), 1.43 ms (5 μM), and 526 μs (20 μM). Note that the time constant of current relaxation decreases in rough proportion to the concentration of blocker applied, consistent with expectations of a two-state blocking reaction.
Figure 7.

BK channels show no evidence of trapping bbTBA inside the cavity after closure. (A) To test for trapping, channels were stepped from a holding potential of −200 mV to a test potential of +150 mV three times, separated by a 5-ms interpulse interval at −200 mV, first in a control solution containing 20 μM internal Ca2+ (black traces), and then in 5 μM bbTBA (gray traces). Traces were then superimposed (one control sweep, average of three sweeps in blocker) for comparison. (B) The trapping experiment was repeated in 4 μM internal Ca2+, where open probability at −200 mV was roughly an order of magnitude lower (∼0.00001; Horrigan and Aldrich, 2002), in order to minimize the possibility of escape of blocker from channels reopening during the 5-ms repolarization to −200 mV. In this experiment, the test potential was +200 mV, and the traces shown are averages of three (control) or four (bbTBA) sweeps. This experiment in 4 μM Ca2+ was repeated in eight different patches. (C) Fractional unblock (1 − IbbTBA/Icontrol) was measured in 100 μM internal Ca2+ either from steady-state currents (black triangles; n = 19 patches ± SEM) or peak tail currents (gray squares; n = 4 patches ± SEM) and plotted as a function of test voltage. The steady-state data are the high Po measurements displayed in Fig. 8 C. Steady-state data were fit with Eq. 3 either by Igor (dashed line; parameters ± 95% confidence interval were Kd(0) = 8.3 ± 1.2 μM and zδ = 0.14 ± 0.03) or by our final model (thick black line, Kd(0) = 8.5 μM and zδ = 0.15). The final model fit was then extrapolated to negative potentials. Fractional unblock computed from tail currents was also fitted (thin gray line) with parameters (±95% confidence interval): Kd(0) = 2.9 ± 1.8 μM and zδ = 0.12 ± 0.016. The observed level of block at negative potentials is much greater than steady-state predictions, indicating that bbTBA has not dissociated from channels at the time of closing. The persistence of time-dependent block after closure and reopening of blocked channels suggests that bbTBA is able to dissociate from closed channels during the 5-ms repolarization.
Time-dependent blockade by QA ions often signifies open channel block (Scheme 2); however, it is important to note that the implication is not limited to this possibility.
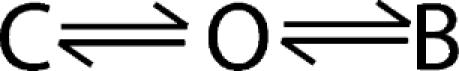 |
(SCHEME 2) |
The approximately twofold change in fractional block (estimated from the peak and steady-state levels of current in bbTBA) during the time-dependent component is well within the range that could be explained by voltage-dependent, state-independent block (Scheme 3) alone (assuming zδ ∼ 0.15, which predicts an approximately threefold change in block for the 260-mV step shown in Fig. 2 C), without a need to invoke state-dependent block.
 |
(SCHEME 3) |
The bbTBA Binding Site Is Located in the Pore
Before using bbTBA to evaluate accessibility of the pore region of the BK channel, it is important to confirm that the bbTBA binding site is located at the pore. We expect that bbTBA is a pore blocker since block is voltage dependent and bbTBA is structurally analogous to organic cations such as TBA, for which evidence of pore block is strong. To provide direct evidence of pore block, we evaluated the ability of the known pore blocker TBA to compete with bbTBA for binding to the BK channel. The experiment was conducted as depicted in Fig. 3 A####; ionic currents at +120 mV were measured from channels before, during, and after exposure to 5 μM bbTBA, 1 mM TBA, or a solution containing both blockers (5 μM bbTBA + 1 mM TBA). Traces averaged from five consecutive steps (Fig. 3 B) were then used to calculate the percent block observed in each blocker solution. The average percent block from three patches is shown in Fig. 3 C. If both blockers can bind and block channels simultaneously (noncompetitive block; Scheme 4), we expect the degree of block by bbTBA + TBA to be 80%; however, we observe that block is weaker (71%), exactly what one can predict from a model of competitive block (Scheme 5) where bbTBA and TBA compete for a single binding site.
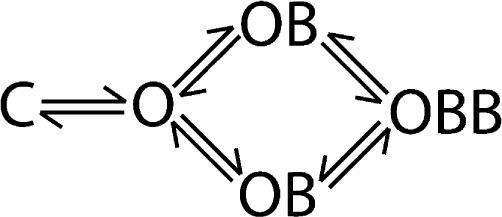 |
(SCHEME 4) |
The data in Fig. 3 B were compared with the predictions of our final model (described in Materials and methods and Table I) to assess its adequacy in describing steady-state and kinetic properties of bbTBA blockade, and to illustrate the predictions made in Fig. 3 C. Blockade of ionic current by bbTBA was well described by our final model, as were currents in TBA (using estimates of block kinetics from Li and Aldrich [2004]; solid lines). The degree of blockade observed in the presence of both blockers matched predictions of the competitive model (Scheme 5, solid line), but was not compatible with noncompetitive block (Scheme 4, dashed line). Note that the virtual absence of time dependence can be accounted for by both models. These data, along with the bimolecular kinetics and voltage dependence, provide good evidence that bbTBA is a pore blocker, as expected.
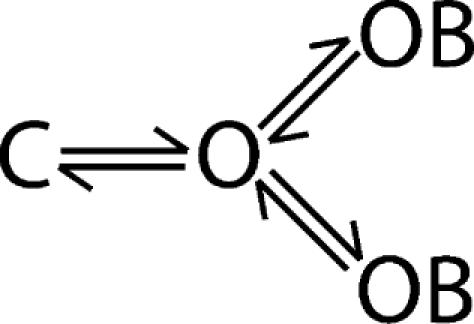 |
(SCHEME 5) |
Microscopic Blockade
To evaluate more carefully the kinetics and voltage dependence of bbTBA blockade, we performed microscopic experiments (Fig. 4). Fig. 4 A illustrates representative single channel records from inside-out patches at +100 mV in 100 μM Ca2+ internal solution, in the absence and presence of either 1 or 3 μM bbTBA. While the BK channel activity is characterized by high open probability (Po) and short flickery closings, Po decreases and open times become progressively shorter as the concentration of bbTBA is increased. Dwell time histograms constructed from idealized records were fitted with single exponential functions in order to yield the mean open and shut dwell times (Fig. 4 B). Block rates calculated from these mean dwell times were then plotted as a function of bbTBA concentration in order to yield the second order kON at +100 mV, the average kOFF, and the resultant Kd (Fig. 4 C). As an alternative to the kinetic measurements, we also determined the microscopic Kd using steady-state measurements of open probability in various bbTBA concentrations (Fig. 4 D). The results from Hill fits to normalized Po plotted as a function of bbTBA concentration were roughly similar to those of the kinetic measurements in Fig. 4 C.
Figure 4.

Kinetic and steady-state measurements of microscopic block at +100 mV are consistent with a bimolecular blocking reaction. (A) Representative single channel recordings (200 ms) measured at +100 mV in 100 μM internal Ca2+ in the absence or presence of the indicated concentration of bbTBA. The effective filtering frequency used for display purposes only was 1.96 kHz (for analysis of dwell times, records were sampled at 100 kHz and filtered at 10 kHz). Openings are upward. (B) Shut (left) or open (right) dwell time histograms were prepared from idealized records of control (top), 1 μM bbTBA (middle), or 3 μM bbTBA (bottom) data. Records were idealized with half amplitude threshold analysis using TAC software. Each histogram was constructed from 30–70 s of data, containing 1722–5081 events. Dwell times shorter than twice the filter dead time 2Td (76 μs) were excluded. Histogram data (gray) plotted as square root of counts vs. log of dwell times were fitted with single exponential functions (solid lines) in order to determine mean dwell times for each condition. (C) Average rates of block at +100 mV were calculated from the dwell time histograms and plotted as a function of bbTBA concentration. The off rate (kOFF, triangles) at each concentration of bbTBA was taken to be the reciprocal of the mean shut dwell time in blocker, assuming that excursions to the open level in the record largely reflect unblocking events. The first order on rate (kON, squares) was calculated at each concentration by subtracting the native closing rate, 1/β (the reciprocal of the control mean open time), from the reciprocal of the mean open time in bbTBA to prevent contamination of the calculated on rate by the intrinsic rate of channel closing. Data from three patches at +100 mV were averaged (±SEM) and fitted with linear equations to yield the second order association rate (±95% confidence interval) kON = 1.16 × 10⁸ ± 0.258 × 10⁸ M−1s−1. The dissociation rate (average of all values ± SEM) was kOFF = 435 ± 28 s−1, and the Kd (the intersection where kON = kOFF) was Kd = 3.9 μM. (D) Microscopic Kd was also obtained from steady-state measurements of open probability in various blocker concentrations. Open probabilities calculated from raw amplitude histograms were normalized, averaged, and plotted as a function of bbTBA concentration (n = 4 patches, ±SEM). The average data were fitted with the Hill equation, which yielded parameters (±95% confidence interval) Kd at +100 mV = 2.9 ± 5.5 μM and Hill coefficient of 1.0 ± 2.5. The linear increase in kON as a function of bbTBA concentration and the independence of kOFF are consistent with a bimolecular blocking reaction where a single bbTBA molecule binds at a single site.
The measurements illustrated in Fig. 4 were performed over a range of test potentials in order to yield the average microscopic block parameters shown in Fig. 5. Values of kON (Fig. 5 A), kOFF (Fig. 5 B), and Kd (Fig. 5 C) derived from fits of these data to a Woodhull model are shown in Table I. The general agreement between block parameters derived from steady-state and kinetic measurements validates our final model of bbTBA block, which assumes a single bbTBA binding site and single step-blocking reaction, and adequate correction for native channel behavior in the calculation of kON. Indeed, despite the discrepancy in Kd (discussed in Materials and methods), our final model describes the data in Fig. 5 C quite well (solid lines). Furthermore, the voltage dependence of bbTBA blockade from the microscopic and macroscopic measurements also match closely (Table I), confirming that the macroscopic measurements are not contaminated by leak or nonspecific ionic currents. Finally, we performed kinetic measurements of bbTBA block in 2 μM Ca2+ as well (unpublished data) and confirmed that bbTBA block does not appear to depend on Ca2+ intrinsically. Together, these single channel measurements give us a more reliable idea of the kinetics and voltage dependence of bbTBA blockade, which are important in considering whether time-dependent block can be accounted for by voltage-dependent block alone.
bbTBA Does Not Behave as a Classical Open Channel Blocker for BK Channels
If BK channels posses an intracellular gate that occludes the bbTBA binding site when closed, one might predict that blocker binding and gate closing are mutually exclusive events, and that bound blocker would prevent or hinder closing of the activation gate. This is exactly what Armstrong originally observed for squid K+ channels (Armstrong, 1971), and is commonly observed for state-dependent blockers. In Fig. 6, we ask whether bbTBA alters the rate of channel closing for BK channels.
Figure 6.

bbTBA does not interfere with closure of the activation gate. (A) An instantaneous IV protocol was used to measure rates of channel deactivation in the absence and presence of 5 μM bbTBA. Channels were maximally activated by a step from −80 to +120 mV, and then returned to a series of repolarization potentials ranging from −200 to −30 mV. Representative tail currents elicited by repolarization to −100 mV in the absence (black) and presence (gray) of 5 μM bbTBA are illustrated. Tail currents were fitted with single exponential functions (dashed lines) in order to obtain deactivation time constants. (B) Deactivation time constants from 14 patches in the absence (black) or presence (gray) of 5 μM bbTBA were averaged (±SEM) and plotted as a function of repolarization voltage. (C) Deactivation time constants from a single patch comparing control (circles) with 5 μM bbTBA (triangles), 1 mM TBA (squares), or both blockers together (bowties) illustrate the speeding effect of TBA on deactivation, which persists in the presence of both blockers. The mild slowing of deactivation kinetics at positive potentials can be explained by the tendency of channels at these potentials to close via the same two-step pathway that state-dependent models would require.
Tail currents measured from channels in the presence of 5 μM bbTBA were well fitted by single exponential functions (Fig. 6 A), although fits did deviate slightly from single exponential kinetics at potentials positive to −80 mV (discussed below). In contrast to expectations for state-dependent block, where bbTBA is predicted to slow the macroscopic rate of deactivation by ∼2.3-fold, Fig. 6 B illustrates that bbTBA had no obvious effect on deactivation time constants over a wide range of potentials, although a progressive, mild slowing is apparent at positive potentials above −120 mV (1.1–1.4-fold). Although initially counterintuitive, our final state-independent model does in fact predict a progressive 1.2–1.3-fold slowing of deactivation at potentials between −200 and −50 mV, caused by the tendency for some open channels (either blocked or unblocked) to either unblock (OB-O-C) or block (O-OB-CB) before closing, rather than close directly in a single step (OB-CB or O-C). Thus, the kinetics of bbTBA block are such that although unblock does not require opening (in this model), a significant fraction of channels tend to traverse the same two-step closing pathways that state-dependent block would require, especially at positive potentials. TBA is known to speed deactivation (Li and Aldrich, 2004), an effect that was recapitulated in a single patch shown in Fig. 6 C, illustrating that the approximately twofold speeding of deactivation by TBA reported previously was easily distinguishable in our measurements. The results of Fig. 6 suggest that closure of the activation gate is not physically hindered by the presence of bbTBA, which is consistent with at least two alternative interpretations: either closure of the gate does not occlude the bbTBA binding site (state-independent block) or the bbTBA binding site is gated, but channels close with a blocker molecule trapped inside the pore (an alternative model of state-dependent blockade).
Some channels are capable of trapping small molecules inside the pore cavity after closure of the activation gate (Armstrong, 1971; Strichartz, 1973; Neely and Lingle, 1986; Holmgren, Smith and Yellen, 1997). This would be represented by extension of the state- dependent model (Scheme 2) into C-O-OB-CB. Modeling confirms that this trapping model could also explain the mild slowing of deactivation by bbTBA and still assume that block is state dependent. Indeed, there is evidence that the internal cavity of BK channels is larger than that of most K+ channels (Li and Aldrich, 2004), and thus may be large enough to accommodate bbTBA with a closed (cytoplasmic) gate. If BK channels can trap bbTBA, then one would expect that a substantial fraction of open channels that are blocked during the test pulse will remain blocked immediately after rapid closure and reopening, and current will simply rise to steady-state block levels with minimal or no time dependence. However, we found no evidence for trapping of bbTBA inside BK channels (Fig. 7). Fig. 7 A shows a trapping experiment performed in 20 μM internal Ca2+, where three control pulses to +150 mV were followed by three pulses in the presence of 5 μM bbTBA. The interpulse interval was set to 5 ms at −200 mV, in order to close channels rapidly and minimize the possibility of bbTBA escaping from open channels, either before closing or during rare reopening events (Po at −200 mV ∼ 0.0001; Horrigan and Aldrich, 2002). Fig. 7 A shows that time-dependent block remained intact for each test pulse. In the context of a state-dependent model of block, the persistence of the time dependence would suggest that channels do not remain blocked during the interpulse interval, i.e., channels cannot trap bbTBA and have to wait for blocker to exit before closing (in which case one would expect to see slowing of deactivation). Obviously, this interpretation is difficult to reconcile with Fig. 6. Alternatively, a state-independent model of block posits that time dependence simply reflects equilibration of channels to the change in test potential; one would not expect this to change for three identical test pulses.
The trapping experiment was repeated in 4 μM internal Ca2+ (Fig. 7 B) where probability of channel opening at −200 mV is expected to be 10-fold lower than in 20 μM Ca2+ (∼0.00001; Horrigan and Aldrich, 2002). The apparent inability of channels to trap bbTBA (and the lack of slowed deactivation at negative potentials in Fig. 6) cannot be explained by rapid escape of bbTBA before channels close, since the expected rate of unblock at −200 mV (1234 s−1; extrapolated from Fig. 5 B) is roughly four times slower than the rate of channel closing in Fig. 7 B (4680 s−1). This was confirmed by demonstrating that block of tail currents at negative potentials was much greater than predicted by extrapolation of steady-state block at positive potentials (Fig. 7 C), indicating that channels are still blocked at the time of closing. Note further that deactivation in 4 μM internal Ca2+ (Fig. 7 B) is even faster than the measurements made in Fig. 7 C, using 100 μM Ca2+ (Cui et al., 1997). The recovery from block of channels between test pulses in Fig. 7 (A and B) is consistent with the expected rate of unblock at −200 mV noted above, and, given the exceedingly low probability of channel opening, implies that bbTBA dissociates from closed channels. Together, the results of Figs. 6 and 7 are most easily understood in terms of a state-independent model of blockade, where the gate is located in a position that does not interfere with the deactivation process and does not permit trapping of intracellular bbTBA inside the cavity.
bbTBA Blockade Does Not Depend Strongly upon Open Probability
One can directly assay the state dependence of channel blockade by comparing the efficacy of block under conditions where Po is high and low, while voltage is kept constant. The BK channel is particularly amenable to such experiments by virtue of its activation by both voltage and Ca2+. Thus, one can measure ionic current (and blockade) at a single test potential while activating channels to different levels of open probability with Ca2+. If bbTBA block requires channel opening, steady-state block should be maximal at high Po and minimal at low Po where only a few channels have reached the open state. Conversely, block that is independent of channel conformation should be equally effective at all levels of Po. To discriminate between these possibilities, macroscopic steady-state fractional block was measured at several test potentials under a variety of different Ca2+ conditions representing a wide range of open probabilities (Fig. 8). Fig. 8 A illustrates two representative measurements of ionic current blockade at +90 mV from the same patch exposed to either 100 or 1 μM internal Ca2+, ±5 μM bbTBA. The relative Po vs. voltage relationships for this patch (Fig. 8 B) show that open probability at this voltage is ∼1 or ∼0.25 under these conditions, respectively. It is apparent in Fig. 8 A that despite the large difference in open probability, fractional block appears roughly equivalent (although block at low Po is ∼5% less effective). When fractional unblock is plotted as a function of test potential together with relative Po for both Ca2+ conditions (Fig. 8 B), it is evident that fractional block changes modestly with test voltage, in accordance with a Woodhull model of voltage-dependent block, even between +90 and +180 mV where Po changes dramatically. The voltage dependence of blockade is characterized further in Fig. 8 C.
Measurements of the kind illustrated in Fig. 8 B were made under a variety of different Ca2+ conditions ranging from 1 to 100 μM Ca2+, and fractional unblock was then plotted as a function of test potential (Fig. 8 C) or relative Po (Fig. 8 D). Fig. 8 C illustrates the average voltage dependence of block at low, medium, and high Po. The apparent affinity of block (derived from fitting of each dataset to Eq. 3) at low Po was slightly lower (∼10 μM) than at high Po (∼8 μM), although our final model of bbTBA block (Kd(0) = 8.9 μM and zδ = 0.15, solid line) describes all three datasets quite well. The similarity of the voltage dependence of block at high and low Po (Fig. 8 C: high Po, zδ = 0.14; low Po, zδ = 0.17) suggests that block of open and closed states occurs at the same site across the transmembrane field; however the degree of voltage dependence could also be affected by ion occupancy. In Fig. 8 D, the same measurements of fractional unblock were plotted individually as a function of open probability, for each of three different voltages. Individual data points at each voltage were then fit with a linear function. No obvious dependence of block on Po is apparent from these data. Fig. 8 suggests that bbTBA can bind to either closed or open BK channels, with no strong preference for the open conformation.
Because the macroscopic measurements shown in Fig. 8 are subject to limitations such as voltage-dependent Ba2+ block (Cox et al., 1997) and difficulty in measuring small current amplitudes at low Po, as well as potential errors in estimating open probability from macroscopic Po-V curves, we performed similar experiments using microscopic measurements of fractional block (Fig. 9). The time course of a typical experiment is shown in Fig. 9 A. 10-s sweeps at +40 mV were recorded from an excised patch perfused with 2 μM internal Ca2+, which was alternated with 5 μM bbTBA several times before repeating the process with 4, 10, and 100 μM Ca2+ solutions ± 5 μM bbTBA. This procedure allowed us to monitor directly the stability of Po over the duration of the experiment and ensure accurate measurement of Po changes induced by blocker. The first two sweeps in the absence and presence of bbTBA for 2 μM Ca2+ (sweeps 1 and 2 in Fig. 9 A) are illustrated in Fig. 9 B. As shown in the top left panel of Fig. 9 B, Po in 2 μM Ca2+ was 0.09; 100 ms of this record shown on an expanded time scale below illustrates that channel activity mainly consisted of short openings punctuated by flickery closing events. When 5 μM bbTBA was applied, Po was reduced to 0.05, primarily due to a reduction in mean open time (Fig. 9 B, right). Fractional block at Po ∼ 0.09 computed from the raw amplitude histograms in Fig. 9 C was 45%.
Sweeps 3 and 4 recorded in 100 μM internal Ca2+ ± 5 μM bbTBA are illustrated in Fig. 9 D. In this case, control Po (0.89) was reduced to 0.44 in the presence of bbTBA. Note from the data on a faster time scale that channel activity is qualitatively similar to that observed in 2 μM Ca2+; control openings are still interrupted by flickery closings, and mean open time in blocker is similarly reduced. Fractional block computed from the amplitude histograms in Fig. 9 E at Po ∼ 0.9 was 51%. This experiment shows that, as the macroscopic data suggested, block does appear modestly reduced at low Po. To see whether this ∼6% decrease in block at low Po is compatible with state-dependent block, we compared data from several patches to model predictions in Fig. 10.
Individual measurements of microscopic fractional block from several experiments were plotted as a function of Po (Fig. 10). Predictions of fractional block made using state-dependent (Scheme 2) and state-independent (Scheme 3) models are shown as dashed lines. The data are best fit by a line that matches closely the predictions of a state-independent model of block. However, it is apparent from these data that, on average, a 7% decline in block is observed over the range of Po from 0.97 to 0.03. This translates into a modest 1.3-fold change in apparent affinity at +40 mV, from 4.5 to 6 μM. Although this change in apparent affinity deviates from a model of purely state-independent block, it is clearly not compatible with the large change in apparent affinity predicted by the state-dependent model for the same change in Po (which predicts a 31-fold lowering of apparent affinity, giving a Kd of 144 μM at Po = 0.03).
The mechanistic picture of bbTBA blockade that emerges from Figs. 8–10 is one where binding of bbTBA is enhanced to a small degree in the open state, but not gated in an absolute fashion by channel conformation. The difference in apparent affinity between the open and closed conformations results in a modest 7% change in the fraction of blocked channels over a range of Po encompassing nearly two orders of magnitude. The final piece of evidence that we present against open channel block comes from returning again to the initial observation that bbTBA blockade is time dependent.
At high concentrations of bbTBA (∼75–100 μM), a third component of time-dependent block becomes apparent in the macroscopic record. Fig. 11 A illustrates the three kinetic phases of time-dependent block for currents at +90 or +150 mV in the presence of 75 μM bbTBA; current initially increases to a maximum, and then rapidly declines, and finally increases again to steady state. These complex kinetics are predicted by our final model of state-independent block, and, importantly, are not compatible with state-dependent block (Fig. 11 B). The data at +90 mV were roughly approximated by our final model (dashed black line). Only minor adjustment of those parameters was required to fit the steady-state level of blockade in this patch; we also added the assumption that bbTBA slows activation in order to more accurately describe the kinetics (solid red line). (It is important to note that, while we have no evidence to justify this particular adjustment, this slowing of activation was not required in order to reproduce the triphasic kinetics of block.) The data require that some fraction of channels start in the closed, blocked state, consistent with expectations of voltage-dependent, state-independent block. The smaller fraction of closed, blocked channels required to fit our data (35–50%, compared with predictions of ∼80%) may be due to the preference of bbTBA for the open state. Finally, the state-dependent version of our final adjusted model is grossly incompatible with the observed data, predicting a much larger change in fractional block during the time-dependent component, and biphasic kinetics (solid blue line).
Fig. 11 C uses the occupancy of each state over time to explain how these complex kinetics arise in the ionic currents, and why they cannot be observed for state-dependent block. The final adjusted model is illustrated in the inset, including the rate constants used for modeling block at +90 mV in 75 μM bbTBA. Each state in the model is represented by a different color, and the fraction of channels populating that state is plotted over time in the same color. As in Fig. 11 B, we assume that 35% of channels are initially closed and blocked (CB), while the remaining 65% are closed (C). At the start of the voltage step, occupancy of the closed state falls as many channels quickly become blocked (C-CB), and the remaining channels more slowly enter the open state (C-O). Thus, occupancy of CB rises and then begins to decline slowly as channels continue on to the open blocked state (CB-OB); this in turn is reflected by the steady rise in occupancy of OB. Meanwhile, those channels that entered the open state initially rapidly become blocked and contribute to the population of OB. Finally, the slow transition of channels from C to O comes to a halt, and occupancy reaches a steady state. Thus, occupancy of the open state (which shapes the kinetics of current blockade) is dominated in the first phase by channels entering the open state (C-O); during the second phase, channels leave the open state to become blocked; and finally in the third phase, the slow kinetics of the closed to open transition again dominate as occupancy of O and OB reaches steady-state equilibrium.
Triphasic block kinetics arise from the simultaneous combination of the relatively fast blocking process and the comparably slower activation process. The rapid population of the blocked states requires direct connectivity between the closed and blocked states (C and CB). This is in direct contrast with state-dependent models, where channel opening is the rate-limiting step for blockade, and explains why triphasic block kinetics cannot be obtained from state-dependent models. Although triphasic kinetics do not require some fraction of channels starting in CB, the correct amplitude of the peak current does. No permutation of state-dependent models, including a trapping model, was able to account for this complex time dependence. Fig. 11 provides strong support for a state-independent mechanism of bbTBA blockade of BK channels.
DISCUSSION
Time-dependent blockade, although often suggestive of open channel block, is equally compatible with models that do not require the open channel conformation for blocker to access its binding site. We found that the time dependence of bbTBA block is a direct result of the intrinsic voltage dependence of block, with little dependence on channel opening. The present work provides the following evidence of state independent block. (a) Macroscopic deactivation was not significantly affected by bbTBA at negative potentials, and only mildly slowed at positive potentials; this is in direct contrast to expectations for state-dependent block, which predicts slowing at all potentials, especially negative voltages, and suggests that bound bbTBA does not prevent channel closing. (b) Trapping experiments suggest that bbTBA cannot be confined within the cavity after channel closure, indicating that closure of the activation gate does not prohibit bbTBA dissociation. (c) Macroscopic and microscopic measurements of steady-state block as a function of open probability suggest that block does in fact have a mild preference for the open channel conformation, but to a degree that deviates substantially from predictions of a purely state-dependent model. The observation that ∼45% of channels are blocked when fewer than 10% of channels are open further supports the idea that channels can be blocked in the closed state. (d) Finally, our final state-independent model of bbTBA block was able to accurately describe the kinetics of blockade at high concentrations of bbTBA, where the time dependence of block was triphasic. These unusual triphasic kinetics, which result from simultaneous blocking and opening of channels, could not be reproduced by any state-dependent model we tested. Together, our results strongly suggest that closure of the activation gate does not present a significant barrier to bbTBA binding site access.
Implications for Location of the BK Channel Permeation Gate
Relatively unrestricted access of intracellular bbTBA in the open and closed channel conformations implies that K+ flux is gated at a location that is extracellular to the bbTBA binding site. Since QA ions are known to dock at the internal entrance to the selectivity filter, deep within the channel's intracellular cavity (Choi et al., 1993; Zhou et al., 2001a; Lenaeus et al., 2005), this places the permeation gate at or above the selectivity filter. Our findings suggest that current assumptions about BK channel architecture and gating may need to be reevaluated.
Jiang et al. (2001, 2002a,b) postulate that mammalian BK channels share the same gating mechanism proposed for the bacterial Ca2+-gated K+ channel MthK. Extrapolation of their gating model from the prokaryotic MthK to the eukaryotic BK channel was based on <20% amino acid conservation between the two proteins, and a shift in the voltage dependence of activation after mutation of a putative salt bridge site in the BK channel (Jiang et al., 2001). Their gating model involves an intracellular gating ring which, upon ligand binding, tugs the S6 bundle helices apart. Niu et al. (2004) have expanded upon this gating model by proposing that both Ca2+ and voltage activation of BK channels involves passive coupling of either the ligand-binding gating ring or the voltage-sensing apparatus to the S6 gate via separate hinges, based on the observation that deletions and insertions into the lower S6 region alter gating. However, mutations in the S6 regions of KATP and CNG channels, which do not appear to use intracellular S6 gates, also disrupt gating (Trapp et al., 1998; Flynn and Zagotta, 2003). In addition, Ca2+-dependent gating of the MthK channel differs in significant ways from that of the BK channel, suggesting the possibility of different gating mechanisms (Zadek and Nimigean, 2006). Thus, in the absence of any direct evidence in support of an intracellular gate (or gating ring), the degree to which this model represents BK channel gating remains unclear.
Recent work (unpublished data) provides strong evidence that conformational rearrangements associated with gating regulate access of intracellular Shaker ball peptides to the BK channel pore. The support for this comes from time-dependent block, slowing of macroscopic deactivation and a hook in the tail currents, and correlation of the degree of fractional block with macroscopic Po. Although clearly demonstrating state-dependent block by ball peptides, that study is not conclusive about the gate for K+ ions, since these 20 amino acid peptides are orders of magnitude larger than permeant K+ ions. How can we reconcile gated access of a bulky peptide with relatively unrestricted access of a smaller quaternary ammonium derivative? One could speculate that permeation gating of BK channels involves movements at or above the selectivity filter that are obligatorily coupled to rearrangements of an intracellular protein structure (for example, the putative gating ring). Reorganization of intracellular regions, including the S6 helices, may indeed gate access of ball peptide to the pore, while for the smaller blocker bbTBA, these same movements only slightly alter access and/or binding to a constantly available site. The reverse conformational change in S6, while permitted by bound bbTBA, could be sterically prohibited until ball peptide dissociates, resulting in slower macroscopic deactivation.
Might BK Channels Have a Selectivity Filter Gate?
Gating of K+ flux at the selectivity filter of BK channels is an attractive possibility, when one considers the classic experiments of Miller et al. (1987), which showed not only that occupancy of BK channel selectivity filter by Ba2+ destabilizes the closed state (Miller, 1987; Miller et al., 1987), but also that, in the closed state, the selectivity filter is inaccessible to Ba2+ from both the internal and external face of the membrane, as if both ends of the selectivity filter pinch shut (Miller et al., 1987). This possibility is made all the more attractive by recent work illustrating that BK channel gating is unusually sensitive to selectivity filter occupancy; permeant thallium favors flickery gating on the submillisecond time scale, which may be a direct result of rapid conformational changes of the selectivity filter (Piskorowski and Aldrich, 2006), and also prevents TBA from speeding deactivation (Piskorowski, 2005).
One of the best studied selectivity filter gates is the C-type inactivation gate of Kv channels. Functional evidence strongly suggests that C-type inactivation involves conformational changes of the outer mouth and selectivity filter, as well as the S4 voltage-sensing region, of Kv channels (Timpe et al., 1988; Choi, Aldrich and Yellen, 1991; Lopez-Barneo et al., 1993; Yellen et al., 1994; Baukrowitz and Yellen, 1996; Loots and Isacoff, 1998). A similar mechanism may account for voltage-dependent gating of Kcsa (Cordero-Morales et al., 2006). A rather striking feature of BK channels, by contrast, is their lack of intrinsic inactivation, even after long periods of recording. A simple explanation for this might be that the C-type inactivation gate for BK channels is in fact the permeation gate itself.
Comparisons with CNG Channel Gating
Gating of CNG channels, which are also activated by intracellular ligand and are evolutionary relatives of BK channels, embodies many of the basic principles we propose for BK channels. In general, activation appears to involve a substantial rearrangement of the lower S6 bundle crossing, as evidenced by state-dependent block by intracellular tetracaine (Fodor et al., 1997a,b), dequalinium (Rosenbaum et al., 2004), and state-dependent QA block and accessibility (Contreras and Holmgren, 2006). These motions, which widen the constriction from ∼5 to 12 Å (Flynn and Zagotta, 2001; Flynn and Zagotta, 2003), are required to accommodate both spontaneous salt bridge formation at lower S6 residues only in the closed state, and the large difference in reactivity of the relatively large MTSET molecule with pore-lining residues in the open and closed states (Flynn and Zagotta, 2001). However, constriction of the internal pore entrance does not constitute permeation gating for CNG channels: smaller Ag+ and MTSEA ions react roughly equivalently with pore residues regardless of channel conformation (Flynn and Zagotta, 2001), and pore block by Ni2+ is state independent (Karpen et al., 1993). Rather, it is thought that S6 conformational changes are coupled to intrinsic permeation gating of CNG channels at the selectivity filter, a proposal that draws support from state-dependent conformational changes observed in the outer pore region (Becchetti and Roncaglia, 2000; Liu and Siegelbaum, 2000).
CNG channels also exemplify that the apparent affinity of blockers can depend, often dramatically, on channel conformation, without being gated, e.g., enhanced coordination of Ni2+ by lower S6 histidine residues in the open state (Gordon and Zagotta, 1995a,b), and increased apparent affinity of several large blockers in the closed state (Fodor et al., 1997a,b; Rosenbaum et al., 2004). Similarly, block of BK channels by C10 showed a preference for the open state, which was far less than one would expect based on pure open channel block (Li and Aldrich, 2004). The observed slight preference of bbTBA for the open conformation in the present study appears similar.
Widening of the intracellular bundle crossing for both CNG and BK channels gates access of larger molecules, while smaller reagents and permeant ions are able to pass through the aperture regardless of channel state. If the largest molecules able to pass the bundle crossing freely are any indication of size, the diameter of the closed state bundle crossing is larger for BK channels than for CNG channels, consistent with the larger dimensions of the BK channel cavity (Li and Aldrich, 2004). We speculate that BK channels may share with their CNG cousins a conserved gating mechanism, which involves conformational changes at the bundle crossing and permeation gating at the selectivity filter.
Conclusions and Future Directions
Our work presents evidence for a voltage-gated channel that is not gated at the S6 bundle crossing. Although the exact location of the permeation gate for BK channels remains an open question, the most obvious candidate position is the selectivity filter itself. Despite numerous potential pitfalls (including 29 native cysteines, functional consequences of MTS modification, activation of BK channels by Cd2+, and buffering requirements for Ag+, which would stipulate minimal Ca2+ conditions), future experiments using cysteine accessibility and small probes (e.g., Ag+, Cd2+, or MTSEA) may be useful to convincingly establish the location of the permeation gate.
Acknowledgments
Thanks to Jon Sack for planting the seed that started the story, technical help with programming and data analysis, and unbounded enthusiasm for channel biophysics. Thanks to Weiyan Li for guidance and support at every stage of this project. We also thank Justin Dubois for assistance in locating novel QA molecules for electrophysiological assays.
This work was supported by the Howard Hughes Medical Institute and the Mathers Foundation.
David C. Gadsby served as editor.
Abbreviations used in this paper: bbTBA, N-(4-[benzoyl]benyl)-N,N,N-tributylammonium bromide; BK, large-conductance Ca2+- and voltage-activated potassium; C10, decyltriethylammonium; CNG, cyclic nucleotide-gated; Po, open probability; QA, quaternary ammonium; TBA, tetrabutylammonium.
References
- Armstrong, C.M. 1966. Time course of TEA(+)-induced anomalous rectification in squid giant axons. J. Gen. Physiol. 50:491–503. [DOI] [PMC free article] [PubMed] [Google Scholar]
- Armstrong, C.M. 1969. Inactivation of the potassium conductance and related phenomena caused by quaternary ammonium ion injection in squid axons. J. Gen. Physiol. 54:553–575. [DOI] [PMC free article] [PubMed] [Google Scholar]
- Armstrong, C.M. 1971. Interaction of tetraethylammonium ion derivatives with the potassium channels of giant axons. J. Gen. Physiol. 58:413–437. [DOI] [PMC free article] [PubMed] [Google Scholar]
- Armstrong, C.M., and B. Hille. 1972. The inner quaternary ammonium ion receptor in potassium channels of the node of Ranvier. J. Gen. Physiol. 59:388–400. [DOI] [PMC free article] [PubMed] [Google Scholar]
- Baukrowitz, T., and G. Yellen. 1996. Use-dependent blockers and exit rate of the last ion from the multi-ion pore of a K+ channel. Science. 271:653–656. [DOI] [PubMed] [Google Scholar]
- Becchetti, A., and P. Roncaglia. 2000. Cyclic nucleotide-gated channels: intra- and extracellular accessibility to Cd2+ of substituted cysteine residues within the P-loop. Pflugers Arch. 440:556–565. [DOI] [PubMed] [Google Scholar]
- Benzinger, G.R., X.M. Xia, and C.J. Lingle. 2006. Direct observation of a preinactivated, open state in BK channels with β2 subunits. J. Gen. Physiol. 127:119–131. [DOI] [PMC free article] [PubMed] [Google Scholar]
- Bers, D.M. 1982. A simple method for the accurate determination of free [Ca] in Ca-EGTA solutions. Am. J. Physiol. 242:C404–C408. [DOI] [PubMed] [Google Scholar]
- Bruening-Wright, A., M.A. Schumacher, J.P. Adelman, and J. Maylie. 2002. Localization of the activation gate for small conductance Ca2+-activated K+ channels. J. Neurosci. 22:6499–6506. [DOI] [PMC free article] [PubMed] [Google Scholar]
- Butler, A., S. Tsunoda, D.P. McCobb, A. Wei, and L. Salkoff. 1993. mSlo, a complex mouse gene encoding “maxi” calcium-activated potassium channels. Science. 261:221–224. [DOI] [PubMed] [Google Scholar]
- Choi, K.L., R.W. Aldrich, and G. Yellen. 1991. Tetraethylammonium blockade distinguishes two inactivation mechanisms in voltage-activated K+ channels. Proc. Natl. Acad. Sci. USA. 88:5092–5095. [DOI] [PMC free article] [PubMed] [Google Scholar]
- Choi, K.L., C. Mossman, J. Aube, and G. Yellen. 1993. The internal quaternary ammonium receptor site of Shaker potassium channels. Neuron. 10:533–541. [DOI] [PubMed] [Google Scholar]
- Contreras, J.E., and M. Holmgren. 2006. Access of quaternary ammonium blockers to the internal pore of cyclic nucleotide-gated channels: implications for the location of the gate. J. Gen. Physiol. 127:481–494. [DOI] [PMC free article] [PubMed] [Google Scholar]
- Cordero-Morales, J.F., L.G. Cuello, Y. Zhao, V. Jogini, D.M. Cortes, B. Roux, and E. Perozo. 2006. Molecular determinants of gating at the potassium-channel selectivity filter. Nat. Struct. Mol. Biol. 13:311–318. [DOI] [PubMed] [Google Scholar]
- Cox, D.H., J. Cui, and R.W. Aldrich. 1997. Separation of gating properties from permeation and block in mslo large conductance Ca-activated K+ channels. J. Gen. Physiol. 109:633–646. [DOI] [PMC free article] [PubMed] [Google Scholar]
- Cui, J., D.H. Cox, and R.W. Aldrich. 1997. Intrinsic voltage dependence and Ca2+ regulation of mslo large conductance Ca-activated K+ channels. J. Gen. Physiol. 109:647–673. [DOI] [PMC free article] [PubMed] [Google Scholar]
- Demo, S.D., and G. Yellen. 1991. The inactivation gate of the Shaker K+ channel behaves like an open-channel blocker. Neuron. 7:743–753. [DOI] [PubMed] [Google Scholar]
- Demo, S.D., and G. Yellen. 1992. Ion effects on gating of the Ca(2+)-activated K+ channel correlate with occupancy of the pore. Biophys. J. 61:639–648. [DOI] [PMC free article] [PubMed] [Google Scholar]
- Doyle, D.A., J. Morais Cabral, R.A. Pfuetzner, A. Kuo, J.M. Gulbis, S.L. Cohen, B.T. Chait, and R. MacKinnon. 1998. The structure of the potassium channel: molecular basis of K+ conduction and selectivity. Science. 280:69–77. [DOI] [PubMed] [Google Scholar]
- Fan, C.X., X.K. Chen, C. Zhang, L.X. Wang, K.L. Duan, L.L. He, Y. Cao, S.Y. Liu, M.N. Zhong, C. Ulens, et al. 2003. A novel conotoxin from Conus betulinus, kappa-BtX, unique in cysteine pattern and in function as a specific BK channel modulator. J. Biol. Chem. 278:12624–12633. [DOI] [PubMed] [Google Scholar]
- Flynn, G.E., and W.N. Zagotta. 2001. Conformational changes in S6 coupled to the opening of cyclic nucleotide-gated channels. Neuron. 30:689–698. [DOI] [PubMed] [Google Scholar]
- Flynn, G.E., and W.N. Zagotta. 2003. A cysteine scan of the inner vestibule of cyclic nucleotide-gated channels reveals architecture and rearrangement of the pore. J. Gen. Physiol. 121:563–582. [DOI] [PMC free article] [PubMed] [Google Scholar]
- Fodor, A.A., K.D. Black, and W.N. Zagotta. 1997. a. Tetracaine reports a conformational change in the pore of cyclic nucleotide-gated channels. J. Gen. Physiol. 110:591–600. [DOI] [PMC free article] [PubMed] [Google Scholar]
- Fodor, A.A., S.E. Gordon, and W.N. Zagotta. 1997. b. Mechanism of tetracaine block of cyclic nucleotide-gated channels. J. Gen. Physiol. 109:3–14. [DOI] [PMC free article] [PubMed] [Google Scholar]
- Gordon, S.E., and W.N. Zagotta. 1995. a. Subunit interactions in coordination of Ni2+ in cyclic nucleotide-gated channels. Proc. Natl. Acad. Sci. USA. 92:10222–10226. [DOI] [PMC free article] [PubMed] [Google Scholar]
- Gordon, S.E., and W.N. Zagotta. 1995. b. A histidine residue associated with the gate of the cyclic nucleotide-activated channels in rod photoreceptors. Neuron. 14:177–183. [DOI] [PubMed] [Google Scholar]
- Hamill, O.P., A. Marty, E. Neher, B. Sakmann, and F.J. Sigworth. 1981. Improved patch-clamp techniques for high-resolution current recording from cells and cell-free membrane patches. Pflugers Arch. 391:85–100. [DOI] [PubMed] [Google Scholar]
- Heginbotham, L., T. Abramson, and R. MacKinnon. 1992. A functional connection between the pores of distantly related ion channels as revealed by mutant K+ channels. Science. 258:1152–1155. [DOI] [PubMed] [Google Scholar]
- Holmgren, M., P.L. Smith, and G. Yellen. 1997. Trapping of organic blockers by closing of voltage-dependent K+ channels: evidence for a trap door mechanism of activation gating. J. Gen. Physiol. 109:527–535. [DOI] [PMC free article] [PubMed] [Google Scholar]
- Horrigan, F.T., and R.W. Aldrich. 2002. Coupling between voltage sensor activation, Ca2+ binding and channel opening in large conductance (BK) potassium channels. J. Gen. Physiol. 120:267–305. [DOI] [PMC free article] [PubMed] [Google Scholar]
- Horrigan, F.T., J. Cui, and R.W. Aldrich. 1999. Allosteric voltage gating of potassium channels. I. Mslo ionic currents in the absence of Ca2+. J. Gen. Physiol. 114:277–304. [DOI] [PMC free article] [PubMed] [Google Scholar]
- Jiang, Y., A. Lee, J. Chen, M. Cadene, B.T. Chait, and R. MacKinnon. 2002. a. Crystal structure and mechanism of a calcium-gated potassium channel. Nature. 417:515–522. [DOI] [PubMed] [Google Scholar]
- Jiang, Y., A. Lee, J. Chen, M. Cadene, B.T. Chait, and R. MacKinnon. 2002. b. The open pore conformation of potassium channels. Nature. 417:523–526. [DOI] [PubMed] [Google Scholar]
- Jiang, Y., A. Lee, J. Chen, V. Ruta, M. Cadene, B.T. Chait, and R. MacKinnon. 2003. X-ray structure of a voltage-dependent K+ channel. Nature. 423:33–41. [DOI] [PubMed] [Google Scholar]
- Jiang, Y., A. Pico, M. Cadene, B.T. Chait, and R. MacKinnon. 2001. Structure of the RCK domain from the E. coli K+ channel and demonstration of its presence in the human BK channel. Neuron. 29:593–601. [DOI] [PubMed] [Google Scholar]
- Karpen, J.W., R.L. Brown, L. Stryer, and D.A. Baylor. 1993. Interactions between divalent cations and the gating machinery of cyclic GMP-activated channels in salamander retinal rods. J. Gen. Physiol. 101:1–25. [DOI] [PMC free article] [PubMed] [Google Scholar]
- Kuo, A., J.M. Gulbis, J.F. Antcliff, T. Rahman, E.D. Lowe, J. Zimmer, J. Cuthbertson, F.M. Ashcroft, T. Ezaki, and D.A. Doyle. 2003. Crystal structure of the potassium channel KirBac1.1 in the closed state. Science. 300:1922–1926. [DOI] [PubMed] [Google Scholar]
- Lenaeus, M.J., M. Vamvouka, P.J. Focia, and A. Gross. 2005. Structural basis of TEA blockade in a model potassium channel. Nat. Struct. Mol. Biol. 12:454–459. [DOI] [PubMed] [Google Scholar]
- Li, W., and R.W. Aldrich. 2004. Unique inner pore properties of BK channels revealed by quaternary ammonium block. J. Gen. Physiol. 124:43–57. [DOI] [PMC free article] [PubMed] [Google Scholar]
- Liu, J., and S.A. Siegelbaum. 2000. Change of pore helix conformational state upon opening of cyclic nucleotide-gated channels. Neuron. 28:899–909. [DOI] [PubMed] [Google Scholar]
- Liu, Y., M. Holmgren, M.E. Jurman, and G. Yellen. 1997. Gated access to the pore of a voltage-dependent K+ channel. Neuron. 19:175–184. [DOI] [PubMed] [Google Scholar]
- Long, S.B., E.B. Campbell, and R. Mackinnon. 2005. Crystal structure of a mammalian voltage-dependent Shaker family K+ channel. Science. 309:897–903. [DOI] [PubMed] [Google Scholar]
- Loots, E., and E.Y. Isacoff. 1998. Protein rearrangements underlying slow inactivation of the Shaker K+ channel. J. Gen. Physiol. 112:377–389. [DOI] [PMC free article] [PubMed] [Google Scholar]
- Lopez-Barneo, J., T. Hoshi, S.H. Heinemann, and R.W. Aldrich. 1993. Effects of external cations and mutations in the pore region on C-type inactivation of Shaker potassium channels. Receptors Channels. 1:61–71. [PubMed] [Google Scholar]
- MacKinnon, R., L. Heginbotham, and T. Abramson. 1990. Mapping the receptor site for charybdotoxin, a pore-blocking potassium channel inhibitor. Neuron. 5:767–771. [DOI] [PubMed] [Google Scholar]
- MacKinnon, R., and C. Miller. 1989. Mutant potassium channels with altered binding of charybdotoxin, a pore-blocking peptide inhibitor. Science. 245:1382–1385. [DOI] [PubMed] [Google Scholar]
- MacKinnon, R., and G. Yellen. 1990. Mutations affecting TEA blockade and ion permeation in voltage-activated K+ channels. Science. 250:276–279. [DOI] [PubMed] [Google Scholar]
- Miller, C. 1987. Trapping single ions inside single ion channels. Biophys. J. 52:123–126. [DOI] [PMC free article] [PubMed] [Google Scholar]
- Miller, C., R. Latorre, and I. Reisin. 1987. Coupling of voltage-dependent gating and Ba2+ block in the high-conductance, Ca2+-activated K+ channel. J. Gen. Physiol. 90:427–449. [DOI] [PMC free article] [PubMed] [Google Scholar]
- Neely, A., and C.J. Lingle. 1986. Trapping of an open-channel blocker at the frog neuromuscular acetylcholine channel. Biophys. J. 50:981–986. [DOI] [PMC free article] [PubMed] [Google Scholar]
- Neyton, J., and M. Pelleschi. 1991. Multi-ion occupancy alters gating in high-conductance, Ca2+-activated K+ channels. J. Gen. Physiol. 97:641–665. [DOI] [PMC free article] [PubMed] [Google Scholar]
- Niu, X., X. Qian, and K.L. Magleby. 2004. Linker-gating ring complex as passive spring and Ca(2+)-dependent machine for a voltage- and Ca(2+)-activated potassium channel. Neuron. 42:745–756. [DOI] [PubMed] [Google Scholar]
- Piskorowski, R.A. 2005. Gating mechanisms of BK channels probed by structural perturbations. Ph.D. thesis. Stanford University. Stanford, CA. 158 pp.
- Piskorowski, R.A., and R.W. Aldrich. 2006. Relationship between pore occupancy and gating in BK potassium channels. J. Gen. Physiol. 127:557–576. [DOI] [PMC free article] [PubMed] [Google Scholar]
- Proks, P., J.F. Antcliff, and F.M. Ashcroft. 2003. The ligand-sensitive gate of a potassium channel lies close to the selectivity filter. EMBO Rep. 4:70–75. [DOI] [PMC free article] [PubMed] [Google Scholar]
- Rosenbaum, T., A. Gordon-Shaag, L.D. Islas, J. Cooper, M. Munari, and S.E. Gordon. 2004. State-dependent block of CNG channels by dequalinium. J. Gen. Physiol. 123:295–304. [DOI] [PMC free article] [PubMed] [Google Scholar]
- Shin, K.S., B.S. Rothberg, and G. Yellen. 2001. Blocker state dependence and trapping in hyperpolarization-activated cation channels: evidence for an intracellular activation gate. J. Gen. Physiol. 117:91–101. [DOI] [PMC free article] [PubMed] [Google Scholar]
- Solaro, C.R., J.P. Ding, Z.W. Li, and C.J. Lingle. 1997. The cytosolic inactivation domains of BKi channels in rat chromaffin cells do not behave like simple, open-channel blockers. Biophys. J. 73:819–830. [DOI] [PMC free article] [PubMed] [Google Scholar]
- Strichartz, G.R. 1973. The inhibition of sodium currents in myelinated nerve by quaternary derivatives of lidocaine. J. Gen. Physiol. 62:37–57. [DOI] [PMC free article] [PubMed] [Google Scholar]
- Timpe, L.C., Y.N. Jan, and L.Y. Jan. 1988. Four cDNA clones from the Shaker locus of Drosophila induce kinetically distinct A-type potassium currents in Xenopus oocytes. Neuron. 1:659–667. [DOI] [PubMed] [Google Scholar]
- Trapp, S., P. Proks, S.J. Tucker, and F.M. Ashcroft. 1998. Molecular analysis of ATP-sensitive K channel gating and implications for channel inhibition by ATP. J. Gen. Physiol. 112:333–349. [DOI] [PMC free article] [PubMed] [Google Scholar]
- Woodhull, A.M. 1973. Ionic blockage of sodium channels in nerve. J. Gen. Physiol. 61:687–708. [DOI] [PMC free article] [PubMed] [Google Scholar]
- Yellen, G., M.E. Jurman, T. Abramson, and R. MacKinnon. 1991. Mutations affecting internal TEA blockade identify the probable pore-forming region of a K+ channel. Science. 251:939–942. [DOI] [PubMed] [Google Scholar]
- Yellen, G., D. Sodickson, T.Y. Chen, and M.E. Jurman. 1994. An engineered cysteine in the external mouth of a K+ channel allows inactivation to be modulated by metal binding. Biophys. J. 66:1068–1075. [DOI] [PMC free article] [PubMed] [Google Scholar]
- Zadek, B., and C.N. Nimigean. 2006. Calcium-dependent gating of MthK, a prokaryotic potassium channel. J. Gen. Physiol. 127:673–685. [DOI] [PMC free article] [PubMed] [Google Scholar]
- Zhou, M., J.H. Morais-Cabral, S. Mann, and R. MacKinnon. 2001. a. Potassium channel receptor site for the inactivation gate and quaternary amine inhibitors. Nature. 411:657–661. [DOI] [PubMed] [Google Scholar]
- Zhou, Y., and R. MacKinnon. 2003. The occupancy of ions in the K+ selectivity filter: charge balance and coupling of ion binding to a protein conformational change underlie high conduction rates. J. Mol. Biol. 333:965–975. [DOI] [PubMed] [Google Scholar]