Abstract
The CLC-family protein CLC-ec1, a bacterial homologue of known structure, stoichiometrically exchanges two Cl− for one H+ via an unknown membrane transport mechanism. This study examines mutations at a conserved tyrosine residue, Y445, that directly coordinates a Cl− ion located near the center of the membrane. Mutations at this position lead to “uncoupling,” such that the H+/Cl− transport ratio decreases roughly with the volume of the substituted side chain. The uncoupled proteins are still able to pump protons uphill when driven by a Cl− gradient, but the extent and rate of this H+ pumping is weaker in the more uncoupled variants. Uncoupling is accompanied by conductive Cl− transport that is not linked to counter-movement of H+, i.e., a “leak.” The unitary Cl− transport rate, measured in reconstituted liposomes by both a conventional initial-velocity method and a novel Poisson dilution approach, is ∼4,000 s−1 for wild-type protein, and the uncoupled mutants transport Cl− at similar rates.
INTRODUCTION
The CLC family of Cl−-transporting proteins includes two mechanistic subclasses: channels and exchange transporters (Jentsch et al., 2005a; Miller, 2006). The Cl− channels, which have been studied electrophysiologically for decades, carry out numerous biological tasks requiring gated Cl− conductance of plasma membranes (Jentsch et al., 2005b). The exchangers, only recently recognized (Accardi and Miller, 2004; Picollo and Pusch, 2005; Scheel et al., 2005; De Angeli et al., 2006), stoichiometrically move Cl− and H+ across the membrane in opposite directions and mainly reside in the membranes of acidified intracellular compartments such as endosomes, lysosomes, neurotransmitter vesicles, and plant vacuoles. Of the nine human CLCs, four are channels and two exchangers (the remaining three being unexplored or controversial in function), as deduced from electrophysiological measurements (Picollo and Pusch, 2005), isoform homologies, and a putative diagnostic glutamate residue distinguishing the two subclasses (Accardi et al., 2005).
A bacterial CLC exchange transporter, CLC-ec1, is uniquely amenable to combined electrophysiological and structural analysis (Dutzler et al., 2002, 2003; Accardi et al., 2005, 2006; Nguitragool and Miller, 2006). We hope to understand coupled Cl−/H+ transport by this CLC homologue, as well as to discover mechanistic correspondences between exchange in the CLC transporters and voltage- and H+-dependent gating in the CLC channels (Miller, 2006). Very little is known about the inner workings of Cl−/H+ exchange, but we recently described three phenomenologically distinguishable ways to uncouple transport of the anion from counter-transport of the proton, such that proton movement is reduced while anion movement persists. First, H+ movement is completely abolished by mutation of either of the two glutamate residues that mediate H+ transfer from aqueous solution to the protein interior (Accardi and Miller, 2004; Accardi et al., 2005). Second, substitution of Cl− with nonhalide anions such as NO3 − and SCN− reduces H+ movement while retaining robust anion transport (Nguitragool and Miller, 2006). Finally, mutation of Y445, a tyrosine residue conserved in both channel and transporter subfamilies, leads to variable uncoupling, depending upon the residue substituted (Accardi et al., 2006).
The present investigation follows up this last means of uncoupling by examining an expanded panel of mutants at Y445. It also addresses a mechanistically important question heretofore left unanswered: when the H+/Cl− transport ratio is decreased by mutation, what happens to the absolute rate of Cl− transport? Is it greatly decreased, as might happen in a stalled exchanger, or is it greatly increased, as expected if the uncoupling mutations convert the transporter into a Cl− channel? Our previous estimate of the unitary turnover rate of CLC-ec1 was crude and merely set an upper limit on the true value (Accardi and Miller, 2004). By a novel application of Poisson analysis to Cl− fluxes in liposomes, we now arrive at a reliable value of the absolute unitary transport rate and show that the uncoupled mutants all have rates of Cl− turnover similar to that of wild type.
MATERIALS AND METHODS
Biochemical
Chemicals and other materials were of reagent quality. Expression, His-tag cleavage, purification, and liposome reconstitution of CLC-ec1, the product of Escherichia coli gene clcA (accession P37019), were performed as previously described (Accardi et al., 2004), except that for samples used in liposome fluxes, the final purification step was gel filtration on Superdex 200 rather than anion exchange chromatography on Poros HQ, which was used exclusively for planar lipid bilayer experiments. All preparations (typically 1–10 mg/ml in 5–20 mM decylmaltoside) were checked by overloaded SDS-PAGE to be free of His-tagged and other contaminating bands. Point mutants were constructed by conventional PCR methods and were fully sequenced. All mutants reported expressed well (1–3 mg/liter culture) and gave gel filtration profiles identical to the wild-type homodimer.
Liposomes were formed within 1 d of protein preparation by 30-h dialysis of micellar solutions containing E. coli polar lipid (Avanti, 20 mg/ml), detergent (Chaps, 35 mM), and protein (0.03–50 μg/mg lipid). Protein concentration is reported throughout as protein/lipid weight ratio, denoted “protein density.” Liposomes used for planar bilayer recording were prepared at a protein density of 50 μg/mg in 450 mM KCl, 25 mM KH2PO4, 22.5 mM K3-citrate, 2.5 mM citric acid, pH 7.5. Liposomes used for flux measurements were formed with protein at 0.03–5 μg/mg, 300 mM KCl, and buffered with 25 mM citrate for Cl− flux experiments or 25 mM citrate/ 25 mM phosphate (CPi) for H+ flux experiments, adjusted with NaOH to the desired pH in the range 4.5–5.5. (Some experiments used 75 mM glutamate as buffer, with similar results.) After dialysis, liposomes were stored in aliquots at −80°C until the day of use.
Planar Lipid Bilayer Recording
Horizontal-configuration planar bilayers were formed from decane solutions of 1-palmitoyl-2-oleoyl phosphatidylethanolamine/ 1-palmitoyl-2-oleoyl phosphatidylglycerol (7.5/2.5 mg/ml), as previously described (Accardi et al., 2004). The cis chamber, to which proteoliposomes were added, contained 290 mM KCl, 5 mM histidine-HCl, 5 mM glutamic acid, adjusted to pH 3.0 with KOH; the opposite trans chamber is defined as electrical ground.
Thawed liposomes were sonicated for 5–20 s, and ∼1 μl of the suspension was squirted onto the bilayer to incorporate CLC-ec1 transporters. Insertion was monitored by the increase in current at 50–100 mV holding voltage, with both cis and trans solutions at pH 3, a physiological pH for this protein (Iyer et al., 2002) where CLC-ec1 activity is maximal. After a few minutes the current stabilized, typically at 100–2,000 pA, and a family of voltage pulses was recorded. To establish a 4-unit pH gradient, the trans chamber was perfused with the same solution adjusted to pH 7. Current–voltage (I-V) curves were calculated by averaging the current 2–3 s after application of the command voltage.
Liposome Fluxes
Fluxes of H+ or Cl− were followed by continuous recording, with ion-specific electrodes, in suspensions of liposomes reconstituted with CLC-ec1. Voltage from the electrodes was fed to an Orion 701A high-sensitivity pH meter (Ebay.com) and digitized at 5–10 Hz by a DI-70 datalogger (DATAQ Instruments). Inward proton pumping driven by an outward Cl− gradient was assayed as described previously (Accardi and Miller, 2004), using a glass pH electrode to follow H+ uptake in a lightly buffered suspension. After thawing, liposomes (2.5 μg/mg protein density) loaded with 300 mM KCl, 25 mM CPi, pH 4.8, were extruded 21 times through a 400-nm membrane filter (Nguitragool and Miller, 2006) and were then centrifuged through Sephadex G-50 (100-μl sample per 1.5 ml column) equilibrated with proton-pumping buffer (PPB), 290 mM K-isethionate, 10 mM KCl, 2 mM citrate, pH 5.2, and diluted 10-fold into PPB in a 2-ml stirred cell fitted with a pH electrode. Proton uptake was initiated by addition of 1 μM valinomycin (Vln) and collapsed by FCCP (2 μM). Proton efflux experiments were set up analogously, using liposomes loaded with 300 mM KCl, 25 mM citrate/25 mM MES, pH 4.5, and suspended in 300 mM KCl, 1 mM citrate/MES pH 6.5.
Net Cl− efflux was similarly followed with Ag/AgCl electrodes in a stirred cell temperature-controlled to 25°C. Electrodes were constructed from silver wire cleaned overnight in concentrated HNO3 and coated with AgCl by immersion in Clorox bleach or 0.1 M FeCl3 solution. Liposomes reconstituted with 0.03–4 μg/mg CLC-ec1, and loaded with 300 mM KCl, 25 mM citrate-NaOH, pH 4.5, were extruded and centrifuged through Sephadex G-50 equilibrated in Cl− dump-buffer (CDB), 300 mM K-isethionate, 1 mM KCl, 25 mM citrate, pH 4.5. The sample containing 1.2 mg lipid was added, and KCl efflux was evoked by Vln/FCCP. After 1–3 min, 50 mM octylglucoside detergent was added to release all trapped Cl−. The electrode voltage signal, V(t), zeroed before initiating the efflux, was converted to the increase in Cl− concentration, Δc(t), above the initial concentration c(0) by:
 |
and α, an electrode-imperfection factor (of unknown origin) determined by calibrating with 75 μM Cl− at the beginning of each experiment, falls in the range 0.93 ± 0.03. This time course was fit to a two-component relaxation, one for the fraction (1 − fo) of liposomes containing transporters, the other for the fraction (fo) devoid of protein:
 |
where ΔcT, the total concentration of Cl− released in the experiment (determined directly by detergent addition), typically reflects an increase of 0.15–0.2 mM over the 1 mM Cl− present before the efflux. Here, kt and kL are the rate constants for Cl− flux through the transporter and for the background leak through the liposome membrane, respectively. This background leak was measured in separate experiments on protein-free liposomes to be 5.7 ± 0.5 × 10⁻⁴ s−1, typically 50-fold lower than the transporter-mediated rate constant. For reasons explained in the text, we report the inverse of kt as the useful transporter-mediated kinetic parameter, denoted the “average time constant,” 〈τ〉. Experiments were temperature controlled at 25°C.
Electron Microscopy
Liposomes (5 mg/ml) reconstituted with wild-type transporter were applied in 3-μl drops to glow-discharged Quantifoil holy grids. These were blotted with filter paper, plunged into liquid ethane, and transferred at liquid nitrogen temperature to the cold stage of a Phillips CM12 electron microscope. Images were taken at 120 kV under low-dose conditions (<20 electrons/Å2), at nominal magnification of 39,000. Only liposomes observed near the edges of the hole in the carbon film were used for measuring the size distribution, since in this region, the thickness of the ice film is much thicker than the liposome radii. The radius of the holes in the carbon film, 600 nm, served as an internal size calibration.
RESULTS
Substitutions at Y445 Lead to Uncoupling
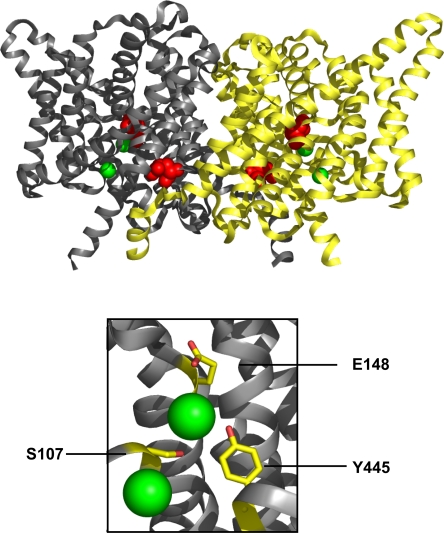
The crystal structure of CLC-ec1 (Fig. 1) displays three features intimating that Y445 might directly participate in the Cl−/H+ exchange mechanism. First, this residue's phenolic hydroxyl group coordinates the dehydrated central Cl− ion, one of the Cl− ions that delineate the anion transport “pathway” in each subunit of the homodimeric protein. Second, the Y445 side chain, along with that of S107, forms a constriction that isolates this occluded Cl− ion from the intracellular solution. Third, this side chain sits close to the intersection of the Cl− and H+ transport pathways (Accardi et al., 2005), halfway between the two water-exposed H+-transferring glutamates, as depicted in Fig. 1. For these reasons, Y445 stands out as a residue worth examining, and indeed, we recently described several substitutions at Y445 that uncouple Cl− transport to various extents (Accardi et al., 2006). While large aromatic substitutions (F, W) were found to lower the H+-to-Cl− transport ratio only slightly, substitutions by A, E, and H decrease it drastically, and introduction of L here produces intermediate behavior. We also showed that uncoupled Y445 mutants destabilize binding of Br−, a faithful Cl− substitute, in the anion conduction pathway. These structural and functional results suggest that this residue is likely to participate in the coordinated movement of Cl− and H+.
Figure 1.
Structure of CLC-ec1. The homodimeric protein, with each subunit in its own color, is shown viewed from the membrane, extracellular side up. Bound Cl− ions are green spheres, and the extracellular and intracellular proton-transfer glutamates are space filled in red. Blowup of boxed region is shown below, with crucial residues in the Cl− pathway indicated.
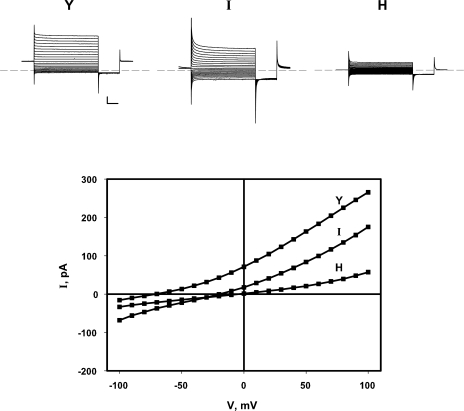
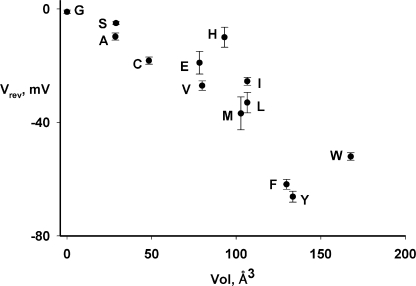
We now expand these initial observations by examining additional substitutions at Y445. Coupling in each mutant is gauged electrophysiologically in planar lipid bilayers reconstituted with purified transporter. With symmetrical Cl− and a 4-unit pH gradient, the position of the current–voltage (I-V) curve along the voltage axis, given by the reversal potential (Vrev), directly reflects the H+/Cl− transport ratio. Fig. 2 illustrates I-V relations representing the three functional classes of 445 variants: well-coupled, moderately uncoupled, and severely uncoupled. Wild-type protein reverses near −70 mV, reflecting a strict, stoichiometric H+/Cl− transport ratio of 0.5 (Accardi and Miller, 2004; Nguitragool and Miller, 2006), and the well-coupled mutants Y445F and Y445W reverse slightly below this value (Accardi et al., 2006). In contrast, Y445H is severely uncoupled, showing almost no voltage shift with a pH gradient, and moderately uncoupled mutants such as Y445I reverse at voltages roughly halfway between these extremes (Fig. 2). Fig. 3 summarizes reversal potentials for the full panel of Y445 variants and shows the impressive correlation of this coupling parameter with side chain volume. Small or charged side chains (G, A, S, C, E, and H), lead to severe uncoupling, while the larger alkyl side chains V, I, and M recapitulate the moderate phenotype previously described for L. Substitutions with K and Q failed to produce functional protein.
Figure 2.
pH-induced reversal potential shifts for Y445 variants. Currents arising from CLC-ec1 variants with the indicated amino acid at position 445 were measured in planar bilayers in the presence of a 4-unit pH gradient (pH 3/pH 7). Top panels, voltage pulses from a holding voltage of zero to command voltages of −100 to +100 mV were applied for 3 s, followed by a 1-s tail pulse to −100 mV. Scale bars represent 50 pA, 500 ms. Bottom panel, I-V curves derived from these traces.
Figure 3.
Correlation of H+/Cl− coupling ratio with side chain volume. Reversal potential Vrev produced by a 4-unit pH gradient at symmetrical 300 mM Cl− is plotted against the volume of the side chain (Zamyatin, 1972) at position 445 (mean ± SEM of three to five measurements in separate bilayers).
H+ Pumping and Cl− Slippage Monitored by H+ Flux in Liposomes
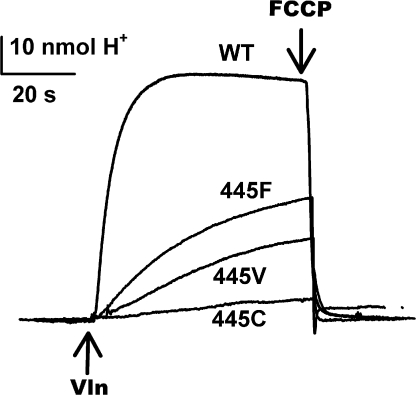
Despite their lowered transport ratios, the Y445 mutants, even the weakly coupled ones, are still able to pump protons uphill at the expense of a Cl− gradient. This function is assayed (Fig. 4) by suspending liposomes loaded with high Cl− in low-Cl− solution (with symmetrical K+), and continuously monitoring the pH of the suspension (Fig. 4). Initially, no proton influx occurs because electrogenic exchange polarizes the membrane (inside positive), thereby self-inhibiting transport; addition of the K+ ionophore Vln relieves this electrical brake by dissipating the membrane potential and allowing K+ to compensate for H+ and Cl− movements. As downhill Cl− efflux proceeds, coupled uphill H+ influx is detected as a rise in pH of the liposome suspension, an effect that is reversed by proton ionophores. Fig. 4 compares such proton-pumping traces for wild-type protein and three illustrative mutants. Proton uptake by the wild-type transporter represents pumping against an ∼2-unit pH gradient (Accardi and Miller, 2004), and similar behavior of lower amplitude and slower rate is observed with the well-coupled mutant Y445F. As expected from the impaired coupling seen electrophysiologically, Y445C shows little proton uptake; pumping is also seen with three other poorly coupled mutants, Y445H, A, and G, the last of these being the weakest (unpublished data). Y445V, which is moderately uncoupled, exhibits intermediate behavior, as we have observed for three other such mutants, Y445L, M, and I (unpublished data). In summary, the Y445 mutants, like the wild-type protein, function as Cl−/H+ exchangers, with the strength of uphill proton pumping roughly paralleling the H+/Cl− transport ratio.
Figure 4.
Cl−-driven H+ pumping by Y445 mutants. Proton uptake against a pH gradient, driven by outwardly directed Cl− gradient was assayed in liposomes reconstituted with the indicated CLC-ec1 variants. Traces of external pH are shown. Uptake was initiated by Vln addition and reversed by FCCP.
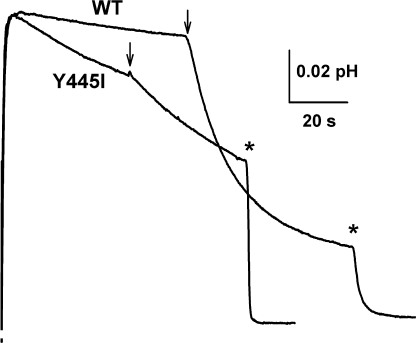
What is the nature of transport remaining in the moderately uncoupled mutants? Does it represent strict, tightly coupled exchange of hypertrophied stoichiometry (6–8 Cl− per H+), or normal two-for-one exchange in parallel with a Cl− “leak” of some sort? We approach this question by examining a novel feature of H+ transport that appears in the partly uncoupled mutants but is absent in the fully coupled wild-type transporter: Vln-independent H+ permeability. In these experiments, which compare wild type and Y445I (Fig. 5), liposomes loaded with 300 mM KCl, pH 4.5, are suspended in symmetrical pH and KCl concentration. The external pH is abruptly raised to set up a large outwardly directed proton gradient, and the ensuing H+ efflux is followed. With wild-type protein, a slight acidification of the suspension due to background H+ leak is observed as previously described (Nguitragool and Miller, 2006); transporter-mediated H+ release proceeds only after Vln is added to compensate charge and set the membrane potential to zero. In contrast, with Y445I, H+ efflux proceeds as soon as the pH gradient is applied, without the need for Vln, at a rate 8– 10-fold faster than the background leak seen for wild type, which is similar to that for protein-free liposomes (unpublished data). In the presence of Vln, H+ efflux for the mutant is substantially slower than for wild type, as might be expected from the impaired coupling of the mutant. These results imply that the mutant protein itself contains a conductive leak that compensates the charge imbalance of H+/Cl− exchange. What ion is responsible for this leak? The reduced, reconstituted system used here offers only two possibilities: Cl− or K+. A leak of either of these ions, Cl− outward or K+ inward, would permit H+ efflux via electrogenic H+/Cl− exchange. But K+ is not the culprit, since uncoupling mutations shift the transporter reversal potential toward ECl, the Nernst potential for Cl−, and away from EK (Accardi and Miller, 2004; Accardi et al., 2005, 2006). We infer, then, that Y445I mediates two kinds of Cl− transport: stoichiometric exchange with H+, which reveals itself in Cl− gradient–driven H+ pumping, and a conductive Cl− leak that permits H+/Cl− exchange without Vln and accounts for the reduced H+/Cl− transport ratio observed electrophysiologically. Y445I is used for these experiments because its moderate degree of uncoupling supports enough proton transport to produce observable pH signals; we suppose that a similar Cl− leak accounts for uncoupling of the other Y445 mutants, although we cannot test this directly with the severely uncoupled mutants, which move H+ so poorly.
Figure 5.
Conductive leak in a partially uncoupled mutant. Liposomes reconstituted with WT or Y445I were suspended in 300 mM KCl solution at pH 4.5. Proton efflux was initiated by raising pH to 6.5, and pH of the suspension was monitored. Valinomycin was added at arrows and FCCP at asterisks. Downward deflection indicates acidification of the suspension.
Unitary Turnover Rate for Cl− Transport
Do the uncoupling mutations reduce H+ or increase Cl− movement? Distinguishing these possibilities requires knowledge of absolute unitary Cl− transport rates, which are currently unknown. Our previous best efforts with wild-type protein yielded an estimated upper limit on turnover of ∼105 ions/s at 100 mV, via an electrophysiological method known to be sample biased toward large values (Accardi et al., 2004). The profusion of uncoupled mutants here motivates an improvement of the unitary turnover measurement. We describe two such measurements on wild-type CLC-ec1 and apply them to the uncoupled mutants.
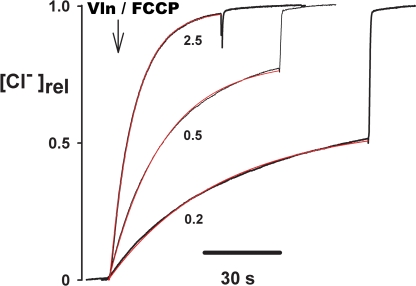
The basic “Cl− dump” experiment, from which both measurements emerge, is simple in outline. Reconstituted liposomes are formed at low protein/lipid ratios, so that the number of protein molecules roughly matches the number of liposomes in the system; under these conditions, most of the transport-active liposomes will contain only a small number of transporters, and the remaining liposomes will be devoid of protein. The liposomes are loaded with 300 mM KCl and diluted into 300 mM K-isethionate/1 mM KCl. Valinomycin is added to initiate KCl efflux such that Cl− transport through the exchanger is rate limiting; a proton ionophore is also added to prevent buildup of pH gradients, and the external Cl− concentration is continuously recorded with a Cl− electrode (Fig. 6). Cl− promptly appears in the external solution, reflecting efflux from liposomes containing transporters, and detergent releases Cl− from all liposomes, including those without protein. As protein density p is systematically raised, Cl− efflux from the protein-containing liposomes speeds up, and the fraction fo of Cl− trapped in the protein-free liposomes decreases. We use these Cl− efflux time courses to calculate unitary turnover rate in two independent ways: the “initial velocity” and “Poisson” methods.
Figure 6.
The “Cl−-dump” experiment: raw traces. Liposomes reconstituted with CLC-ec1 at the indicated protein density (μg/mg) and loaded with 300 mM Cl− were suspended in 1 mM Cl− medium, and external Cl− concentration was monitored. Efflux was initiated by addition of Vln + FCCP . After most of the transporting liposomes had dumped their Cl−, detergent was added to release Cl− from the entire population of liposomes. Released Cl− is shown normalized to the fully dumped value. Experimental time courses (black traces) are fit with exponentials (red) as described in Materials and methods.
1. Initial-Velocity Analysis
This enzymologically conventional method measures the initial velocity of Cl− appearance, v, (mol Cl−/s) as a function of protein density (Fig. 7 A); as expected, transport increases linearly with protein, the slope determining the unitary turnover rate γ0 (ions/s):
 |
(1) |
where MP is the transporter molecular weight (102,000 D) and L is the mass of lipid in the sample (1.2 mg). The unitary rate calculated by this method on the 30 datasets of Fig. 7 A gives γ0 = 4,060 ± 100 ions/s, squarely within a range expected for transporters, and ∼20-fold lower than the upper limit previously estimated (Accardi et al., 2004). But this calculation is potentially flawed, as it relies on an untested assumption, that all the protein added to the detergent–lipid reconstitution mix ends up in the resulting liposomes as fully functional transporters; this analysis therefore produces a lower limit on the true turnover rate. Previous work argues that most of the protein is indeed active under these conditions (Maduke et al., 1999), but we consider this assumption shaky enough to warrant corroboration. For this reason, we introduce an alternative assay that does not rely on knowledge of the fraction of functionally competent protein in the preparation.
Figure 7.
Kinetics of Cl− transport by CLC-ec1 Cl−-dump experiments as in Fig 6 were analyzed in two different ways. (A) Initial-velocity method. Initial rate of Cl− efflux was determined as a function of protein density p in the reconstitution mix. These experiments employed protein densities <0.5 μg/mg, where the plot is linear and initial rates can be measured accurately. Each point represents a single time course. The regression line represents a unitary turnover rate of 4,060 s−1. (B) Poisson method. The "average time constant" 〈τ〉 for CLC-mediated Cl− transport was measured by fitting Cl− efflux traces at the indicated protein densities. Each point represents three to four measurements. Solid curve is fit to the data according to Eq. 7, using nine terms in the infinite sum. The fit value of the 〈τ〉 intercept τ* is 54.3 s, and of p0, which gives the initial slope of the curve, is 0.19 μg/mg.
2. Poisson Analysis
This method seeks to measure the “unitary time constant” τ* of Cl− efflux from a population of liposomes containing only a single transporter. Assuming that the liposomes are all spherical with radius r, the unitary turnover rate γo is related to the unitary time constant by:
 |
(2) |
where c0 is the Cl− concentration (ions/cm3) inside the liposomes at the beginning of the efflux. Experimentally, however, we have no way of preparing a uniform population of liposomes each containing only a single transporter. Instead, we must confront the inescapable inhomogeneity of the system, wherein some liposomes carry no protein, some a single transporter, some two such molecules, etc. If we assume that the reconstitution process randomly inserts proteins into liposomes of uniform size, then the fraction of liposomes, fi, containing i transporters follows Poisson statistics:
 |
(3) |
where μ = Np/NL, and Np and NL represent the number of active protein molecules and liposomes in the sample. Thus, Cl− flux should follow a multiexponential normalized relaxation R(t) in which the individual kinetic components represent these liposome subpopulations:
 |
(4) |
This relaxation is given in terms of the experimentally measured time-dependent change in external Cl− concentration, Δc(t), above its initial value of ∼1 mM. The sum explicitly excludes the protein-free liposomes, since these do not participate in the fast phase of Cl− release (see Materials and methods).
A useful kinetic metric for a multiexponential relaxation (for which a single time constant is meaningless) is its total area, which, thanks to a felicitous property of the exponential function, takes the form of an “average time constant” 〈τ〉:
 |
(5) |
Moreover, since the efflux rate from a given liposome is proportional to the number of transporters in it, the individual time constants τi are all given in terms of the unitary time constant τ*:
 |
(6) |
Thus, the relation between the efflux time course and the protein/lipid ratio depends on only a single kinetic parameter τ*, indeed, the very parameter needed, Eq. 2, to calculate the unitary turnover rate:
 |
(7) |
Although 〈τ〉 is defined as the area under the efflux time course, it can be measured more simply than by integration. It turns out that a Poisson-weighted multiexponential relaxation is approximated well by a single exponential, as has been noted in various experimental contexts (Apell and Läuger, 1986; Barzykin and Lednev, 1993; MacKinnon et al., 1993). Therefore, 〈τ〉 is reliably estimated (within 5% error, as shown by simulation) by the time constant of a single-exponential fit to the Cl− efflux data.
Intuition expects and Eq. 7 demands that 〈τ〉 must fall as protein density is increased in the reconstituted liposomes. The infinite sum cannot be recast in familiar analytic functions, but it is easy to calculate directly since it quickly converges for values of μ used here, typically after nine terms. Thus, Eq. 7 predicts how the measured efflux time constant should vary with protein density (Fig. 7 B). This variation determines τ*, the limit of 〈τ〉 as protein density approaches zero, where only a small fraction of the liposomes carry protein, and most of those carry only a single copy. Since τ* is merely the zero-protein intercept of the 〈τ〉 vs. p plot, its value does not rely on knowing the fraction of protein that is functional, as the Poisson parameter μ is simply proportional to total protein density p,
 |
(8) |
and NA is Avogadro's number, φ the (unknown) fraction of active protein, and λ the (unknown) number of liposomes per mass of lipid. The value of τ* derived from this analysis is 54 s (Fig. 7 B).
Before proceeding, we pause to consider whether this Poisson model validly represents our experimental system. The treatment makes two readily testable predictions involving the measurables fo and 〈τ〉. First, the fraction of liposomes containing no protein, f0, should fall exponentially with increasing protein density, Eqs. 3 and 8. Second, f0 and 〈τ〉 must covary with protein in a required way, as may be seen from the Taylor expansions around p = 0 for these two quantities, Eqs. 3 and 7:
 |
(9a) |
 |
(9b) |
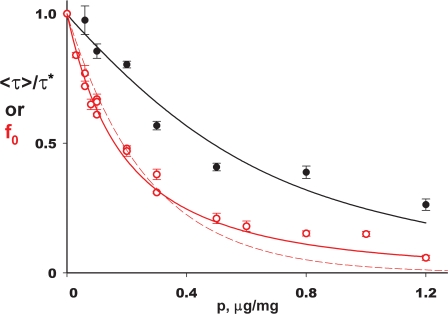
Thus, as fo and 〈τ〉/τ* decrease with increasing protein density, the initial slope of the former should be fourfold steeper than that of the latter. Both of these predictions are straightforward, parameter-independent demands of this simple picture, and both are in distressing conflict with the experimental results of Fig. 8. The first problem is obvious from the dependence of f0 on p, which departs systematically from a single-exponential function (dashed curve). Second, the initial slopes of the two plots differ by a factor of ∼3 (2.8 ± 0.6, extreme range of possible slope ratios), significantly less than the fourfold relation required by Eq. 9. These are serious quantitative discrepancies which would, unless explained, invalidate this avenue toward estimating the transporter's unitary turnover rate.
Figure 8.
Covariation of Poisson transport parameters. Average time constant 〈τ〉 normalized to its zero-protein value τ* (black points) and f0 (red points) are plotted against protein density. Solid black curve for time constant is according to Eq. 7. Curves (red) fit to f0 data are single exponential (dashed), Eq. 9a, or expanded theory (solid) accounting for heterogeneity in liposome radius, Eq. 10.
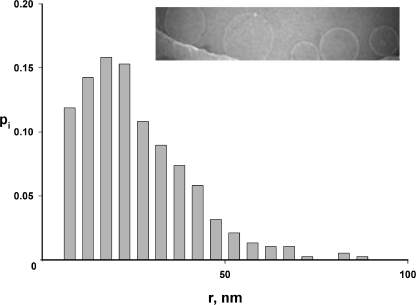
A glaring flaw here is the assumption that the liposomes are homogeneous in size. The invalidity of this assumption is apparent from examination of reconstituted liposome samples by cryoelectron microscopy. Fig. 9 shows an image of liposomes embedded in vitreous ice, along with a size histogram derived from such images (a full dataset is reported in Table A1). The liposomes are spherical, but their size distribution is quite wide, with standard deviation (29 nm) about equal to the mean radius (26 nm). Accordingly, we expanded the theory above by abandoning the assumption of size homogeneity and explicitly using the measured radius distribution, ρ(r), to produce a more realistic set of predictions. Details of this treatment are given in the Appendix, and we state only the key results here. First, the protein dependence of f0 is no longer expected to be single exponential, but rather is given by combining Eqs. A9b and A2:
 |
(10) |
 |
σ is the membrane area per lipid mass and φ the fraction of active protein as above. This function, shown in Fig. 8 (solid curve), fits the experimental data extremely well with a single adjustable parameter. Moreover, the initial slopes of the f0 and 〈τ〉/τ* plots are now predicted to differ by a factor of ∼2 instead of 4, in reasonable agreement with observation.
Figure 9.
Liposome size distribution. Liposomes were examined by cryoelectron microscopy to determine the population's size distribution. Liposomes near the edge of the hole in the carbon film are shown, along with a histogram of radii, pi, calculated from ∼400 measurements.
These satisfying correspondences between theory and experiment provide a solid basis for using this approach for its intended purpose: to calculate the unitary turnover rate from the value of τ*. To do this, we must again take the liposome size distribution into account instead of merely applying Eq. 1, which assumes uniform liposomes. An expression, Eq. A12, analogous to Eq. 2, relates τ* to the unitary turnover rate in terms of higher moments of the radius distribution:
 |
(11) |
With a measured unitary time constant of 54 s, this relation produces a unitary turnover rate of 4300 ions/s, in excellent agreement with the initial-velocity estimate above. This agreement also confirms that virtually all the protein in the preparation is functional. We note that this rate is measured at 300 mM Cl−, zero voltage, 25°C, pH 4.5, where the transporter's pH rate profile is maximal (Iyer et al., 2002; Accardi et al., 2004), and under conditions approximating “zero trans” unidirectional net flux. This calculation refers to the homodimeric protein; if each subunit operates independently as an exchanger—an experimentally unsupported idea based solely on analogy to fast gating in the CLC channel subfamily (Middleton et al., 1994; Miller, 2006)—the turnover rate per subunit would be half of the above value, ∼2,100 s−1. We should also note that a large error in the estimation of turnover rate arises if liposome size heterogeneity is not considered, by using the mean liposome radius in Eq. 2; in this case, the calculated value of γ0 would be roughly eightfold lower than the correct value, Eq. 11, and indeed than the initial-velocity estimate, Eq. 1, which itself is a lower limit.
Unitary Turnover Rates of Uncoupled Mutants
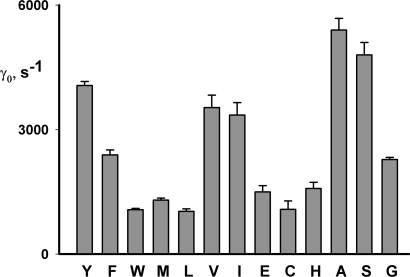
We are finally in position to address the question originally motivating this analysis: how the absolute rate of Cl− transport is altered in the uncoupled Y445 mutants. To do this, we need not subject each mutant to a full Poisson analysis, but rather have only to apply initial-velocity analysis, which is now validated by the results above. Efflux measurements were accordingly made on the Y445 mutants reconstituted at two protein densities each, and unitary turnover rates are displayed in Fig. 10, in order of tightness of coupling. This survey shows that all the Y445 variants have unitary rates in the same order of magnitude, ranging from 25–130% of the wild-type value, and that turnover rate does not correlate with the coupling ratios. For instance, Y445A and Y445H, mutants with high and low rates, respectively, are both severely uncoupled, the well-coupled Y445W and partially coupled Y445L have the lowest rates, and the rate of the completely uncoupled Y445G is close to that of the well-coupled Y445F.
Figure 10.
Unitary turnover rates for 445 variants. Unitary turnover rates, γ0, were measured for the Y445 substitutions indicated, by the initial-velocity method. Each bar represents mean ± SEM of three to six independent determinations. The 445 substitutions are arranged from left to right in order of the H+/Cl− transport ratio, Y being the most coupled, and G the least.
DISCUSSION
The realization that the CLC proteins are subdivided into H+-gated Cl− channels and H+-driven Cl− pumps raises the question of how such fundamentally dissimilar mechanisms of transmembrane Cl− movement can be supported by a single molecular family. It has long been known that the channels display hints of transporter-like behavior (Richard and Miller, 1990; Pusch et al., 1995; Chen and Miller, 1996; Maduke et al., 2000), a feature that now, in light of the CLC family's androgynous character, is not so perplexing as it once was. Conversely, recent structure–function analysis of CLC-ec1 suggested that this tightly coupled Cl−/H+ exchanger displays channel-like characteristics (Accardi et al., 2005, 2006; Miller, 2006; Nguitragool and Miller, 2006). In particular, instead of localized substrate binding sites that simply switch exposure to the two sides of the membrane, as in alternating access schemes of coupled transport (Lemieux et al., 2004), CLC-ec1 appears to offer transmembrane “pathways” along which Cl− and H+ diffuse, albeit in a coordinated and still unknown way.
In examining the transport mechanism informed by the crystal structure, we previously described two glutamate residues located near the extracellular and intracellular surfaces, mutations of which wholly extinguish H+ movement but retain Cl− transport (Accardi and Miller, 2004; Accardi et al., 2005). The carboxyl groups of these residues appear to transfer protons between the protein interior and the aqueous solutions, i.e., to deliver protons to and remove them from the coupling machinery. We do not know the specific pathway along which protons move between these two glutamates, but positioned halfway between them at the center of the membrane is Y445, which directly coordinates the dehydrated central Cl− ion (Fig. 1) and lies near the proposed bifurcation point of the Cl− and H+ pathways. The prominent position of this tyrosine residue, along with our earlier finding (Accardi et al., 2006) that several mutations here affect the H+/Cl− transport ratio, makes it an obvious focus for deeper study.
We find that mutations at Y445 produce variable uncoupling, such that the H+/Cl− transport ratio roughly correlates with the volume of the substituted side chain. In none of these mutants is proton transport lost completely; even the severely uncoupled variants show a small amount of Cl−-driven proton pumping. Thus, the basic H+/Cl− exchange mechanism still operates in the mutants but appears to be overwhelmed by variable degrees of Cl− “slippage”; this conclusion is illustrated directly by the Cl− leak dwelling within the partially uncoupled mutant Y445I (Fig. 5). Earlier crystallographic work established that point mutations at Y445 do not perturb the overall structure of CLC-ec1 (Lobet and Dutzler, 2005; Accardi et al., 2006), so we can be reasonably confident that these effects of mutagenesis reflect specific disruption of the proton transport mechanism and its linkage to Cl− movement.
It is natural to imagine that mutations of a tightly coupled exchanger that impair movement of one substrate, H+, would also retard the other, Cl−. But in view of the dual nature of the CLC family, a contrary picture is also easy to envision, that the uncoupled mutants might render the transporter more “channel like” in its behavior. In the former case, the absolute Cl− transport rate would decrease upon mutation, while in the latter it might be expected to rise. But the unitary turnover rates of variously uncoupled mutants confirm neither of these expectations. The Cl− transport rate is neither greatly diminished nor greatly increased by the uncoupling mutations. Instead, all of the mutants transport Cl− at rates in the wild-type range, from fourfold lower to 30% larger.
Wild-type protein strictly couples H+ and Cl− movements with no discernable Cl− slippage (Nguitragool and Miller, 2006). The lowered transport ratios of the uncoupled mutants show that exchange slows substantially as the tyrosine side chain is altered; but despite this slowing of H+ movement, Cl− somehow manages to slip through the uncoupled protein at respectable rates. We do not have a picture of this Cl− slippage, but two possibilities come to mind. A “uniport” model would envision the same cycle of conformational changes that couples H+ and Cl− to carry Cl− alone across the membrane, at roughly the same rate. In contrast, an “incipient channel” model would view the protein stuck at a point in the exchange cycle, waiting for a tardy proton; while thus stalled, the normally closed Cl− pathway would fluctuate open wide enough to allow anions to squeak through diffusively, albeit at rates several orders of magnitude below the high rates typical of ion channels, until protonation occurs and the normal exchange cycle resumes. This picture, in distinction from the uniport model, would view the rough equality of leakage and coupled Cl− flux rates as purely coincidental.
Our results do not distinguish these alternatives, but they show that the exchange mechanism, whatever its nature, has an inherent tendency toward uncoupling, a tendency that a tyrosine at the crucial 445 position completely suppresses. That is an intriguing inference reminiscent of the puzzling uncoupled ion conductances embedded within a variety of ion-coupled transporters for glutamate, serotonin, dopamine, and other neurotransmitters (Kanner and Borre, 2002). The origins, mechanisms, and biological functions of these pump-dwelling leaks are obscure, but they appear to be intrinsic features of these transporters. We have no evidence linking them to the Cl− leak uncovered here in the CLC exchanger, but the analogy is nonetheless striking. A more detailed understanding of the CLC exchange mechanism may therefore have relevance beyond this family of Cl−-transporting proteins.
We recognize that our results may confuse more than clarify the role of Y445 in CLC proteins. At first glance, this tyrosine seems a natural candidate to mediate Cl−/H+ exchange in the transporters and Cl− permeation in the channels. Its hydroxyl group, a potential H+ transfer catalyst, directly coordinates a Cl− ion in the crystal structure of CLC-ec1, near in the center of the protein where the Cl− and H+ pathways appear to intersect. Moreover, the side chain contributes to a constriction occluding cytoplasmic access to the Cl−-binding region, although there is no direct evidence that this represents an inner “gate.” The strong conservation of this tyrosine across both CLC subclasses is sensible as well, as both use protons to move Cl−, the transporters via direct exchange, the channels via a gating mechanism thought to involve transmembrane H+ movement (Miller, 2006; Traverso et al., 2006). But this coherent picture is muddied by experimental facts. Removal of the tyrosine hydroxyl group has only minor effects on Cl− permeation in the channels (Accardi and Pusch., 2003; Chen and Chen, 2003), or on H+/Cl− coupling in the exchanger studied here. The side chain at position 445 strongly influences the rate of both stoichiometric H+/Cl− exchange and Cl− slippage, but we have no satisfactory explanation for the striking absence of correlation between coupling ratio and absolute turnover rate. Furthermore, the side chain chemistry that determines H+ coupling is unclear; larger side chains tend to show tighter coupling, regardless of H+ transfer capability, but this correspondence is not mechanistically enlightening, since other chemical factors, such as aromaticity or hydrophobicity, roughly covary with side chain volume.
But perhaps confusion about the exchange transport mechanism should not be so surprising. The dual nature of the CLC proteins was only recently recognized (Accardi and Miller, 2004), and mechanistic studies in light of this realization are still in an early stage. The crystal structures of this CLC transporter and its mutants are of only two conformations, occluded and extracellular open, while other, as yet unseen, conformations must be involved in a full transport cycle (and no structures of the channel subclass are known). Finally, the extant CLC crystal structures are too low in resolution to see water molecules, which are very likely to be involved in H+ coupling. This is a deficiency because side chain substitutions will inevitably lead to subtle changes in hydration of the ion-binding region, which could lead to large changes in H+ coupling and Cl− slippage. Future structures of improved resolution may help resolve the questions opened up by the results presented here.
Acknowledgments
We thank Wang Nguitragool for unrelenting advice, Joe Mindell for picking nits from the manuscript, and Nikolaus Grigorieff for use of the Brandeis cryo-em facility.
This work was supported by National Institutes of Health grant RO1-31768.
David C. Gadsby served as editor.
APPENDIX
Poisson Treatment for Nonuniform-Radius Liposomes
We want to calculate the unitary turnover rate γo from the Cl− efflux time constant in the limit of low protein, without assuming size-homogeneity of the liposomes. We start by considering two classes of spherical liposome, of radius r1 and r2 with NL1, NL2 liposomes in each class. The system consists of a fixed mass of lipid with total area A, and a total number of protein molecules Np reconstituted randomly into the liposomes.
We first consider the class-1 liposomes only and proceed with Poisson analysis for this homogeneous-radius population. For these liposomes, the Poisson parameter is μ1 = Np1/NL1, where Np1 is the number of protein molecules associated with the NL1 liposomes. The probability of a given protein residing in a given liposome is proportional to membrane area of that liposome,
 |
(A1) |
and so the Poisson parameter for the class-1 liposomes is
 |
(A2) |
The fraction of class-1 liposomes containing i protein molecules, f1i, is Poisson distributed:
 |
(A3) |
The treatment in the main text gives the average time constant for these liposomes only:
 |
(A4) |
where τ1(μ1) = average time constant for the class-1 liposomes, a function of μ1, τ1* = unitary time constant (low-protein limit) for the class-1 liposomes.
Notice that we have changed notation slightly from that used in the main text. The subscript “1” refers to the class-1 liposomes, and the “averaging” brackets are removed; but don't forget that τ1(μ1) still represents an average over all the liposomes in class-1. Then, in the low-protein limit,
 |
(A5) |
Everything above follows exactly the same treatment as for homogeneous liposomes, because the class-1 liposomes are by assumption uniform in size. An identical treatment applies to the class-2 liposomes, where μ2 = 4πr2 2Np/A, etc.
Now consider the physical situation in the Cl− efflux assay. A key feature, not present in the treatment for uniform liposomes, is that the two liposome classes contribute to the kinetic time course unequally, for two reasons. First, each liposome releases Cl− ions proportionally to its volume. Second, as stated in Eq. A2, the probability of a liposome containing a protein molecule is proportional to the area of the liposome, so a given protein molecule is more likely to end up in a large liposome than in a small one. This double- whammy weights the Cl− efflux kinetics heavily toward the larger liposomes.
TABLE AI.
Radius Distribution of Proteoliposomes
| Bin range, nm | N | p(r) | rp(r), nm | r2p(r), nm2 | r3p(r), nm3 | r5p(r), nm5 | r6p(r), nm6 | r8p(r), nm8 |
|---|---|---|---|---|---|---|---|---|
| 5–10 | 45 | 0.119 | 0.89 | 6.7 | 5.01E+01 | 2.82E+03 | 2.11E+04 | 1.19E+06 |
| 10–15 | 54 | 0.142 | 1.78 | 22.3 | 2.78E+02 | 4.35E+04 | 5.44E+05 | 8.49E+07 |
| 15–20 | 60 | 0.158 | 2.77 | 48.5 | 8.48E+02 | 2.60E+05 | 4.55E+06 | 1.39E+09 |
| 20–25 | 58 | 0.153 | 3.44 | 77.5 | 1.74E+03 | 8.82E+05 | 1.99E+07 | 1.01E+10 |
| 25–30 | 41 | 0.108 | 2.97 | 81.8 | 2.25E+03 | 1.70E+06 | 4.68E+07 | 3.54E+10 |
| 30–35 | 34 | 0.090 | 2.92 | 94.8 | 3.08E+03 | 3.25E+06 | 1.06E+08 | 1.12E+11 |
| 35–40 | 28 | 0.074 | 2.77 | 103.9 | 3.90E+03 | 5.48E+06 | 2.05E+08 | 2.89E+11 |
| 40–45 | 22 | 0.058 | 2.47 | 104.8 | 4.46E+03 | 8.05E+06 | 3.42E+08 | 6.18E+11 |
| 45–50 | 12 | 0.032 | 1.50 | 71.4 | 3.39E+03 | 7.66E+06 | 3.64E+08 | 8.21E+11 |
| 50–55 | 8 | 0.021 | 1.11 | 58.2 | 3.05E+03 | 8.42E+06 | 4.42E+08 | 1.22E+12 |
| 55–60 | 5 | 0.013 | 0.76 | 43.6 | 2.51E+03 | 8.29E+06 | 4.77E+08 | 1.58E+12 |
| 60–65 | 4 | 0.011 | 0.66 | 41.2 | 2.58E+03 | 1.01E+07 | 6.29E+08 | 2.46E+12 |
| 65–70 | 4 | 0.011 | 0.71 | 48.1 | 3.25E+03 | 1.48E+07 | 9.98E+08 | 4.55E+12 |
| 70–75 | 1 | 0.003 | 0.19 | 13.9 | 1.01E+03 | 5.29E+06 | 3.83E+08 | 2.01E+12 |
| 75–80 | 0 | 0.000 | 0.00 | 0.0 | 0.00E+00 | 0.00E+00 | 0.00E+00 | 0.00E+00 |
| 80–85 | 2 | 0.005 | 0.44 | 35.9 | 2.96E+03 | 2.02E+07 | 1.66E+09 | 1.13E+13 |
| 85–90 | 1 | 0.003 | 0.23 | 20.2 | 1.77E+03 | 1.35E+07 | 1.18E+09 | 9.07E+12 |
| SUMS: | 379 | 1.000 | 25.61 | 872.7 | 3.71E+04 | 1.08E+08 | 6.87E+09 | 3.41E+13 |
| 〈r〉 | 〈r2〉 | 〈r3〉 | 〈r5〉 | 〈r6〉 | 〈r8〉 |
The efflux from this two-component liposome population is given by a double-exponential normalized relaxation R(t):
 |
(A6a) |
The integral of this relaxation represents a new kind of “average time constant,” with the brackets representing averaging over the two liposome classes:
 |
(A6b) |
(We can think of 〈τ〉 as a two-dimensional average. The τ1 and τ2 represent “vertical” averages within each liposome class, while the final 〈τ〉 averages these individual class values “horizontally” over the two classes.) The amplitude A1 reflects the amount of Cl− initially trapped in the class-1 transport-active liposomes, which is proportional to the volume entrapped by those liposomes that contain protein. This is the product of the volume of a single class-1 liposome and the number of class-1 liposomes containing protein, NL1(1 − f10). An identical argument applies to the class-2 liposomes. Thus, we arrive at expressions for both the measured time constant 〈τ〉 of the relaxation and the measured volume fraction 〈f0〉 of the protein-free liposomes:
 |
(A7a) |
 |
(A7b) |
The “grand canonical” time constant 〈τ〉 is still just the integral of the normalized efflux time course, as before. We call this integral a time constant in anticipation that the time course will look single exponential. This will be true if the two classes of liposomes are of similar radii, but not if they are very different in size. (In this latter case, the relaxation would look biexponential, but the integral would still be rigorously given by Eq. A7a; you just would call it an “area” instead of a “time constant.”) We now write Eq. A7 in a more compact form by using the radius probability distribution. Let ρk be the discrete probability distribution for liposome radius, with k = 1,2:
 |
(A8) |
Then Eq. A7 becomes
 |
(A9a) |
 |
(A9b) |
Eqs. A9a and A9b apply to any number of discrete liposome classes, and identical expressions hold for a continuous radius distribution with probability density ρ(r). We recall that μ and hence 〈τ〉 and 〈f0〉 are functions of both liposome radius and protein and that the brackets represent averages over ρ(r). In the limit of low protein, our experimental range of interest, (1 − e−μ) ≈ μ, and so
 |
(A10) |
Remember that τ*(r) denotes the unitary time constant for liposomes of a given size. Taking the limit of 〈τ〉 as protein approaches zero and inserting Eq. A2, we obtain the experimental unitary time constant 〈τ*〉:
 |
(A11) |
Finally, we relate 〈τ*〉 to the unitary turnover rate γ0 by remembering that τ*(r) is itself a function of r:
 |
(A12) |
which provides the final result:
 |
By applying a similar argument to Eqs. A9a and A9b, it is easy to show that the ratio of initial slopes of the f0 and 〈τ〉/τ1 plots is:
 |
(A13) |
≈2.0 for the radius-distribution here
Abbreviations used in this paper: Vln, valinomycin.
References
- Accardi, A., and M. Pusch. 2003. Conformational changes in the pore of CLC-0. J. Gen. Physiol. 122:277–294. [DOI] [PMC free article] [PubMed] [Google Scholar]
- Accardi, A., L. Kolmakova-Partensky, C. Williams, and C. Miller. 2004. Ionic currents mediated by a prokaryotic homologue of CLC Cl− channels. J. Gen. Physiol. 123:109–119. [DOI] [PMC free article] [PubMed] [Google Scholar]
- Accardi, A., S. Lobet, C. Williams, C. Miller, and R. Dutzler. 2006. Synergism between halide binding and proton transport CLC-type exchanger. J. Mol. Biol. 362:691–699. [DOI] [PubMed] [Google Scholar]
- Accardi, A., and C. Miller. 2004. Secondary active transport mediated by a prokaryotic homologue of ClC Cl− channels. Nature. 427:803–807. [DOI] [PubMed] [Google Scholar]
- Accardi, A., M. Walden, W. Nguitragool, H. Jayaram, C. Williams, and C. Miller. 2005. Separate ion pathways in a Cl−/H+ exchanger. J. Gen. Physiol. 126:563–570. [DOI] [PMC free article] [PubMed] [Google Scholar]
- Apell, H.J., and P. Läuger. 1986. Quantitative analysis of pump-mediated fluxes in reconstituted vesicles. Biochim. Biophys. Acta. 861:302–310. [Google Scholar]
- Barzykin, A.V., and I.K. Lednev. 1993. Fluorescence quenching kinetics in monodisperse micellar solution with exchange of probes and quenchers. J. Physiol. Chem. 97:2774–2777. [Google Scholar]
- Chen, T.-Y., and C. Miller. 1996. Nonequilibrium gating and voltage dependence of the ClC-0 Cl− channel. J. Gen. Physiol. 108:237–250. [DOI] [PMC free article] [PubMed] [Google Scholar]
- Chen, M.F., and T.Y. Chen. 2003. Side chain charge effects and conductance determinants in the pore of ClC-0 chloride channels. J. Gen. Physiol. 122:133–145. [DOI] [PMC free article] [PubMed] [Google Scholar]
- De Angeli, A., D. Monachello, G. Ephritikhine, J.M. Frachisse, S. Thomine, F. Gambale, and H. Barbier-Brygoo. 2006. AtCLCa, a proton/nitrate antiporter, mediates nitrate accumulation in plant vacuoles. Nature. 442:939–942. [DOI] [PubMed] [Google Scholar]
- Dutzler, R., E.B. Campbell, M. Cadene, B.T. Chait, and R. MacKinnon. 2002. X-ray structure of a ClC chloride channel at 3.0 A reveals the molecular basis of anion selectivity. Nature. 415:287–294. [DOI] [PubMed] [Google Scholar]
- Dutzler, R., E.B. Campbell, and R. MacKinnon. 2003. Gating the selectivity filter in ClC chloride channels. Science. 300:108–112. [DOI] [PubMed] [Google Scholar]
- Iyer, R., T.M. Iverson, A. Accardi, and C. Miller. 2002. A biological role for prokaryotic ClC chloride channels. Nature. 419:715–718. [DOI] [PubMed] [Google Scholar]
- Jentsch, T.J., I. Neagoe, and O. Scheel. 2005. a. CLC chloride channels and transporters. Curr. Opin. Neurobiol. 15:319–325. [DOI] [PubMed] [Google Scholar]
- Jentsch, T.J., M. Poet, J.C. Fuhrmann, and A.A. Zdebik. 2005. b. Physiological functions of CLC Cl− channels gleaned from human genetic disease and mouse models. Annu. Rev. Physiol. 67:779–807. [DOI] [PubMed] [Google Scholar]
- Kanner, B.I., and L. Borre. 2002. The dual-function glutamate transporters: structure and molecular characterization of the substrate-binding sites. Biochim. Biophys. Acta. 1555:92–95. [DOI] [PubMed] [Google Scholar]
- Lemieux, M.J., Y. Huang, and D.N. Wang. 2004. The structural basis of substrate translocation by the Escherichia coli glycerol-3-phosphate transporter: a member of the major facilitator superfamily. Curr. Opin. Struct. Biol. 14:405–412. [DOI] [PubMed] [Google Scholar]
- Lobet, S., and R. Dutzler. 2005. Ion binding properties of the CLC chloride selectivity filter. EMBO J. 25:24–33. [DOI] [PMC free article] [PubMed] [Google Scholar]
- MacKinnon, R., R.W. Aldrich, and A.W. Lee. 1993. Functional stoichiometry of Shaker potassium channel inactivation. Science. 262:757–759. [DOI] [PubMed] [Google Scholar]
- Maduke, M., C. Miller, and J.A. Mindell. 2000. A decade of ClC chloride channels: Structure, mechanism, and many unsettled questions. Annu. Rev. Biophys. Biomol. Struct. 29:411–438. [DOI] [PubMed] [Google Scholar]
- Maduke, M., D.J. Pheasant, and C. Miller. 1999. High-level expression, functional reconstitution, and quaternary structure of a prokaryotic ClC-type chloride channel. J. Gen. Physiol. 114:713–722. [DOI] [PMC free article] [PubMed] [Google Scholar]
- Middleton, R.E., D.J. Pheasant, and C. Miller. 1994. Purification, reconstitution, and subunit composition of a voltage-gated chloride channel from Torpedo electroplax. Biochemistry. 33:13189–13198. [DOI] [PubMed] [Google Scholar]
- Miller, C. 2006. ClC chloride channels viewed through a transporter lens. Nature. 440:484–489. [DOI] [PubMed] [Google Scholar]
- Nguitragool, W., and C. Miller. 2006. Uncoupling of a CLC Cl−/H+ exchange transporter by polyatomic anions. J. Mol. Biol. 362:682–690. [DOI] [PubMed] [Google Scholar]
- Picollo, A., and M. Pusch. 2005. Chloride/proton antiporter activity of mammalian CLC proteins ClC-4 and ClC-5. Nature. 436:420–423. [DOI] [PubMed] [Google Scholar]
- Pusch, M., U. Ludewig, A. Rehfeldt, and T.J. Jentsch. 1995. Gating of the voltage-dependent chloride channel ClC-0 by the permeant anion. Nature. 373:527–531. [DOI] [PubMed] [Google Scholar]
- Richard, E.A., and C. Miller. 1990. Steady-state coupling of ion-channel conformations to a transmembrane ion gradient. Science. 247:1208–1210. [DOI] [PubMed] [Google Scholar]
- Scheel, O., A.A. Zdebik, S. Lourdel, and T.J. Jentsch. 2005. Voltage-dependent electrogenic chloride/proton exchange by endosomal CLC proteins. Nature. 436:424–427. [DOI] [PubMed] [Google Scholar]
- Traverso, S., G. Zifarelli, R. Aiello, and M. Pusch. 2006. Proton sensing of CLC-0 mutant E166D. J. Gen. Physiol. 127:51–66. [DOI] [PMC free article] [PubMed] [Google Scholar]
- Zamyatin, A.A. 1972. Protein volume in solution. Prog. Biophys. Mol. Biol. 24:107–123. [DOI] [PubMed] [Google Scholar]


