

Abstract
A viewpoint now emerging is that a critical factor in lipid-mediated transfection (lipofection) is the structural evolution of lipoplexes upon interacting and mixing with cellular lipids. Here we report our finding that lipid mixtures mimicking biomembrane lipid compositions are superior to pure anionic liposomes in their ability to release DNA from lipoplexes (cationic lipid/DNA complexes), even though they have a much lower negative charge density (and thus lower capacity to neutralize the positive charge of the lipoplex lipids). Flow fluorometry revealed that the portion of DNA released after a 30 min incubation of the cationic O-ethylphosphatidylcholine lipoplexes with the anionic phosphatidylserine or phosphatidylglycerol was 19% and 37%, respectively, whereas a mixture mimicking biomembranes (MM: phosphatidylcholine/phosphatidylethanolamine/ phosphatidylserine/cholesterol 45:20:20:15 w/w) and polar lipid extract from bovine liver released 62% and 74%, respectively, of the DNA content. A possible reason for this superior power in releasing DNA by the natural lipid mixtures was suggested by structural experiments: while pure anionic lipids typically form lamellae, the natural lipid mixtures exhibited a surprising predilection to form nonlamellar phases. Thus, the MM mixture arranged into lamellar arrays at physiological temperature, but began to convert to the hexagonal phase at a slightly higher temperature, ∼40-45°C. A propensity to form nonlamellar phases (hexagonal, cubic, micellar) at close to physiological temperatures was also found with the lipid extracts from natural tissues (from bovine liver, brain, and heart). This result reveals that electrostatic interactions are only one of the factors involved in lipid-mediated DNA delivery. The tendency of lipid bilayers to form nonlamellar phases has been described in terms of bilayer “frustration” which imposes a nonzero intrinsic curvature of the two opposing monolayers. Because the stored curvature elastic energy in a “frustrated” bilayer seems to be comparable to the binding energy between cationic lipid and DNA, the balance between these two energies could play a significant role in the lipoplex-membrane interactions and DNA release energetics.
Keywords: lipid phase transition, surface charge, cationic lipid, DNA unbinding, transfection
1. Introduction
The major discovery in the field of biological membranes is undoubtedly the finding that their matrix represents a liquid-crystalline bilayer with embedded proteins [1]. This fluid-mosaic model has been a central paradigm of membrane biophysics for more than three decades, and it has been successful in rationalizing a large body of experimental observations. The model includes two basic postulates referring to the lipid phase state – liquid crystalline and bilayer, both of which are of vital importance for the proper functioning of membranes. The lipid-water systems are able to form a large variety of other phases as well – non-liquid crystalline (solid) and non-bilayer [2,3], but biological regulatory mechanisms work towards maintaining the membranes in their functional bilayer liquid crystalline phase. However, recent developments of the biomembrane model show that the potential ability of the lipids to form nonbilayer structures seems to be a prerequisite for important membrane-associated cell processes, and for the proper activity of variety of membrane proteins [4]. It has been demonstrated, for example, that prokaryotic organisms, A. laidlawii and E. coli, maintain a delicately adjusted balance between lamellar-forming and nonlamellar-forming lipids [5,6]. A growing amount of evidence shows that nonlamellar-forming membrane lipids play essential roles in many membrane functions [7]. Short-lived nonbilayer structures have been postulated as intermediates in the processes of fusion and fission of lipid bilayers. Moreover, long-lived bilayer structures with a small radius of curvature occur in some types of biological membranes (e.g. endoplasmic reticulum, inner mitochondrial membrane, prolamellar bodies). Thus, the study of the role played by membrane lipids--functional lipidomics--is becoming increasingly important in membrane biology.
Here we demonstrate that lipid extracts from mammalian tissues and membrane-mimicking lipid mixtures exhibit strong predilections to form nonlamellar phases at close to physiological conditions. These experiments were motivated by the finding that lipids in the form of tissue extracts and membrane mimicking mixtures exhibit greater potency to release DNA from lipoplexes (cationic lipid/DNA complexes) than do pure anionic liposomes, in spite of the lower negative charge density of the mixtures (and thus lower capacity to neutralize the positive charge of the cationic lipids). The synthetic cationic lipids that generate lipoplexes by complexing with polyanionic DNA are promising gene carriers that have been studied extensively [8]. The unbinding of DNA from these cationic carriers after internalization is necessary for transfection, and is currently considered to be the result of charge neutralization by cellular anionic lipids [9,10]; however, our results reveal additional critical factors besides electrostatic interactions in the molecular machinery of lipid-mediated DNA delivery. Present study reflects the lipid eye view to the membrane-lipoplex interactions. Biomembrane biophysical properties can change significantly when proteins are present, possibly influencing also transfection, but evaluating the role of proteins is beyond the scope of this paper.
2. Materials and Methods
2.1. Lipids and DNA
The triflate derivative of dioleoylethylphosphatidylcholine, dioleoyl-O-ethylphosphatidylcholine (EDOPC), was synthesized as previously described [11,12]. Polar and total lipid extracts from bovine liver, brain, and heart; cholesterol, and dioleoyl derivatives of phosphatidylcholine (DOPC), phosphatidylethanolamine (DOPE), phosphatidylglycerol (DOPG), and phosphatidylserine (DOPS), all from Avanti Polar Lipids, Inc. (Alabaster, AL), were used without further purification (for the composition of the tissue extracts, see the web site of producer, www.avantilipids.com). Herring sperm DNA (Invitrogen, Carlsbad, CA), 10 mg/ml solution in water, was used for preparation of lipoplexes. For X-ray diffraction sample preparation, aliquots of lipids were transferred to vials where the bulk of the solvent was removed under argon. The vial was then placed under high vacuum for at least 1 h per mg lipid to remove residual chloroform. Next, PBS (50 mM phosphate buffer, 100 mM NaCl, pH 7.2) was added. The dispersions were hydrated overnight at room temperature, vortex-mixed for several minutes and then subjected to several cycles of freezing-thawing. For the flow-fluorometry samples, cationic EDOPC was labeled with 2.5 wt % of the fluorescent label BODIPY FL C12-HPC. Lipid dispersions were prepared at 50 μg/ml in PBS. DNA samples were labeled with the high-affinity fluorescent dye, ethidium homodimer-2 (Ethd-2) by mixing them at a 60 bp/dye ratio and incubating for at least 1 hour (typically overnight). A molecule of Ethd-2 carries four cationic charges, so that about 3 % of DNA phosphate group charges are neutralized by labeling. The cationic lipid/DNA charge ratio in the lipoplexes was estimated on the assumption of an average nucleotide mol wt 330. Negatively charged liposomes were prepared from unlabeled lipids at 50 μg/ml in PBS; to release DNA, they were added at 1:1 weight ratio to the cationic lipid at room temperature. For the zeta-potential measurements, cationic lipid dispersions in PBS were prepared at 50 μg/ml; DNA was added to generate lipoplexes at the desired charge ratio.
2.2. Synchrotron small-angle X-ray diffraction (SAXD)
measurements were performed at Argonne National Laboratory, Advanced Photon Source, DND-CAT (beamline 5-IDD) and BioCAT (beamline 18-ID), using 12 keV X-rays, as previously described [13]. The lipid concentration of the dispersions was 20 wt %. Samples were filled into glass capillaries (d = 1.0 or 1.5 mm) (Charles Super Co., Natick, MA) and flame-sealed. A Linkam thermal stage (Linkam Scientific Instruments, Surrey, England) provided temperature control. Linear heating and cooling scans were performed at rates of 0.8-5 °C/min. Exposure times were typically ∼0.5 sec. Data were collected using a MAR-CCD detector. Sample-to-detector distance was 1.8-2 m. Diffraction intensity vs. Q plots were obtained by radial integration of the 2D patterns using the interactive data-evaluating program FIT2D [14]. The repeat period of the lamellar phase (d-spacing) is determined from the position of the first-order reflection in the diffraction pattern; the lattice parameter of the hexagonal phase a=2d/√3 is calculated from the position (d) of the (10) diffraction peak.
2.3. Flow fluorometry
experiments were carried out as previously described [15,16]. A FACSCalibur flow cytometer from Becton Dickinson (Franklin Lakes, NJ), equipped with a 488 nm argon-ion laser was used. Particles were detected on the basis of emission into the FL1 channel (515-545 nm spectral window). The FL1 channel signal is proportional to BODIPY-PC emission (λem=513 nm), since Ethd-2 does not emit in this spectral region. Thus, we used this channel to detect lipid-containing particles and to determine the relative amount of lipid in the particle, which is proportional to the intensity. The FL3 channel (spectral window >650 nm) provides information about the amount of DNA in the particle, since the DNA label, Ethd-2, strongly emits into this channel (λem=624 nm). Typically, data are collected on 10,000 particles (which usually takes less than a minute). Bulk fluorescence (as measured in a conventional fluorometer) of both dyes was invariant upon complex formation. To convert the FL3/FL1 ratio into a DNA:lipid ratio, their net values were plotted against each other. Linear regression for the excess-lipid part of the curve is used for calibration, since all DNA molecules are associated with lipid when the latter is in excess [15]. The slope of the calibration curve gives the factor for conversion of FL3 channel intensity into DNA amount; the extrapolation to pure lipid (the end point can also be independently assessed) gives the amount of BODIPY emission that carries over into FL3.
3. Results
3.1. Release of DNA from EDOPC lipoplexes – flow fluorometry
Release of DNA is known to be a critical step in lipofection. Previously, we examined the ability of various anionic membrane lipids to provoke DNA unbinding from the lipoplexes, and found a clear correlation between the releasing capacities of the anionic lipids and the mesomorphic structures they form when mixed with the cationic phospholipid EDOPC. The anionic lipids that were more efficient in releasing DNA formed nonlamellar phases of high negative curvature; in contrast, the anionic lipids, for which only inefficient release of DNA was observed, formed mostly lamellar phases [17]. In order to make our model membranes more similar to real membranes, here we used a lipid mixture with a composition mimicking the average mammalian cellular membrane [18] as well as lipid extracts from mammalian tissues (bovine liver, heart and brain).
We applied flow-fluorometry [15,16] to examine, as a function of time, the release of DNA from EDOPC lipoplexes induced by addition of negatively charged liposomes. The results are presented as plots of the DNA/cationic lipid stoichiometry (as a charge ratio) vs. the relative cationic lipid content of the individual particles (Fig. 1) at different times after the addition of the negatively charged liposomes: DOPG (Fig. 1A), DOPS (Fig. 1B), membrane-mimicking lipid mixture (MM) DOPC:DOPE:DOPS:Chol 45:20:20:15 w/w (Fig. 1C), and polar lipid extract from bovine liver (Fig. 1D). The lipoplexes were prepared at close to isoelectric conditions (DNA/lipid ∼1:1 charge ratio) and equilibrated for 30 min before the addition of the negatively charged liposomes. The negatively charged liposomes were added to the lipoplexes at a 1:1 lipid weight ratio; measurements were initiated immediately upon addition of the negatively charged liposomes to lipoplexes.
Fig. 1.
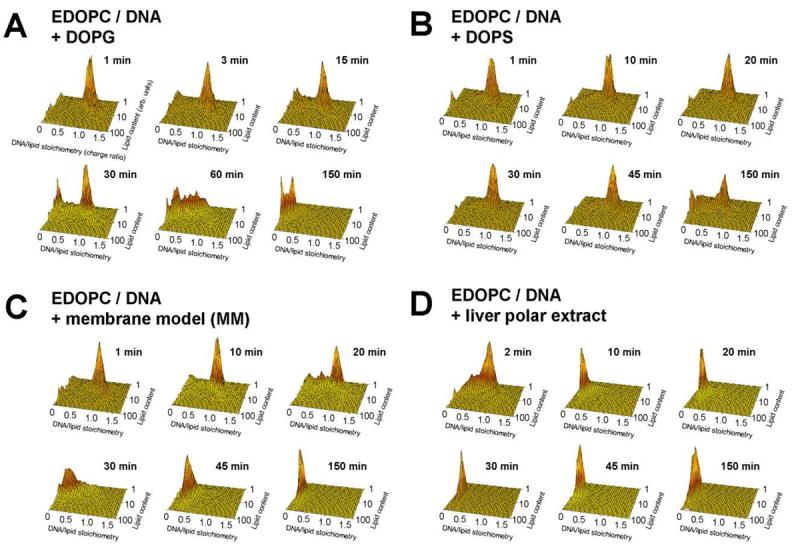
Plots of DNA/lipid stoichiometry (charge ratio) vs. cationic lipid content (arbitrary units) as reported by flow fluorometry, showing the time-course of DNA unbinding from EDOPC lipoplexes after addition of negatively charged liposomes: (A) DOPG; (B) DOPS; (C) membrane model mixture MM (MM=DOPC/DOPE/DOPS/Chol 45:20:20:15 w/w); (D) polar lipid extract from bovine liver (Avanti Polar Lipids). The stoichiometry (Y) axis represents the ratio of DNA to lipid charges in the particle. Lipoplexes contained cationic lipid labeled with 2.5% BODIPY-FL, and DNA labeled with the high affinity label, ethidium homodimer-2 (EthD-2) at 60 bp/dye. The panels show the distribution of stoichiometry vs. lipid content [15,16] after different times of incubation at room temperature, as indicated. Lipoplexes were initially prepared at near the isoelectric lipid/DNA ratio; negatively charged liposomes were added at a 1:1 weight ratio to the cationic lipid. In the usual case, particles that become more fluorescent are simply becoming larger. Since the fluorophore remains associated with the lipid, when two particles fuse or bind together, the resultant particle contains the fluorescence of both initial particles. Data in each panel were collected on 10,000 particles within less than 1 min.
Shortly after addition of DOPG liposomes to the EDOPC lipoplexes, particles of intermediate DNA/cationic lipid stoichiometries could be detected, but even after 30 min the original 1:1 lipoplexes predominated (Fig. 1A); at least an hour was needed for a considerable decrease of the DNA/cationic lipid stoichiometry (i.e., DNA release). With DOPS liposomes added to EDOPC lipoplexes, the DNA release was even slower (Fig. 1B), in agreement with our previous FRET results [17]. Even after more than 2h, only part of the DNA was released, and lipoplexes with the original ∼1:1 DNA/lipid charge ratio were still observed; the amount of aggregates fully devoid of DNA (DNA/lipid stoichiometry ∼0) was still minor. With the membrane mimicking lipid mixture MM as a releasing agent (at 1:1 MM/cationic lipid weight ratio), the original lipid/DNA 1:1 lipoplexes completely disappeared after 30 min of incubation (Fig. 1C). When polar lipid extract from liver was added to the EDOPC lipoplexes (at 1:1 lipid wt ratio), the original lipid/DNA ∼1:1 lipoplexes were eliminated within the first 10 min after mixing. The strong DNA releasing potency of the liver extract was also demonstrated by our previous energy transfer experiments [17].
Fig 2 compares the composition of the aggregates 30 min after the addition of the various kinds of negatively charged liposomes. Thus, the portion of released DNA after the 30 min incubation, calculated from the flow-fluorometry data, was 19% and 37% for the anionic DOPS or DOPG, respectively, whereas the membrane-mimicking formulation MM and the bovine liver lipid extract released 62% and 74%, respectively, of the DNA of the EDOPC lipoplexes.
Fig. 2.

Plots of DNA/lipid stoichiometry (charge ratio) vs. cationic lipid content as reported by flow fluorometry, comparing the lipid/DNA stoichiometries of EDOPC lipoplexes 30 min after addition of various negatively charged liposomes, as indicated (see legend of Fig. 1 for details).
Having established the impressive DNA-releasing potency of the membrane lipid blends, we next tried releasing DNA form lipoplexes at different DNA:lipid compositions – at an excess of DNA (lipid:DNA 1:1.5 charge ratio) and at an excess of lipid (lipid:DNA 1:0.75 charge ratio). The flow-fluorometric results, obtained with EDOPC lipoplexes and liver polar lipid extract as “releaser”, are shown in Fig. 3. While lipoplexes with excess of cationic lipid rapidly released their DNA content upon addition of the liver lipid extract (Fig. 3A), in the case of the lipoplexes with excess DNA, the release of DNA was quite inefficient even after 1h of incubation (Fig. 3B).
Fig. 3.
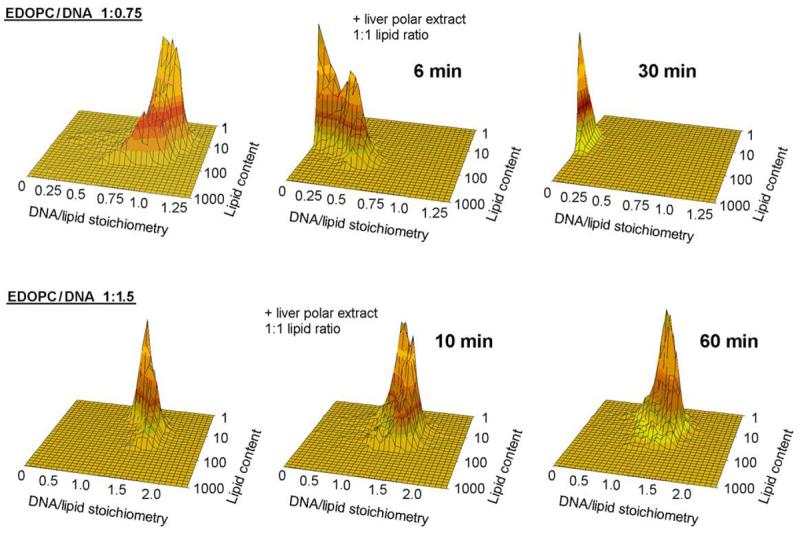
Plots of DNA/lipid stoichiometry (charge ratio) vs. cationic lipid content as reported by flow fluorometry, comparing the DNA release from EDOPC lipoplexes at two different EDOPC/DNA charge ratios (upper panel: 1:0.75; lower panel: 1:1.5) initiated by addition of liposomes from liver polar lipid extract; negatively charged liposomes were added at a 1:1 weight ratio to the cationic lipid (see legend of Fig. 1 for details).
3.2. Zeta potential
The zeta potential characterizes the surface charge density of lipoplexes which is critical for interaction with the negative cell surfaces, and, not surprisingly, has been reported to affect transfection [19]. We thus measured the zeta potential of EDOPC liposomes and lipoplexes at different DNA/lipid ratios (Fig. 4). Pure cationic liposomes exhibited a positive zeta potential of ∼60mV. With addition of DNA it decreased and became negative at DNA/lipid charge ratio ∼1.2:1. The zeta potential was ∼ −35mV at DNA/lipid charge ratios between 1.5:1 and 2.5:1.
Fig. 4.
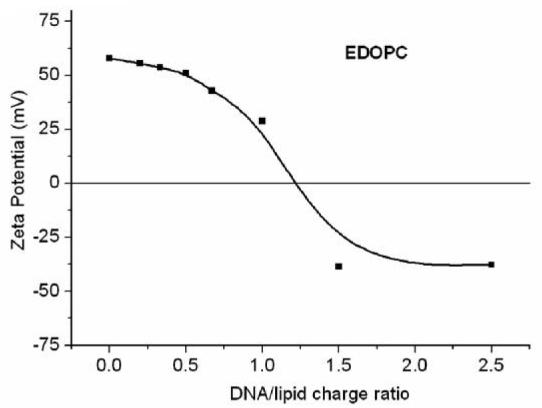
Zeta potential of EDOPC lipoplexes as a function of the DNA/lipid charge ratio, as measured by a Malvern Zetasizer Nano ZS instrument.
3.3. Structure and phase behavior of membrane mimicking compositions and natural extracts
The unusual capability of the biomembrane simulating lipid mixtures to provoke release of DNA from lipoplexes, in spite of their lower negative charge density (and thus lower capacity to neutralize the positive charge of the lipoplex lipids) motivated us to examine the structure and phase behavior of such lipid mixtures. While the anionic lipids DOPS and DOPG are known to be lamellar phase forming [20,21], the lipid mixtures modeling the membrane compositions were found strongly disposed to form nonlamellar phases at close to physiological conditions.
Fig. 5 shows the SAXD patterns recorded upon heating in the interval 20-90°C of hydrated samples of three types of natural polar lipid extracts: from bovine brain (A), heart (B) and liver (C). The brain extract is organized in the lamellar phase at 20°C, with a large lamellar spacing, d=9.86 nm. Upon heating, it transforms into inverted hexagonal phase at ∼40°C, with a lattice parameter a=2d/√3 = 7.72 nm. On subsequent cooling, the lamellar phase returns, together with traces of cubic phase, likely Pn3m (not illustrated). The diffraction pattern of the heart polar lipid extract also indexes as a lamellar phase at 20°C (d=9.28 nm), exhibiting a peculiar intensity profile, with the second order diffraction reflection considerably more intense than the first order (Fig. 5B). On heating, it becomes converted at ∼45°C into a disordered phase, which does not exhibit any diffraction maxima. The lamellar phase is restored upon cooling (not illustrated). The polar lipid extract from bovine liver undergoes a lamellar→inverted hexagonal phase transition at ∼50°C, from a lamellar phase with a repeat period d=8.89 nm to a hexagonal phase with a large lattice parameter a=12 nm. Traces of cubic (likely Pn3m) phase are displayed on cooling, together with the restored lamellar phase (not illustrated).
Fig. 5.
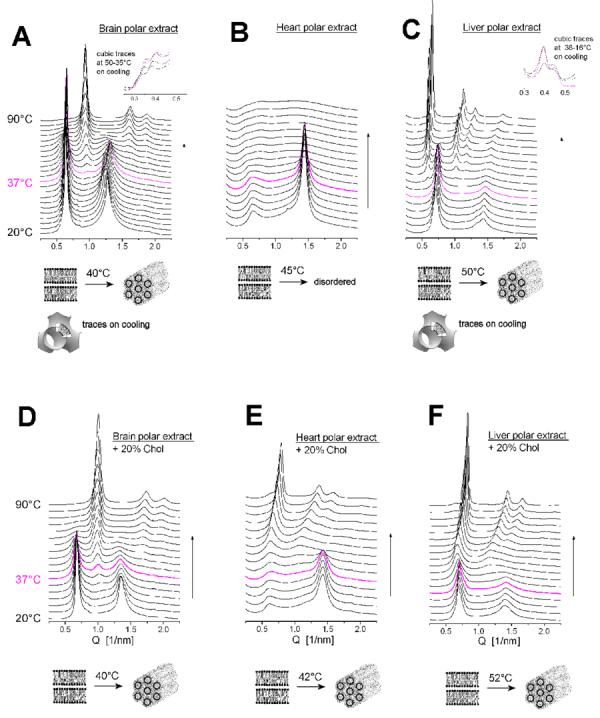
SAXD patterns of hydrated samples of polar lipid extracts from bovine brain (A), heart (B), and liver (C); brain extract : cholesterol 8:2 w/w (D), heart extract : cholesterol 8:2 w/w (E), liver extract : cholesterol 8:2 w/w (F), recorded during heating scans from 20°C to 90°C; the magenta pattern is for 37°C.
In order to better model the composition of the biomembranes, we added 20 wt% cholesterol to the three kinds of polar lipid extracts discussed above, and also examined their structural organization. The SAXD profiles recorded upon heating are shown in Fig. 5D-F. With the addition of cholesterol, all three mixtures exhibited a lamellar-hexagonal phase transition at temperatures close to physiological, namely at ∼40°C for brain polar extract + Chol, ∼42°C for heart polar extract + Chol, and ∼52°C for liver polar extract + Chol. The lattice parameters of the HII phase at 90°C are a=7.2 nm, 9.0 nm, and 7.8 nm for the mixtures with brain, heart, and liver extracts, respectively. The lamellar-hexagonal transition is reversible on cooling for these samples (not illustrated), along with the large temperature hysteresis that is typical for this kind of transition; thus, the reverse transition (hexagonal-lamellar) takes place on cooling at temperatures even slightly below physiological (or around it for the heart extract+Chol mixture), so that at physiological temperatures the samples are within the hysteresis loop.
We also tested the phase behavior of the total lipid extracts of the three tissues (bovine brain, heart and liver). According to the producer, these are chloroform:methanol extract of the respective organ and differ from the polar extracts (which are further processed by precipitation with acetone and then extracted with diethyl ether from the total extracts) by their higher contents of neutral lipids (www.avantilipids.com). The total extracts also exhibited strong tendencies to form nonlamellar phases (Fig. 6): the brain total extract underwent a lamellar-hexagonal transition at 45-50°C (Fig. 6A); the heart total extract – a lamellar-disordered transition at ∼80°C (Fig. 6B), and the liver total extract – a lamellar-hexagonal transition at ∼15-20°C, with traces of the micellar cubic phase Fd3m at high temperatures (>60°C) (Fig. 6C).
Fig. 6.
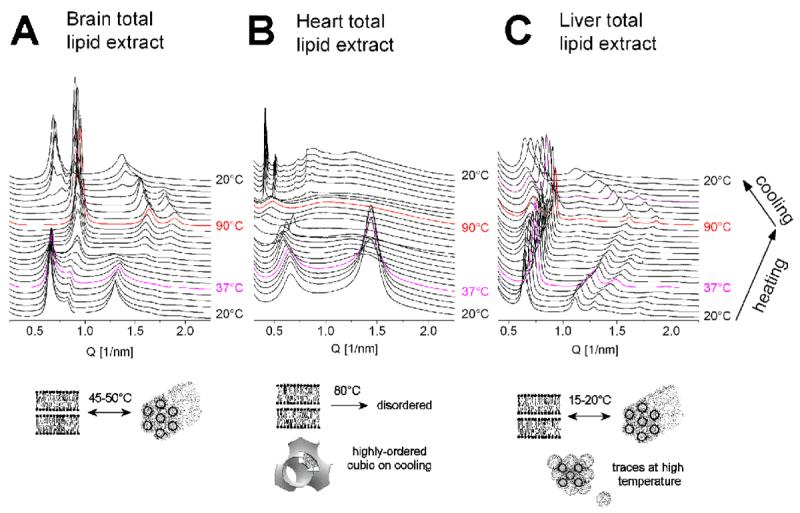
SAXD patterns of hydrated samples of total lipid extracts from bovine brain (A), heart (B), and liver (C), recorded during heating and cooling scans between 20°C and 90°C; the magenta pattern was recorded at 37°C on heating.
The membrane-mimicking lipid formulation DOPC:DOPE:DOPS:Chol 45:20:20:15 (w/w) was organized into lamellar phase at 20°C (Fig. 7), with a large lamellar repeat distance d= 9.6 nm. On heating, traces of an inverted hexagonal phase first appeared at ∼40°C. The two phases – lamellar and HII – coexisted until the end of the heating scan at 55°C. Traces of a third phase – cubic – appeared also at even higher temperatures, ∼50°C, and coexisted with the lamellar and HII.
Fig. 7.
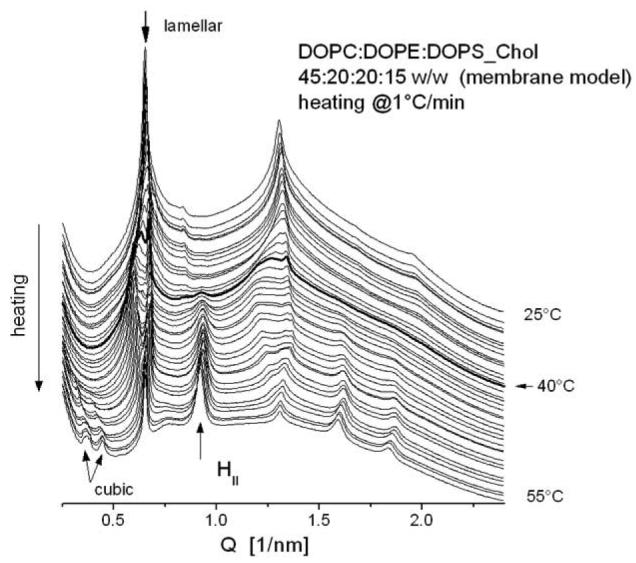
SAXD patterns of membrane mimicking (MM) lipid mixture DOPC/DOPE/DOPS/Chol 45:20:20:15 w/w, recorded upon heating from 25°C to 55°C; the bolded pattern indicates the first appearance of the inverted hexagonal HII phase at 40°C.
4. Discussion
According to current understanding, the basic steps of lipid-assisted transfection include adsorption of lipoplexes to the cell surface, endocytosis, release of DNA and then transport of the released DNA to the nucleus for transcription [22-24]. The release of DNA from the cationic lipid carrier when the lipoplex gets inside the cell has been identified as one of the key steps in lipofection. Unbinding of DNA from the cationic lipid is believed to be a result of charge neutralization of the latter by cellular anionic lipids. Cationic lipid-DNA interactions are strong [25] and the only apparent possibility for release of DNA under cellular conditions (which preclude high temperatures and high concentrations of competing counterions) is by neutralization of the cationic lipid charge with cellular anionic lipids. Indeed, experiments have revealed that addition of negatively charged liposomes to lipoplexes results in dissociation of DNA from the lipid [9-11,17,26]. Thus, intermixing of membrane lipids with lipoplex lipids is presumed to be a necessary step in transfection. Given the need for such a step, a set of recent findings takes on particular significance. These findings suggest that the structure of cationic lipid carriers might change dramatically upon mixing with cellular lipids, and furthermore, that such changes may critically affect DNA delivery efficiency.
In an earlier publication, we described a correlation between the delivery efficiency of these DNA carriers and the mesomorphic phases they form after interaction with anionic membrane lipids. Specifically, formulations that are particularly effective DNA carriers form phases of highest negative interfacial curvature when mixed with negatively charged membrane lipids, whereas less effective formulations form phases of lower curvature under the same conditions [27]. Thus, a viewpoint now emerging is that the critical factor in lipid-mediated transfection is the structural evolution of lipoplexes upon interacting and mixing with cellular lipids [17,27-30].
When studying the release of DNA as a result of the interaction of lipoplex lipids with negatively charged membrane lipids earlier, we used pure anionic membrane lipids [17]. To better simulate the conditions that exist when lipoplexes interact with cellular lipids, for the experiments described here, we used a membrane-mimicking lipid blend as well as tissue lipid extracts. It was impractical to obtain lipids from internal membranes of cells involved in vesicle trafficking (much less the inner lipid monolayer of these membranes), so we simply made use of commercially available natural mixtures. These revealed differences among themselves and if perhaps not entirely representative of the relevant membranes, clearly revealed surprising properties of natural lipid mixtures. These turned out to be much more effective in releasing DNA from the lipoplexes than did the pure anionic lipids. This is surprising because they have a lower charge density (negatively charged lipid constitutes only ∼20% of the natural and synthetic mixtures) and thus less capacity to neutralize the positive charge of the lipoplex lipids (negatively charged liposomes were added at 1:1 weight ratio to the cationic lipids). In order to decipher the observed phenomenon and in view of the strong correlation between the efficiency of DNA release and the lipid phase behavior reported previously, we also examined the phase preferences of the several lipid formulations used in the present investigation that simulate natural membranes – tissue extracts and a membrane lipid mixture.
The anionic membrane lipids DOPS and DOPG are known to be lamellar phase forming [20,21]; all of the membrane-simulating formulations we examined here also formed lamellar phases at physiological temperature (with one exception – the liver total lipid extract – which formed lamellar phase only below 20°C), but were found strongly prone to form nonlamellar phases. Indeed, heating only somewhat above physiological temperatures, generally in the range 40-50°C, was sufficient to convert them into nonlamellar aggregates (previous studies have shown the ability of mammalian lipid compositions to arrange into nonlamellar arrays at conditions far from physiological – e.g., high temperature or low hydration [2,3]). Given their unusual effectiveness in releasing DNA from lipoplexes, the fact that these lipids are very close to a nonlamellar phase boundary suggests that lipid phase properties are very important in lipofection processes.
The propensity of lipids to form nonbilayer phases is embodied in the concept of bilayer “frustration” that is brought about by the imbalance of forces in the bilayer, and which imposes a nonzero intrinsic curvature on the two opposing monolayers [31-33]. The concept of spontaneous (intrinsic) curvature is a formal mechanism to describe the tendency of a monolayer to bend to a particular curvature; it is more a thermodynamic property than a real physical curvature (since the lamellar phase imposes the juxtaposition of the two monolayers and the actual curvature is zero). It is related to the stored curvature elastic energy at a given monolayer topology. For DOPE, the most frequently explored example of a membrane lipid prone to form nonbilayer phases, this stored curvature elastic energy has been estimated as ∼1 kBT per molecule in a flat monolayer [34-36]. This value is close to the estimates of the binding energy between cationic lipid (specifically, EDOPC) and DNA, assessed from examination of lipoplex dissociation under conditions of increasing salt concentration [25]. It is thus clear that the balance between these energy contributions – the elastic energy stored in a frustrated lipid bilayer and the lipid-DNA binding energy – could play a significant role in lipoplex-membrane interactions and DNA release energetics.
There is now a growing body of evidence that nonlamellar-forming membrane lipids play essential roles in many aspects of membrane functions. Moreover, the tendency of some bacteria to regulate the lipid composition of their membranes within a window close to the lamellar-nonlamellar phase transition has been reported (e.g., [37]). The total lipids from Acholeplasma laidlawii have been shown to form nonlamellar phases [38]. Furthermore, the activity of membrane proteins has been shown to be strongly modulated by membrane curvature/elastic stress properties, controlled in turn by the presence of nonbilayer-forming lipids (e.g., [39-42]).
Our finding that various tissue extracts from higher organisms are also strongly prone to arrange into nonlamellar phases, and do form such phases at close to physiological conditions shows that such properties are not limited to bacteria. This propensity may well have much broader significance than in DNA transfection and may well be significant for a variety of biological processes. It is a potentially critical property because it allows a small energy input to trigger a massive structural change. This follows because structural phase transitions between liquid crystalline phases are quite cooperative, and such massive transformations can be produced by small variations in composition or environmental conditions.
As described here, the propensity of membrane lipid compositions to convert into nonlamellar phases is seen to be very important for their interaction with lipoplexes and the subsequent release of DNA. A possible molecular scenario can be envisioned in which the minor portion of anionic lipid found in membranes is sufficient to initiate a contact between a positively charged lipoplex and a membrane (local negative charge density could be high though, as a result of migration of the negative lipid to the contact region, as, for example, is shown in ref. [43]; such a phenomenon was proposed to account for the frequent hemifusion of oppositely-charged giant vesicles having low concentrations, ∼20%, of charged lipid [44]); if the lipoplex and/or membrane bilayers are strongly disposed to form nonlamellar phases, a transition to such phase induced by their intermixing may release enough elastic free energy to counterbalance the residual cationic lipid-DNA electrostatic attraction and make the release of DNA favorable.
According to the analysis of Parsegian and Gingell [45], contact between oppositely charged surfaces in electrolyte solution is possible only if the two surfaces bear the same charge density; otherwise, the surfaces can repel each other even though they are oppositely charged. This consideration seems important for the lipoplex-membrane interactions, since the requirement for equal charge densities is difficult to fulfill; the actual charged lipid fraction of membranes depends strongly on cell type and also varies from organelle to organelle. For soft, flexible, oppositely charged surfaces such as the liquid crystalline lipid bilayers, with freely flowing, possibly nonuniformly distributed charges, however, it has been shown that large charge density fluctuations are likely [46] as a result of lipid demixing [47-49]. Such fluctuations can trigger attractive instabilities, promote high local curvatures, and thus reduce the fusion barrier, thereby facilitating fusion [50]. Moreover, the lipid moiety of biomembranes has been found to be, in general, close to the demixing point [51].
The importance of electrostatic interactions for the (initial) interactions of lipoplexes and negatively charged membranes, promoting further to DNA release, was indeed demonstrated by our DNA release flow-fluorometry experiments involving lipoplexes with excess lipid or excess DNA (Fig. 3) that had positive and negative zeta potentials, respectively (Fig. 4). While the lipoplexes with excess cationic lipid promptly and efficiently released DNA upon addition of negatively charged liposomes, virtually no release was observed with the lipoplexes bearing excess DNA.
We conclude on a note of caution: The extraordinary efficiency of the lipid formulations that simulate natural membranes – tissue extracts and the membrane lipid mixture – in releasing DNA from lipoplexes, together with their strong propensity to form nonlamellar phases indicates, that, although electrostatic interactions are important in transfection, they are only one of the multitude of factors in the molecular machinery of the lipid-mediated DNA delivery.
Acknowledgments
Supported by NIH grants GM52329 and GM57305, and the Center for Cancer Nanotechnology Excellence (CCNE) initiative of the National Institutes of Health's National Cancer Institute under Award Number U54CA119341. Authors wish to thank Harsh Parikh (Northwestern University) for synthesis of cationic lipids and Robert A. Lamb (Northwestern University) for access to the flow cytometer. BioCAT is a NIH-supported Research Center, through Grant RR08630. DND-CAT is supported by the E.I. DuPont de Nemours & Co., The Dow Chemical Company, the U.S. National Science Foundation through Grant DMR-9304725, and the State of Illinois through the Department of Commerce and the Board of Higher Education Grant IBHE HECA NWU 96. Use of the Advanced Photon Source was supported by the U.S. Department of Energy, Basic Energy Sciences, Office of Energy Research under Contract No. W-31-102-Eng-38.
Footnotes
Publisher's Disclaimer: This is a PDF file of an unedited manuscript that has been accepted for publication. As a service to our customers we are providing this early version of the manuscript. The manuscript will undergo copyediting, typesetting, and review of the resulting proof before it is published in its final citable form. Please note that during the production process errors may be discovered which could affect the content, and all legal disclaimers that apply to the journal pertain.
References
- 1.Singer SJ, Nicolson GL. Fluid Mosaic Model of Structure of Cell-Membranes. Science. 1972;175:720–731. doi: 10.1126/science.175.4023.720. [DOI] [PubMed] [Google Scholar]
- 2.Gulik-Krzywicki T, Rivas E, Luzzati V. Structure Et Polymorphisme Des Lipides - Etude Par Diffraction Des Rayons X Du Systeme Forme De Lipides De Mitochondries De Coeur De Boeuf Et Deau. J. Mol. Biol. 1967;27:303–322. doi: 10.1016/0022-2836(67)90022-8. [DOI] [PubMed] [Google Scholar]
- 3.Luzzati V, Reiss-Husson F, Rivas E, Gulik-Krzywicki T. Structure and Polymorphism in Lipid-Water Systems and Their Possible Biological Implications. Ann. N. Y. Acad. Sci. 1966;137:409–413. doi: 10.1111/j.1749-6632.1966.tb50172.x. [DOI] [PubMed] [Google Scholar]
- 4.Mouritsen OG, Andersen OS, editors. In Search of a New Biomembrane Model. Munksgaard; Copenhagen: 1998. [Google Scholar]
- 5.Lindblom G, Oradd G, Rilfors L, Morein S. Regulation of Lipid Composition in Acholeplasma laidlawii and Escherichia coli Membranes: NMR Studies of Lipid Lateral Diffusion at Different Growth Temperatures. Biochemistry. 2002;41:11512–11515. doi: 10.1021/bi0263098. [DOI] [PubMed] [Google Scholar]
- 6.Morein S, Andersson AS, Rilfors L, Lindblom G. Wild-Type Escherichia coli Cells Regulate the Membrane Lipid Composition in a “Window” Between Gel and Non-Lamellar Structures. J. Biol. Chem. 1996;271:6801–6809. doi: 10.1074/jbc.271.12.6801. [DOI] [PubMed] [Google Scholar]
- 7.DeKruijff B, Cullis PR, Verkleij AJ. Non-Bilayer Lipid Structures in Model and Biological-Membranes. Trends Biochem. Sci. 1980;5:79–81. [Google Scholar]
- 8.Felgner PL, Ringold GM. Cationic Liposome-Mediated Transfection. Nature. 1989;337:387–388. doi: 10.1038/337387a0. [DOI] [PubMed] [Google Scholar]
- 9.Xu YH, Szoka FC. Mechanism of DNA Release From Cationic Liposome/DNA Complexes Used in Cell Transfection. Biochemistry. 1996;35:5616–5623. doi: 10.1021/bi9602019. [DOI] [PubMed] [Google Scholar]
- 10.Zelphati O, Szoka FC. Mechanism of Oligonucleotide Release From Cationic Liposomes. Proc. Natl. Acad. Sci. U. S. A. 1996;93:11493–11498. doi: 10.1073/pnas.93.21.11493. [DOI] [PMC free article] [PubMed] [Google Scholar]
- 11.MacDonald RC, Ashley GW, Shida MM, Rakhmanova VA, Tarahovsky YS, Pantazatos DP, Kennedy MT, Pozharski EV, Baker KA, Jones RD, Rosenzweig HS, Choi KL, Qiu RZ, McIntosh TJ. Physical and Biological Properties of Cationic Triesters of Phosphatidylcholine. Biophys. J. 1999;77:2612–2629. doi: 10.1016/S0006-3495(99)77095-5. [DOI] [PMC free article] [PubMed] [Google Scholar]
- 12.Rosenzweig HS, Rakhmanova VA, McIntosh TJ, MacDonald RC. O-Alkyl Dioleoylphosphatidylcholinium Compounds: The Effect of Varying Alkyl Chain Length on Their Physical Properties and in Vitro DNA Transfection Activity. Bioconjug. Chem. 2000;11:306–313. doi: 10.1021/bc9901144. [DOI] [PubMed] [Google Scholar]
- 13.Koynova R, MacDonald RC. Mixtures of Cationic Lipid O-Ethylphosphatidylcholine With Membrane Lipids and DNA: Phase Diagrams. Biophys. J. 2003;85:2449–2465. doi: 10.1016/s0006-3495(03)74668-2. [DOI] [PMC free article] [PubMed] [Google Scholar]
- 14.Hammersley AP, Svensson SO, Hanfland M, Fitch AN, Hausermann D. Two-Dimensional Detector Software: From Real Detector to Idealised Image or Two-Theta Scan. High Pressure Res. 1996;14:235–248. [Google Scholar]
- 15.Pozharski E, MacDonald RC. Analysis of the Structure and Composition of Individual Lipoplex Particles by Flow Fluorometry. Anal. Biochem. 2005;341:230–240. doi: 10.1016/j.ab.2005.03.027. [DOI] [PubMed] [Google Scholar]
- 16.Koynova R, Tarahovsky Y, Wang L, MacDonald RC. Lipoplex Formulation of Superior Efficacy Exhibits High Surface Activity and Fusogenicity, and Readily Releases DNA. Biochim. Biophys. Acta-Biomembranes. 2007;1768:375–386. doi: 10.1016/j.bbamem.2006.10.016. [DOI] [PMC free article] [PubMed] [Google Scholar]
- 17.Tarahovsky YS, Koynova R, MacDonald RC. DNA Release From Lipoplexes by Anionic Lipids: Correlation With Lipid Mesomorphism, Interfacial Curvature, and Membrane Fusion. Biophys. J. 2004;87:1054–1064. doi: 10.1529/biophysj.104.042895. [DOI] [PMC free article] [PubMed] [Google Scholar]
- 18.Gennis RB. Molecular Structure and Function. Springer-Verlag; New York: 1989. Biomembranes. [Google Scholar]
- 19.Takeuchi K, Ishihara M, Kawaura C, Noji M, Furuno T, Nakanishi M. Effect of Zeta Potential of Cationic Liposomes Containing Cationic Cholesterol Derivatives on Gene Transfection. FEBS Lett. 1996;397:207–209. doi: 10.1016/s0014-5793(96)01136-2. [DOI] [PubMed] [Google Scholar]
- 20.Lipid Data Bank 2000 http://www.ldb.chemistry.ohio-state.edu/
- 21.Marsh D. Handbook of Lipid Bilayers. CRC Press; 1990. [Google Scholar]
- 22.Zabner J, Fasbender AJ, Moninger T, Poellinger KA, Welsh MJ. Cellular and Molecular Barriers to Gene-Transfer by A Cationic Lipid. J. Biol. Chem. 1995;270:18997–19007. doi: 10.1074/jbc.270.32.18997. [DOI] [PubMed] [Google Scholar]
- 23.Legendre JY, Szoka FC. Delivery of Plasmid Dna Into Mammalian-Cell Lines Using Ph-Sensitive Liposomes - Comparison With Cationic Liposomes. Pharm. Res. 1992;9:1235–1242. doi: 10.1023/a:1015836829670. [DOI] [PubMed] [Google Scholar]
- 24.Zhou XH, Huang L. DNA Transfection Mediated by Cationic Liposomes Containing Lipopolylysine - Characterization and Mechanism of Action. Biochim. Biophys. Acta-Biomembranes. 1994;1189:195–203. doi: 10.1016/0005-2736(94)90066-3. [DOI] [PubMed] [Google Scholar]
- 25.Pozharski E, MacDonald RC. Lipoplex Thermodynamics: Determination of DNA-Cationic Lipoid Interaction Energies. Biophys. J. 2003;85:3969–3978. doi: 10.1016/S0006-3495(03)74811-5. [DOI] [PMC free article] [PubMed] [Google Scholar]
- 26.Ashley GW, Shida MM, Qiu R, Lahiri MK, Levisay PC, Jones RD, Baker KA, MacDonald RC. Phosphatidylcholinium Compounds: A New Class of Cationic Phospholipids With Transfection Activin and Unusual Physical Properties (Abstract) Biophys. J. 1996;70:88–A. [Google Scholar]
- 27.Koynova R, Wang L, Tarahovsky Y, MacDonald RC. Lipid Phase Control of DNA Delivery. Bioconjug. Chem. 2005;16:1335–1339. doi: 10.1021/bc050226x. [DOI] [PubMed] [Google Scholar]
- 28.Zuhorn IS, Bakowsky U, Polushkin E, Visser WH, Stuart MCA, Engberts JBFN, Hoekstra D. Nonbilayer Phase of Lipoplex-Membrane Mixture Determines Endosomal Escape of Genetic Cargo and Transfection Efficiency. Mol. Therapy. 2005;11:801–810. doi: 10.1016/j.ymthe.2004.12.018. [DOI] [PubMed] [Google Scholar]
- 29.Koynova R, Wang L, MacDonald RC. An Intracellular Lamellar - Nonlamellar Phase Transition Rationalizes the Superior Performance of Some Cationic Lipid Transfection Agents. Proc. Natl. Acad. Sci. U. S. A. 2006;103:14373–14378. doi: 10.1073/pnas.0603085103. [DOI] [PMC free article] [PubMed] [Google Scholar]
- 30.Wang L, Koynova R, Parikh H, MacDonald RC. Transfection Activity of Binary Mixtures of Cationic O-Substituted Phosphatidylcholine Derivatives: The Hydrophobic Core Strongly Modulates Their Physical Properties and DNA Delivery Efficacy. Biophys. J. 2006;91:3692–3706. doi: 10.1529/biophysj.106.092700. [DOI] [PMC free article] [PubMed] [Google Scholar]
- 31.Gruner SM. Intrinsic Curvature Hypothesis for Biomembrane Lipid-Composition - A Role for Nonbilayer Lipids. Proc. Natl. Acad. Sci. U. S. A. 1985;82:3665–3669. doi: 10.1073/pnas.82.11.3665. [DOI] [PMC free article] [PubMed] [Google Scholar]
- 32.Anderson DM, Gruner SM, Leibler S. Geometrical Aspects of the Frustration in the Cubic Phases of Lyotropic Liquid-Crystals. Proc. Natl. Acad. Sci. U. S. A. 1988;85:5364–5368. doi: 10.1073/pnas.85.15.5364. [DOI] [PMC free article] [PubMed] [Google Scholar]
- 33.Seddon JM, Templer RH. In: Polymorphism of Lipid-Water Systems. Lipowsky R, Sackmann E, editors. Amsterdam: 1995. pp. 97–160. [Google Scholar]
- 34.Templer RH, Khoo BJ, Seddon JM. Gaussian Curvature Modulus of an Amphiphilic Monolayer. Langmuir. 1998;14:7427–7434. [Google Scholar]
- 35.Chen Z, Rand RP. The Influence of Cholesterol on Phospholipid Membrane Curvature and Bending Elasticity. Biophys. J. 1997;73:267–276. doi: 10.1016/S0006-3495(97)78067-6. [DOI] [PMC free article] [PubMed] [Google Scholar]
- 36.Kozlov MM, Leikin S, Rand RP. Bending, Hydration and Interstitial Energies Quantitatively Account for the Hexagonal-Lamellar-Hexagonal Reentrant Phase-Transition in Dioleoylphosphatidylethanolamine. Biophys. J. 1994;67:1603–1611. doi: 10.1016/S0006-3495(94)80633-2. [DOI] [PMC free article] [PubMed] [Google Scholar]
- 37.Rilfors L, Lindblom G. Regulation of Lipid Composition in Biological Membranes -Biophysical Studies of Lipids and Lipid Synthesizing Enzymes. Colloids Surfaces B-Biointerfaces. 2002;26:112–124. [Google Scholar]
- 38.Andersson AS, Rilfors L, Oradd G, Lindblom G. Total Lipids With Short and Long Acyl Chains From Acholeplasma Form Nonlamellar Phases. Biophys. J. 1998;75:2877–2887. doi: 10.1016/S0006-3495(98)77730-6. [DOI] [PMC free article] [PubMed] [Google Scholar]
- 39.Botelho AV, Gibson NJ, Thurmond RL, Wang Y, Brown MF. Conformational Energetics of Rhodopsin Modulated by Nonlamellar-Forming Lipids. Biochemistry. 2002;41:6354–6368. doi: 10.1021/bi011995g. [DOI] [PubMed] [Google Scholar]
- 40.Attard GS, Templer RH, Smith WS, Hunt AN, Jackowski S. Modulation of CTP : Phosphocholine Cytidylyltransferase by Membrane Curvature Elastic Stress. Proc. Natl. Acad. Sci. U. S. A. 2000;97:9032–9036. doi: 10.1073/pnas.160260697. [DOI] [PMC free article] [PubMed] [Google Scholar]
- 41.Gruner SM. In: Coupling Between Bilayer Curvature Elasticity and Membrane-Protein Activity. Blank M, Vodyanoy I, editors. Vol. 235. Washington, DC: 1994. pp. 129–149. [Google Scholar]
- 42.McIntosh TJ, Simon SA. Roles of Bilayer Material Properties in Function and Distribution of Membrane Proteins. Annu. Rev. Biophys. Biomol. Struct. 2006;35:177–198. doi: 10.1146/annurev.biophys.35.040405.102022. [DOI] [PubMed] [Google Scholar]
- 43.Nardi J, Feder T, Bruinsma R, Sackmann E. Electrostatic Adhesion Between Fluid Membranes: Phase Separation and Blistering. Europhys. Lett. 1997;37:371–376. [Google Scholar]
- 44.Pantazatos DP, MacDonald RC. Directly Observed Membrane Fusion Between Oppositely Charged Phospholipid Bilayers. J. Membr. Biol. 1999;170:27–38. doi: 10.1007/s002329900535. [DOI] [PubMed] [Google Scholar]
- 45.Parsegian VA, Gingell D. Electrostatic Interaction Across A Salt Solution Between 2 Bodies Bearing Unequal Charges. Biophys. J. 1972;12:1192–1204. doi: 10.1016/S0006-3495(72)86155-1. [DOI] [PMC free article] [PubMed] [Google Scholar]
- 46.Hed G, Safran SA. Attractive Instability of Oppositely Charged Membranes Induced by Charge Density Fluctuations. Phys. Rev. Lett. 2004;93 doi: 10.1103/PhysRevLett.93.138101. [DOI] [PubMed] [Google Scholar]
- 47.Russ C, Heimburg T, von Grunberg HH. The Effect of Lipid Demixing on the Electrostatic Interaction of Planar Membranes Across a Salt Solution. Biophys. J. 2003;84:3730–3742. doi: 10.1016/S0006-3495(03)75101-7. [DOI] [PMC free article] [PubMed] [Google Scholar]
- 48.Harries D, May S, Ben Shaul A. Curvature and Charge Modulations in Lamellar DNA-Lipid Complexes. J. Phys. Chem. B. 2003;107:3624–3630. [Google Scholar]
- 49.Nardi J, Bruinsma R, Sackmann E. Adhesion-Induced Reorganization of Charged Fluid Membranes. Phys. Rev. E. 1998;58:6340–6354. [Google Scholar]
- 50.Kozlovsky Y, Kozlov MM. Stalk Model of Membrane Fusion: Solution of Energy Crisis. Biophys. J. 2002;82:882–895. doi: 10.1016/S0006-3495(02)75450-7. [DOI] [PMC free article] [PubMed] [Google Scholar]
- 51.Sackmann E. Membrane Bending Energy Concept of Vesicle-Shape and Cell-Shape and Shape-Transitions. FEBS Lett. 1994;346:3–16. doi: 10.1016/0014-5793(94)00484-6. [DOI] [PubMed] [Google Scholar]