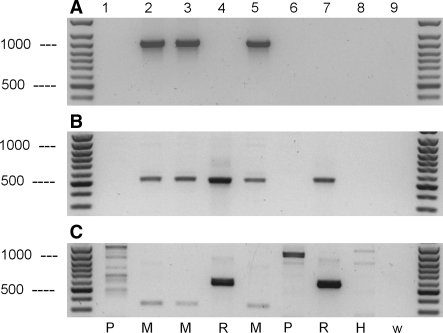
Fig. 2.
PCR analysis of genomic DNA from different cell lines with primers designed from mouse and rat β-globin sequences. PCRs were performed with the following oligonucleotid primer pairs: (a) c-globin-F and glo-mus-R; (b) c-globin-F and glo-rat-R1; (c) glo-rat-F and glo-rat-R2. Amplified DNA fragments were detected after ethidium bromide staining of 1.2% agarose gels. Lane 1, K-562 (ACC 10); lane 2, mouse test sample sent to DSMZ; lane 3, L-929 (ACC 2); lane 4, PC-12 (ACC 159); lane 5, NIH-3T3 (ACC 59); lane 6, COS-7 (ACC 60); lane 7, RGE (ACC 262); lane 8, CHO-K1 (ACC 110); lane 9, negative control (water). H, Hamster; M, Mouse; P, Primate; R, Rat; W, Water control (no DNA). The positions of the DNA molecular weight markers of 500 and 1,000 bp are indicated

