Abstract
The fluorescence decay functions of individual, specifically labeled tRNAPhe molecules exhibit nonexponential character as a result of conformational dynamics occurring during the measurement on a single molecule. tRNAPhe conformational states that interchange much more slowly are evidenced by the distribution of lifetimes observed for many individual molecules. A structural model for the nonexponential decay indicates that the tRNAPhe–probe adduct fluctuates between two states, one of which provides conditions that quench the probe fluorescence.
Recent exciting developments that couple microscopy with various forms of optical spectroscopy (1–9) have made possible heretofore unprecedented visualization of processes involving single biological molecules or assemblies (10–19). Time-resolved detection has also been incorporated into these approaches (2–7), thereby enabling studies of the dynamics of molecular processes at the single assembly level. Fluorescence lifetimes and spectra obtained from the repeated excitation of a single molecule have been reported and characterized for a number of fluorescent dyes and for a few molecules of biological importance (2–7, 13, 14). Such single molecule studies can yield knowledge that is either not evident, or not obtainable from investigations of macroscopic systems (20).
One area where single molecule experiments can be particularly valuable to biology is in the determination of the microscopic origins of heterogeneity associated with observables. In kinetic measurements performed on ensembles of molecules, heterogeneity often shows up as nonexponential behavior. However, it is usually not known how the variations in the properties are distributed over the ensemble. Nevertheless, specific statistical distributions of properties can be constructed if the experiments are carried out on a molecule by molecule basis. For example, the variations that were observed recently in the fluorescence lifetimes of single DNA–probe complexes sampled from an ensemble, yielded information on the conformational transitions occurring in the equilibrium distribution (21, 22), where different conformations of the complex were found to have different fluorescence lifetimes (22). In this paper, we report the first examples of nonexponential kinetics directly observed under physiological conditions in a number of single, tRNAPhe molecules specifically labeled with tetramethylrhodamine (TMR), where we observe directly how the movements of parts of the tRNAPhe structure vary from molecule to molecule. The experiments are carried out with a scanning optical confocal microscope coupled to a single photon counting detector with picosecond time resolution.
MATERIALS AND METHODS
The tRNAPhe–TMR Adduct Preparation.
Specific tRNAPhe from Escherichia coli (1,500 pmol/A260) was isolated according to ref. 23. 4-thiouridine (s4U) at position 8 of tRNAPhe was specifically labeled by reaction with tetramethylrhodamine-5-iodacetamide (Molecular Probes) according to ref. 24, except that two phenol extractions were used to remove noncovalently bound dye: the first was carried out at pH 4.6, and a second after heat denaturation of tRNAPhe–TMR in 10 mM Tris⋅HCl, pH 7.0/1 mM EDTA at 85°C for 2 min. The final tRNAPhe–TMR adduct contained 0.94 mol of TMR per mol of tRNAPhe. The tRNAPhe–TMR adducts were reactivated at 37°C for 10 min prior to the experiments.
Fluorescence Measurements.
The time-correlated single photon counting instrument, based on a picosecond dye laser system, and the associated data fitting procedures were described (25). The sample was mounted on a home-built inverted confocal microscope. The sample fluorescence is confocally imaged to a silicon avalanche photodiode. For fluorescence imaging, the sample is raster scanned with a piezoelectric tube. In the single photon counting method of determining fluorescent transients, the statistical distribution of time delays between excitation of the molecule by a picosecond pulse and the subsequent emission of the fluorescent photon is obtained directly. The detector was protected from the excitation beam (547 nm) by means of filters. The microscope uses a CF Flur 40× oil immersion objective with a numerical aperture of 1.3. Index matching fluid from Cargille is employed in the objective. The detector (EG & G, SPCM-200 CD2027) has a 170 μm active area. The piezoelectric tube is controlled by Digital Instrument Nanoscope E. A dichroic mirror (Chroma Technology, Brattleboro, VT; 580 DRLP), which passes the fluorescence but reflects the excitation light, and two OG570 or OG590 (Schott Glass, Duryea, PA) long pass filters to further block the excitation beam were used in the fluorescence detection scheme.
Computer Modeling.
Computer modeling of the structure of the tRNAPhe–TMR adduct was carried out on an Indy Workstation (Silicon Graphics, Palo Alto, CA) using programs quanta 4.0 and charmm (Molecular Simulations, Burlington, MA), and the atomic coordinates of yeast tRNAPhe (26) obtained from the Brookhaven Protein Data Bank. The position U 8 of yeast tRNAPhe was replaced by s4U. The tRNAPhe–TMR structure was energetically minimized employing Basic Adopted Newton–Raphson Minimization.
RESULTS AND DISCUSSION
Single Molecule Studies.
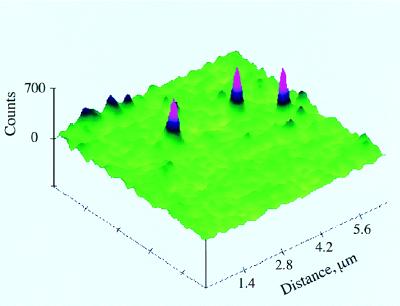
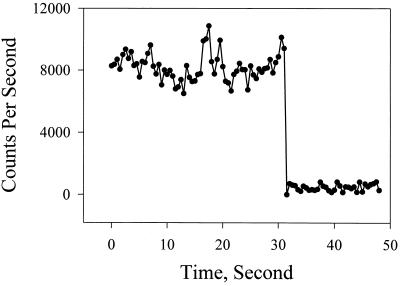
To detect and study single tRNAPhe–TMR adducts, molecules from 1 nM solutions were immobilized by deposition onto amino-propyl-silanized glass (13, 14) and washed by buffer. Fig. 1 shows fluorescence images of single tRNAPhe–TMR adducts under physiological conditions, monitored by the far-field scanning optical microscope. Time resolved experiments were carried out after zooming to individual spots. Under irradiation with 0.5 μW radiation and 9.5 MHz laser repetition rate, single molecules would last from a few seconds up to approximately 1 min before an irreversible photobleaching occurred. The photobleaching properties were used to decide whether single molecules were being detected from each of the observed fluorescence images. The probability of two molecules under the same conditions being photobleached at the same instant is negligible. The emission from a single molecule should be photobleached in one step, so that the sudden and almost complete disappearance of TMR fluorescence, as illustrated in Fig. 2, indicates that a single emitting molecule was present prior to photobleaching. In practice, the fluorescence signal does not completely disappear after photobleaching because there is a small background of known magnitude. Fig. 2 exhibits a typical background signal. The background signal was lowered by using fluorescence-free index matching oil in the confocal objective. In addition, the sample glass plate was treated with HF. When two adducts were present in the laser focus spot the signals showed two bleaching steps. These data were discarded. For samples without complete removal of nonspecifically bound TMR, we also observed that a small fraction of single complexes showed a double-step photobleaching, indicating that a 1:2 tRNAPhe–TMR adduct may also be present in small amounts in such preparations.
Figure 1.
Fluorescence images of individual 1:1 tRNAPhe–TMR adducts. The tRNAPhe–TMR adducts are attached to the surface of amino-propyl-silanized glass in aqueous buffer (50 mM Tris, pH 7.6/50 mM KCl/10 mM MgCl2/2.5 mM dithiothreitol).
Figure 2.
A sudden single-step bleaching of the 1:1 tRNAPhe–TMR adduct. This result is typical of the criterion used for each measurement to confirm that the signal originated from a single molecule. In this example, the molecule bleached after approximately 30 sec.
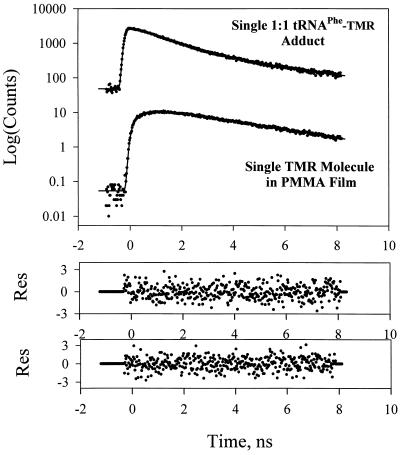
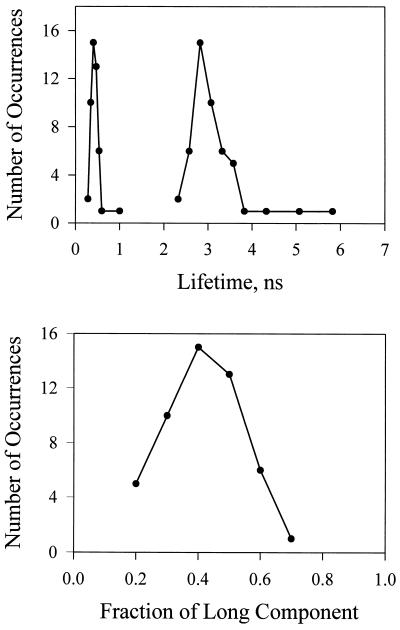
For about 65% of the fluorescence decays of single tRNAPhe–TMR adducts that were examined, the best fit was obtained with two decay components and typical χ2 values between 1.0 and 1.2. The use of double exponential decay kinetics decreases the χ2 by a factor of more than two. We also used the autocorrelation function of the fitting residue to test the fits to double exponential decays. For a good fit, the autocorrelation function of the fitting residue is flat and evenly distributed around zero. This residue autocorrelation function is a more sensitive indicator than χ2 when the total number of counts is low (27). The fitting procedure did not exclude three or more exponential decays but we chose the minimum number with satisfactory χ2 for this discussion. The two fluorescence lifetimes were evident for 50 of the 77 single TMR molecules that were examined: the most probable values for the lifetimes of the individual tRNAPhe–TMR adducts were 2.80 ± 0.10 ns and 0.55 ± 0.10 ns (Figs. 3 and 4). The short component is readily resolved by our instrument (instrument function of 200 ps). We discovered that the background counts near time zero increased significantly (four times) to ≈1,000 counts per second by adding pure water to the cell. However, this does not affect the nonexponential decay constants reported here. The background signal has an instrument limited time response: it is the Raman scattering of water involving a 1,648 cm−1 vibration (28). With 547 nm excitation, the Raman peak is expected at 601 nm. Such scattering has “zero” lifetime and does not affect our ability to identify the short fluorescence lifetime component whose lifetime of 0.5 ns is much longer than the instrument function. This scattering is reduced to negligible levels by a 10-nm band pass filter (580 nm), which also improves the fit in the first 100 ps time window without altering the nonexponential decay kinetic parameters. A striking feature in the distributions of observed lifetimes (Fig. 4) is the clear separation into two peaks. There are a few instances where the long component had a lifetime greater than 4 ns, which is close to the fluorescence lifetime in the polymer film (see below). The distribution of the rates of fluorescence for the long component is quite symmetric about the mean value. Most of the single tRNAPhe–TMR adducts exhibited almost equal amplitudes for the two component lifetimes (Fig. 4). The remaining 35% of the molecules studied exhibited single exponential decay. A systematic analysis of sample histories indicated that most of these molecules could be attributed to a preparation that may have been partially denatured. However, with such a small statistical sample, we cannot completely exclude that there is an equilibrium state of tRNAPhe–TMR that does not interchange with those discussed in this paper on the timescale of the experiments.
Figure 3.
Fluorescence decay of single TMR molecules in the 1:1 tRNAPhe–TMR adduct (Upper) and in the polymethylmethacrylate film (Lower). The nonexponential decay kinetics of the tRNAPhe–TMR adduct is evident when the signal is compared with the single exponential decay of the fluorescence of rhodamine in a polymer film. PMMA, polymethylmethacrylate.
Figure 4.
Probability distributions of fluorescence lifetimes (Upper) and amplitudes (Lower) observed from 50 single molecules. Each measurement satisfied the criteria of single-step bleaching.
Fluorescence decays of single TMR molecules in a polymethylmethacrylate film (Fig. 3) were also measured. The polymer provides a rigid environment for TMR. In contrast to the tRNAPhe–TMR adducts, the fluorescence of single molecules in the polymethylmethacrylate film exhibited exclusively single exponential decays: the fluorescence lifetime distribution peaked at 3.7 ns. Similar single exponential decays were observed previously in time-resolved investigations of single fluorescent molecules situated in polymer films (2–7). To the best of our knowledge, a nonexponential decay of fluorescence from a single molecule has not been previously reported.
We also evaluated the correlation coefficients, (α), associated with certain pairs of observables, and obtained the following results: fluorescence lifetimes and measurement period, α = 0.005; longer component lifetime and rate of light emission, α = −0.40; longer component lifetime and shorter component lifetime, α = 0.06; long lifetime decay constant and its amplitude, α = 0.27. A value of α close to zero means the variables are uncorrelated.
The Origins of Nonexponential Decay.
Nonexponential fluorescence decay kinetics from repeated measurements on a single molecule could be understood if, during the measurement, the molecule were able to undergo transitions between states having different fluorescence lifetimes. In the experiment, molecules would be selected from the equilibrium distribution in one of these states. After selection, during the measurement, the molecule could undergo transitions to other states. If the inverse rate coefficients corresponding to transitions between the states were all small compared with the time interval between excitations leading to a detected photon, then the measurements on a single molecule would effectively probe the equilibrium distribution for one of the molecules. If all possible equilibrium states in the ensemble were visited repeatedly on the timescale of the experiment, the same nonexponential kinetics would be observed for every molecule. If the molecules undergo dynamics that are slow compared with the measured period, then different molecules could exhibit exponential decays with different lifetimes. This explanation assumes that the nonexponentiality is arising from the dynamics in the ground-state equilibrium ensemble. Another limiting possibility is that the transitions between states is occurring only when the dye is electronically excited. If this were the situation, nonexponential kinetics will occur when the inverse rate coefficients are much shorter than the fluorescence lifetimes of any of the states of the tRNAPhe–TMR adduct (≈2.8 ns in one state and 0.5 ns in the other in this case).
We considered whether the distributions of lifetimes might arise from the different modes of binding tRNAPhe to the substrate. If this occurred, then different orientations of the probe would also arise. However, there is no significant correlation between count rate, which is largely determined by the probe transition dipole projection onto the electric field vector (7) and the lifetime. Surface effects on the lifetime may be less important in this case because the dye is imbedded in tRNAPhe. We also eliminated a simple rotation of the dye molecule as the cause of the short lifetime component. Overall, rotations occurring during the measurement should yield both rises and decays of the fluorescence signal. We did not observe any risetimes. Moreover, such overall motion most likely results in a continuous distribution of fluorescence lifetimes instead of two distinct distributions.
Only two states undergoing dynamics are required to fit the data within the signal-to-noise ratio of the experiments so a two-state model will be assumed in what follows. In the ground-state dynamics explanation, the equilibrium distribution contains the two states with comparable populations and the experiment involves the selection from the equilibrium distribution of either state with about equal probability. The dynamics must occur during the data acquisition periods. The lack of correlation between the two lifetimes and the observation period shows that the interstate dynamics is much faster than the total trajectory lengths. The autocorrelation function of the fluctuations in the data did not show any significant decay other than instrument drift over the 1–8-sec timescale. However, the effect of any stochastic fluctuations in the fluorescence spectra would have been partially suppressed by the use of a broad band filter in the detection system. The equilibration process could be occurring even faster than the 5.6 μsec average time between photon detection events. If the measurements referred to the excited-state quasi-equilibrium distribution, only a single state would be selected and excited by the pulse. Because the data show exclusively decay and no growth kinetics, any excited-state equilibration would be required to be completed much faster than the instrument response of 200 ps.
The experiment clearly identifies time-separated relaxation processes. The evolution into essentially two states is faster than the measurement. But the lifetime distributions must arise from an even longer timescale process. The relatively small correlation between decay time constant and amplitude of the long lifetime components indicates that there is both a distribution of lifetimes and amplitudes (see Fig. 4). The variations from molecule to molecule of both the long and short lifetimes show that in an ensemble measurement the measured lifetimes would represent the most probable values from distributions. These distributions are obtained from single molecule measurements but they are not available from bulk measurements. Since there was no correlation between the lifetime and the length of trajectory, we conclude that the distribution is static on the timescale of the measurements. Thus, the different lifetimes within the long and short lifetime distributions correspond to different conformational states of the tRNAPhe–TMR adduct that are not rapidly interconnecting on the timescale of minutes at ambient temperature. It appears as if the fast jumps between the small numbers of states giving rise to the nonexponential fluorescence decay are occurring in a very slowly evolving distribution of more global conformations.
Relationship to Structure.
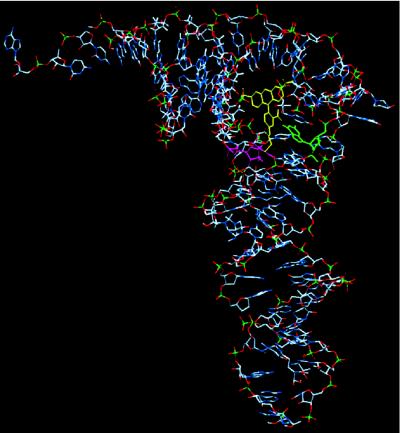
The two-state equilibrium being established during the measurement involves transitions between two conformations of the tRNAPhe–TMR adduct. These conformations are distinguished by their different fluorescence lifetimes for the probe. The dynamics appears to involve a relative motion of TMR and tRNAPhe, which modifies the environment of the TMR inside tRNAPhe. The dramatic shortening of the lifetime in one of the substates must involve fluorescence quenching, which is much less efficient or essentially absent in the other state. It is well known that the fluorescence of rhodamines is quenched by guanosine (22, 29, 30) through a mechanism that involves the formation of a complex. None of the other RNA bases have been found to cause significant quenching of rhodamine fluorescence. Computer modeling of the tRNAPhe–TMR structure suggests that the fluorescence probe is located in the internal pocket of tRNAPhe situated between the D loop, variable loop, and T arm (Fig. 5). The only one guanosine, G15, is located in the close vicinity (≈2–5 Å) of the TMR. Moreover, in one favorable configuration for TMR, the H-10 atom of G15 and the O-3 atom of TMR are separated only by 1.9 Å and could form a hydrogen bond. The conventional absorption and fluorescence maxima (λmaxA = 561 nm and λmaxF = 586 nm, respectively) of tRNAPhe–TMR adducts are significantly different from the corresponding maxima of free TMR in solution (λmaxA = 550 nm and λmaxF = 575 nm), consistent with the TMR molecule being covalently bound to s4U and situated in the tRNAPhe interior, such that its spectroscopic characteristics should reflect the structural–dynamical properties of tRNAPhe. The presence of negatively charged phosphate groups of tRNAPhe nucleotides within ≈3 Å of TMR can explain the large red shifts of λmaxA and λmaxF in comparison with the corresponding maxima in buffer solutions. The observed narrow distribution of quenched lifetimes of single molecules (Fig. 4) is consistent with fluorescence quenching, which requires a specific tRNAPhe–TMR structure to be formed. The long-component lifetimes fall close to the range of those of the free, unquenched rhodamine. The simulation also shows that there are a few energetically accessible locations for the probe where such quenching by guanosine would be absent. This model implies that the transition between the two states would require the breaking of a hydrogen bond and a local structural reorganization of the tRNAPhe.
Figure 5.
Simulated structure of the 1:1 tRNAPhe–TMR adduct. TMR is yellow, s4U pink, and G15 green.
Conclusions.
The study of nonexponential fluorescence decays for single molecules permits new features of the dynamics of single biological units to be examined. Not only can lifetimes and statistical weights be measured over a wide range of time scales, but the development of the equilibrium distribution can be examined in certain cases. Evolution on the time scale of milliseconds to minutes, which is often very difficult to examine in bulk samples using fluorescence probes, can be seen in the correlations between the observed nonexponentiality and the location along the single molecule trajectory. In this case, the results show unequivocally that the two fluorescent states seen in the equilibrium distribution arise from only one molecule of tRNAPhe, information that is not available from bulk fluorescence measurements. Furthermore, the photon counting trajectories could be directly compared with molecular dynamic simulations. In general, if competing molecular processes do not take place during the data collection, the single fluorescent molecule must decay according to an exponential law. In our time-resolved experiments, individual TMR molecules survived from a few seconds to one minute before being photochemically destroyed. Taking into account the instrument response function of 200 ps, we see that on a time scale from hundreds of picoseconds to tens of seconds the TMR molecule located in the tRNAPhe pocket is undergoing environmentally induced jumps between conformational states.
Summing up results on the fluorescence lifetime measurements of single tRNAPhe–TMR adducts, we propose the following model. In the tRNAPhe–TMR adducts, TMR is located in the immediate vicinity of G15, which influences the spectroscopic properties of the probe, causing efficient quenching of its fluorescence. The relative spatial dispositions of G15 and TMR change with a characteristic rate that is an intrinsic property of the tRNA structure. Distributions of lifetimes for the fluorescent probe are measured to provide information not available from bulk measurements. This report is a direct observation of multistate structural fluctuations in biology on the single molecule level. This spectroscopic study of single tRNAPhe–TMR adducts provides the basis for future investigations of dynamical properties of single ribosomal complexes, which will allow us to monitor the sequence of molecular events taking place during protein biosynthesis on the picosecond to second time scale.
Acknowledgments
The research was supported by National Institutes of Health Grants GM12592 (R.M.H.) and GM53416 (B.S.C.) and National Institutes of Health Research Resource Grant RR01348–14.
ABBREVIATION
- TMR
tetramethylrhodamine
References
- 1.Betzig E, Chichester R. Science. 1993;262:1422–1425. doi: 10.1126/science.262.5138.1422. [DOI] [PubMed] [Google Scholar]
- 2.Ambrose W P, Goodwin P M, Martin J C, Keller R A. Science. 1994;265:364–367. doi: 10.1126/science.265.5170.364. [DOI] [PubMed] [Google Scholar]
- 3.Xie X S, Dunn R C. Science. 1994;265:361–364. doi: 10.1126/science.265.5170.361. [DOI] [PubMed] [Google Scholar]
- 4.Bian R X, Dunn R C, Xie X S, Leung P T. Phys Rev Lett. 1995;75:4772–4775. doi: 10.1103/PhysRevLett.75.4772. [DOI] [PubMed] [Google Scholar]
- 5.Trautman J K, Macklin J J, Brus L E, Betzig E. Nature (London) 1994;369:40–42. [Google Scholar]
- 6.Macklin J J, Trautman J K, Harris T D, Brus L E. Science. 1996;272:255–258. [Google Scholar]
- 7.Trautman J K, Macklin J J. Chem Phys. 1996;205:221–229. [Google Scholar]
- 8.Eigen M, Rigler R. Proc Natl Acad Sci USA. 1994;91:5740–5747. doi: 10.1073/pnas.91.13.5740. [DOI] [PMC free article] [PubMed] [Google Scholar]
- 9.Funatsu T, Harada Y, Tokunaga M, Saito K, Yanagida T. Nature (London) 1995;374:555–559. doi: 10.1038/374555a0. [DOI] [PubMed] [Google Scholar]
- 10.Dunn R C, Holtom G R, Mets L, Xie X S. J Phys Chem. 1994;98:3094–3098. [Google Scholar]
- 11.Nie S, Chiu D T, Zare R N. Science. 1995;266:1018–1021. doi: 10.1126/science.7973650. [DOI] [PubMed] [Google Scholar]
- 12.Haab B B, Mathies R A. Anal Chem. 1995;67:3253–3260. doi: 10.1021/ac00114a023. [DOI] [PubMed] [Google Scholar]
- 13.Ha T, Enderle T, Ogletree D F, Chemla D S, Selvin P R, Weiss S. Proc Natl Acad Sci USA. 1996;93:6264–6268. doi: 10.1073/pnas.93.13.6264. [DOI] [PMC free article] [PubMed] [Google Scholar]
- 14.Ha T, Enderle T, Chemla D S, Selvin P R, Weiss S. Phys Rev Lett. 1996;77:3979–3982. doi: 10.1103/PhysRevLett.77.3979. [DOI] [PubMed] [Google Scholar]
- 15.Dickson R M, Norris D J, Tzeng Y-L, Moerner W E. Science. 1996;274:966–969. doi: 10.1126/science.274.5289.966. [DOI] [PubMed] [Google Scholar]
- 16.Schmidt T, Schütz G J, Baumgartner W, Gruber H J, Schindler H. Proc Natl Acad Sci USA. 1996;93:2926–2929. doi: 10.1073/pnas.93.7.2926. [DOI] [PMC free article] [PubMed] [Google Scholar]
- 17.Vale R D, Funatsu T, Pierce D W, Romberg L, Harada Y, Yanagida T. Nature (London) 1996;380:451–453. doi: 10.1038/380451a0. [DOI] [PMC free article] [PubMed] [Google Scholar]
- 18.Sase I, Miyata H, Corrie J E T, Craik J S, Kinosata K., Jr Biophys J. 1995;69:323–328. doi: 10.1016/S0006-3495(95)79937-4. [DOI] [PMC free article] [PubMed] [Google Scholar]
- 19.Goodwin P M, Ambrose W P, Keller R. Acc Chem Res. 1996;29:607–613. [Google Scholar]
- 20.Wang J, Wolynes P. Phys Rev Lett. 1995;74:4317–4320. doi: 10.1103/PhysRevLett.74.4317. [DOI] [PubMed] [Google Scholar]
- 21.Parkhurst K M, Parkhurst L J. Biochemistry. 1995;34:293–300. doi: 10.1021/bi00001a036. [DOI] [PubMed] [Google Scholar]
- 22.Edman L, Mets U, Rigler R. Proc Natl Acad Sci USA. 1996;93:6710–6715. doi: 10.1073/pnas.93.13.6710. [DOI] [PMC free article] [PubMed] [Google Scholar]
- 23.Bulychev N V, Graifer D M, Karpova G G, Lebedev A V. Bioorg Khim. 1988;14:27–30. [PubMed] [Google Scholar]
- 24.Johnson A E, Adkins H J, Matthews E A, Cantor C R. J Mol Biol. 1982;156:113–140. doi: 10.1016/0022-2836(82)90462-4. [DOI] [PubMed] [Google Scholar]
- 25.Holtom G. Proc SPIE Int Soc Opt Eng. 1990;1204:2–12. doi: 10.1117/12.17758. [DOI] [PMC free article] [PubMed] [Google Scholar]
- 26.Hingerty B, Brown R S, Jack A. J Mol Biol. 1978;124:523–534. doi: 10.1016/0022-2836(78)90185-7. [DOI] [PubMed] [Google Scholar]
- 27.Grinvald A, Steinberg I Z. Anal Biochem. 1974;59:583–598. doi: 10.1016/0003-2697(74)90312-1. [DOI] [PubMed] [Google Scholar]
- 28.Rao I R, Koteswaran P. J Chem Phys. 1937;5:667. [Google Scholar]
- 29.Sauer M, Han K-T, Müller R, Nord S, Schulz A, Seeger S, Wolfrum J, Arden-Jacob J, Deltau G, Marx N J, Zander C, Drexhage K H. J Fluorescence. 1995;5:247–261. doi: 10.1007/BF00723896. [DOI] [PubMed] [Google Scholar]
- 30.Widengren J, Dapprich J, Rigler R. Chem Phys. 1997;216:417–426. [Google Scholar]


