Abstract
Activation of the G protein-coupled receptor rhodopsin involves both the motion of transmembrane helix 6 (TM6) and proton exchange events. To study how these activation steps relate to each other, spin-labeled rhodopsin in solutions of dodecyl maltoside was used so that time-resolved TM6 motion and proton exchange could each be monitored as a function of pH and temperature after an activating light flash. The results reveal that the motion of TM6 is not synchronized with deprotonation of the Schiff base that binds the chromophore to the protein but is an order of magnitude slower at 30°C. However, TM6 motion and the uptake of a proton from solution in the neutral pH range follow the same time course. Importantly, the motion of TM6 is virtually independent of pH, as is Schiff base deprotonation under the conditions used, whereas proton uptake titrates with a pK of 6.5. This finding shows that proton uptake is a consequence rather than a cause of helix motion. Activated rhodopsin binds to and subsequently activates the cognate G protein, transducin. It has been shown that peptides derived from the C terminus of the transducin α-subunit mimic in part binding of the intact G protein. These peptides are found to bind to rhodopsin after TM6 movement, resulting in the release of protons. Collectively, the data suggest the following temporal sequence of events involved in activation: (i) internal Schiff base proton transfer; (ii) TM6 movement; and (iii) proton uptake from solution and binding of transducin.
Keywords: G protein-coupled receptor, membrane proteins, spin labeling, retinal protein, photorecptor
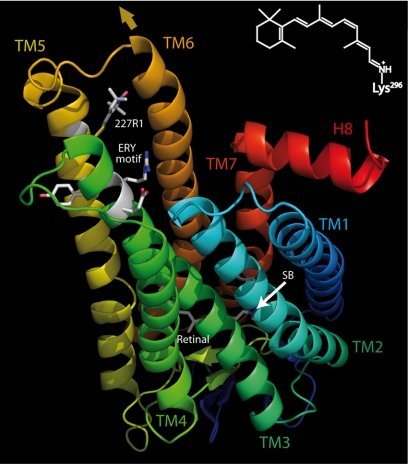
G protein-coupled receptors (GPCRs) are seven transmembrane helix (TM) proteins. After receiving a chemical or physical stimulus such as ligand binding or photon absorption, they are activated and catalyze nucleotide exchange in heterotrimeric G proteins (Gαβγ) (1, 2). Rhodopsin is the prototype and eponym of the largest class of GPCRs, the rhodopsin-like receptors (class A). Rhodopsin consists of the apoprotein opsin and the covalently bound chromophore 11-cis-retinal, which is connected to the protein through a protonated Schiff base to Lys-296 (SB; Fig. 1 Inset). Absorption of a photon by dark rhodopsin (ground state) leads to fast isomerization of the 11-cis-retinal to the all-trans configuration. After several short-lived photointermediates (photo-, batho-, lumirhodopsin), rhodopsin finally arrives at a pH- and temperature-dependent equilibrium between the two states metarhodopsin I (MI) and metarhodopsin II (MII) (3). In the MI state, the retinal SB is still protonated. Deprotonation of the SB by internal proton transfer occurs during transition to MII and can be tracked by the blue shift of the UV/visible absorption maximum (λmax,rhodopsin = 500 nm to λmax,MII = 380 nm). Importantly, MII formation is linked to the uptake of a proton from the aqueous phase (4–6).
Fig. 1.
Structure of rhodopsin. Rhodopsin [Protein Data Bank (PDB) ID code 1GZM (56)] is shown with the cytoplasmic face on top. Transmembrane helices (TM) are labeled with their respective numbers. The chromophore 11-cis-retinal is bound by a protonated SB to Lys-296 in TM7 (shown as stick model). (Inset) Protonated retinal SB with ε-amino group of Lys-296. The rigid body motion of the cytoplasmic half of TM6 is indicated by the brown arrow. Side chains of amino acids of the conserved ERY motif as well as the spin label side chain (R1) at position 227 (in TM5) are shown as sticks.
A paradigm of rhodopsin activation arose from photointermediate measurements. It was recognized that the interaction of rhodopsin with its G protein transducin (Gtαβγ) shifts the MI/MII equilibrium toward MII (7, 8). The simplest explanation of the data was that the deprotonation of the SB is the event that switches the receptor into its active state and that the MII thus formed is identical with the G protein-binding state. However, later kinetic studies on solubilized rhodopsin revealed an additional isochromic intermediate in which the SB deprotonated, characteristic of MII formation, but proton uptake from solution had not yet occurred. This state was termed MIIa to distinguish it from the fully active state MIIb subsequently formed by proton uptake (9). Thus, MII is composed of both states. MII in dodecyl maltoside (DM) detergent solution exists as a receptor monomer that activates Gt very efficiently (10). Proton uptake during formation of MIIb involves the ERY region near the cytoplasmic surface of TM3, which is conserved in GPCRs [Glu-134/Arg-135/Tyr-136 in rhodopsin, Fig. 1 (11)]. These findings suggested a two-step activation scheme, in which the loss of the proton from the retinal SB and the uptake of a proton to the ERY region marked two consecutive transitions (12–15). Early products with a deprotonated Schiff base (16) and MI-like products that interact with the G protein but do not release GDP from the G protein nucleotide-binding site (17) have been described. However, it is MIIa and MIIb that are central to the activation of the receptor as a catalyst of nucleotide exchange in the G protein. Current models of the catalytic process involve two steps of interaction between G protein and activated rhodopsin (18–20). These steps may correspond to two or more isospectral forms of MII (21).
A second paradigm of rhodopsin activation was derived from site-directed spin labeling (SDSL). In SDSL, a “sensor” nitroxide side chain, designated R1, is introduced into the protein at a site of interest. The EPR spectrum of the labeled protein reflects the motion of the nitroxide that is in turn determined by interactions of the nitroxide with the local environment. Thus, changes in protein conformation are detected as changes in the EPR spectrum (22). Extensive SDSL studies of rhodopsin in both DM micelles and phospholipid bilayers revealed that the major light-induced conformational change is a “rigid-body” motion of TM6 outward and toward TM5 at the cytoplasmic surface of the protein (23–26). Such displacements of individual TM helices were not evident in recent crystallographic studies (27), but the crystal lattice environment could well limit the degree of conformational change (28), as is observed for other membrane proteins (29). The SDSL work has specifically shown that, for example, R1 at position 227 (227R1, Fig. 1) is partially immobilized by the outward motion of TM6 that engages the nitroxide in new interactions (23). Previous work has shown that conformational changes on the cytoplasmic surface of rhodopsin occurred with formation of MII, but the spin labels in TM3 and H8 locus of spin label attachment in TM3 of rhodopsin did not directly reflect the major TM6 motion addressed here (30).
In the present work, time-resolved EPR spectroscopy employing rhodopsin 227R1 allows us to elucidate how TM6 motion is interlinked with the two steps in the activation process deduced from the proton transfer data. We find that TM6 motion does not coincide with SB deprotonation (formation of MIIa) but occurs in a separate delayed step with the kinetic properties of proton uptake (formation of MIIb). Although proton uptake kinetically coincides with TM6 motion, it is not the cause but rather a consequence of TM6 motion.
Results
Resolution of MII Formation and Proton Uptake.
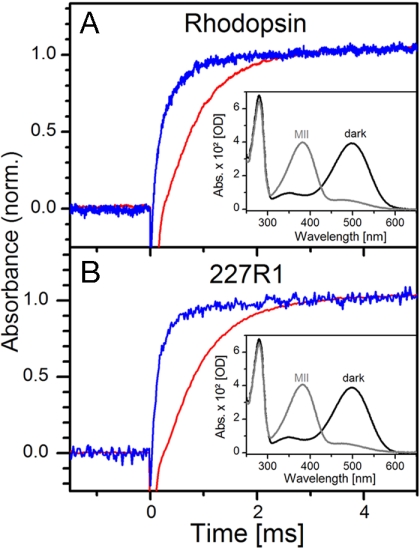
The identical UV/visible spectra of wild-type (WT) rhodopsin and sensor mutant 227R1 in both the dark and photoactivated states are shown in Fig. 2 A and B Insets; in solutions of DM, the photoactivated state is nearly all MII. The kinetics of MII formation after a light flash were monitored at 380 nm (λmax of MII); proton uptake kinetics at pH 6 were observed as deprotonation of bromocresol purple (BCP) in aqueous solution at 595 nm (see Materials and Methods). Fig. 2A shows the simultaneous measurement of MII formation (blue trace) and proton uptake (red trace) on the same sample of WT rhodopsin in DM. The proton uptake signal is delayed with respect to MII formation, as reported earlier (9). Control measurements in which proton jumps were generated by applying UV flashes to a “caged” proton compound (31) revealed that neither reaction time of the dye nor diffusion is rate-limiting (see also refs. 9 and 32). In rhodopsin 227R1, MII formation is somewhat accelerated compared with WT (Fig. 2B), but the delay between MII formation and the proton signal remains. Calibration of proton uptake signals as described in ref. 32 yields an uptake of one proton per activated rhodopsin molecule.
Fig. 2.
Formation of MII and proton uptake. (A) Time course of MII formation (blue trace) and proton uptake (red trace) at 20°C and pH 6.0 monitored as absorbance changes at 380 nm (for rhodopsin) and at 595 nm (for BCP), respectively (see Materials and Methods). (Inset) UV/visible spectrum of WT rhodopsin in the dark (black trace) and after photoactivation (gray trace). After photoactivation, the MII state predominates in DM solutions. (B) The same data collected for rhodopsin 227R1.
Kinetics of TM6 Motion.
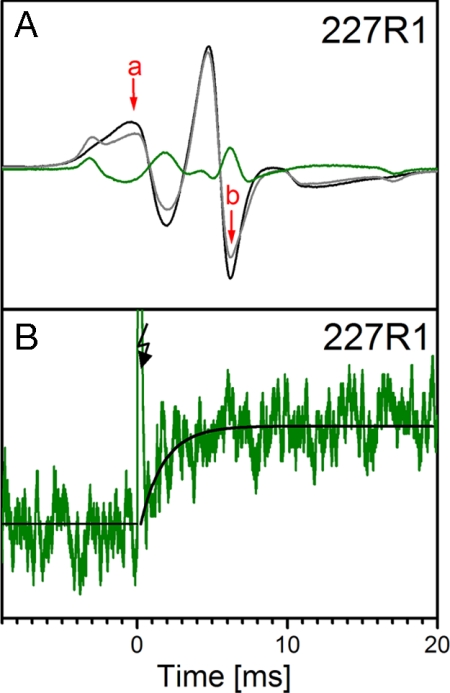
As mentioned above, 227R1 at the cytoplasmic end of TM5 is well suited to detect the rigid-body motion of TM6 as a partial immobilization of the nitroxide. The change in the EPR spectrum of rhodopsin 227R1 upon light activation along with the difference spectrum between the light-activated and the dark state is shown in Fig. 3A (black, dark state; gray, light-activated state; green, difference spectrum). The field positions where changes were largest were selected for kinetic measurements (center trough, arrow b; or the low-field peak, arrow a). A typical time course for the change in EPR signal recorded at position b after a single light flash at 20°C is shown in Fig. 3B along with the fit to a single exponential.
Fig. 3.
EPR spectra of rhodopsin 227R1 and time-dependent changes upon photoactivation. (A) Spectra in the dark state (black) and photoactivated state (gray). The difference spectrum is shown in green, and the two spectral positions used for time-resolved experiments are marked a and b. (B) Time-resolved change in the EPR intensity of 227R1 at 20°C and pH 6.25 after a 10-ns light flash at 500 nm (spectral position b). The solid black trace after the flash artifact (arrow) is a single exponential of time constant 1.9 ms.
Temperature Dependence of SB Deprotonation, TM6 Movement, and Proton Uptake.
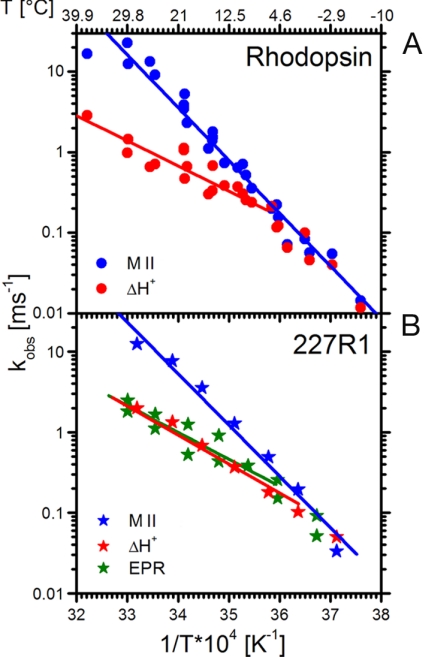
Schiff base deprotonation, monitored by the formation of MII (i.e., the sum of MII subforms with absorption maxima at 380 nm), proton uptake, and changes in spin label mobility have been measured as described above at different temperatures but otherwise identical conditions and fitted with single exponential kinetics. The data for MII formation (blue dots) and proton uptake (red dots) of WT rhodopsin are summarized in the Arrhenius plot of Fig. 4A, which reproduces earlier findings (9). The same measurements on rhodopsin 227R1 showed that the proton uptake kinetics are similar to those for WT rhodopsin with the same activation energy (Fig. 4B). The kinetic data for the EPR change of 227R1 (Fig. 4B, green stars) show substantial scatter caused by the noise in the single-flash traces, but it is clear that the kinetics follow more closely those of proton uptake rather than SB deprotonation. Data for MII formation and the EPR change were also collected with buffer-free samples as used for monitoring proton uptake, with results similar to those shown in Fig. 4 (data not shown; see Materials and Methods).
Fig. 4.
Arrhenius plots of the rate constants for MII formation, proton uptake, and TM6 motion. (A) WT rhodopsin in DM. MII formation (blue dots) and proton uptake (red dots) were measured by 380-nm and 595-nm absorbance changes, respectively. (B) The same data for rhodopsin 227R1 in DM, including rate data from EPR measurements that reflect TM6 movement (green stars). Estimates in the errors involved in the EPR measurements are provided by the differences in duplicate measurements made for most temperatures.
In both Arrhenius plots of Fig. 4, MII formation shows the steepest slope, reflecting the largest activation energy. Proton uptake displays a shallower temperature profile and runs parallel with TM6 motion as measured by the EPR change. At low temperatures, the formation of MII becomes rate-limiting, and all three processes run parallel with the formation of MII.
pH Dependence of SB Deprotonation, TM6 Movement, and Proton Uptake.
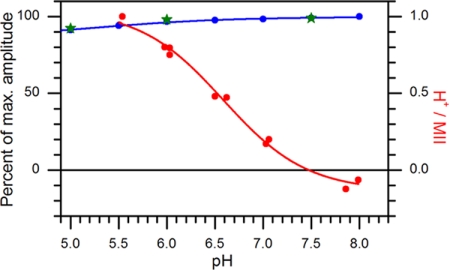
The extent of Schiff base deprotonation, monitored by MII formation, stays constant in the neutral range of pH for rhodopsin in solutions of DM (Fig. 5, blue dots), as observed (9). The slight decrease in the amount of MII at acidic pH is most likely caused by a MII product with a reprotonated SB (33–35). The amplitude of the light-induced EPR transient from rhodopsin 227R1 (Fig. 5, green stars) and EPR spectra (data not shown) also stay essentially constant within the accessible range of pH. However, the proton uptake signal titrates with a pKa of ≈6.5 (red dots). As will be discussed below, the data show that TM6 motion, reflected in the EPR signal arising from rhodopsin 227R1, precedes and is uncoupled from proton uptake.
Fig. 5.
pH dependence of MII formation, proton uptake, and TM6 motion. The percentages of maximum amplitude of the 380-nm absorbance change (MII formation, blue dots) and of the EPR transient (TM6 movement, green stars) are plotted vs. pH. For proton uptake (red dots), the ratio of protons to MII (right ordinate) determined from the 595-nm absorbance change is plotted; the solid curve is a fit to a single proton-binding site of pKa = 6.6.
Effect of Gt-Derived Peptides on External Proton Exchange and TM6 Movement.
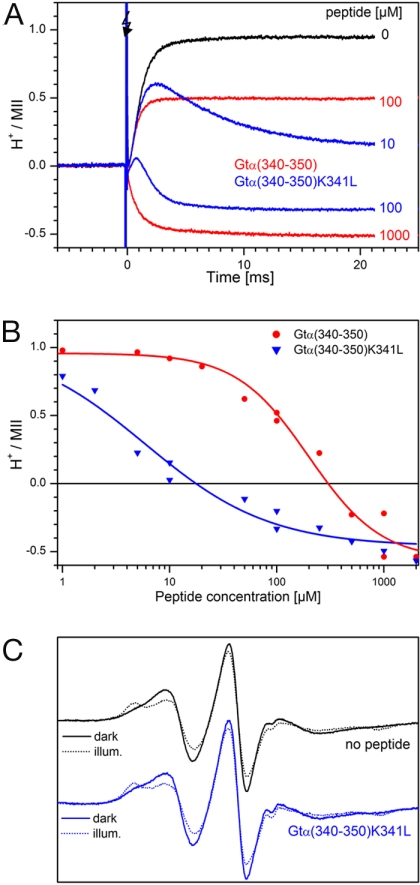
A peptide derived from the C terminus of Gtα [Gtα(340–350)] is known to stabilize MII (18, 36). This peptide is believed to mimic salient features of G protein binding but avoids the complex protonation changes observed with the intact G protein (37), which would obscure protonation changes arising exclusively from conversions in the active receptor. The influence of this peptide as well as a high-affinity analog on proton uptake observed after an activating light flash is shown in Fig. 6A. Formation of MII was not influenced by the peptides (data not shown). Peptide Gtα(340–350) (red traces) shows a pronounced reduction of proton uptake at 100 μM peptide and induces a proton release of ≈0.5 protons per activated rhodopsin at a 1 mM concentration. The high-affinity analog peptide, Gtα(340–350)K341L (19, 38), shows a transient proton uptake at intermediate concentrations. This behavior is consistent with slower binding of the peptide that acts at lower concentration, allowing a proton to be taken up before significant binding of the peptide has occurred. Thus, TM6 movement (reflected by proton uptake) apparently precedes peptide binding. It should be noted that these proton transfer events measured with a soluble indicator dye cannot tell whether the released protons originate from sites at which they were previously taken up or whether new sites are involved. In addition, it remains open whether each individual rhodopsin molecule must go through the protonated state to bind the peptide. The proton release caused by peptide binding does not depend on specific protonatable groups in the peptide itself [supporting information (SI) Table 1], and it can be concluded that it is rhodopsin on which the changes of protonation occur.
Fig. 6.
Proton uptake and release upon activation of native rhodopsin in the presence of synthetic peptides derived from the C terminus of the Gtα subunit. The proton transfer was measured by changes in the 595-nm absorbance of BCP (see Materials and Methods). (A) Peptide Gtα(340–350) (NH2-IKENLKDCGLF-COOH, red traces) and the high-affinity analog Gtα(340–350)K341L (NH2-ILENLKDCGLF-COOH, blue traces) (19, 38). In both cases, the peptide affects net proton uptake (see text). (B) Plot of the final level of net proton uptake against peptide concentration; the solid lines are drawn to guide the eye. (C) (Upper) EPR spectra of 15 μM rhodopsin 227R1 in the dark state (black line) and after 15-s illumination (with a 515-nm cut-off filter, black dotted line). (Lower) Spectra as in Upper in the presence of 1 mM Gtα(340–350)K341L peptide.
Final levels of the proton exchange as a function of peptide concentration are plotted in Fig. 6B for the two peptides. Both peptides cause net proton release at sufficiently high concentration; the higher affinity of Gtα(340–350)K341L is reflected in the much lower peptide concentration needed to suppress proton uptake.
The effect of peptides on the proton exchange reactions in rhodopsin 227R1 (data not shown) is essentially identical to that illustrated in Fig. 6A for WT rhodopsin. However, the EPR spectra of 227R1 in both the dark- and light-activated states is unchanged by the presence of peptide (Fig. 6C), suggesting that the peptide binds to a state of rhodopsin with TM6 tilted outward, the same conclusion as drawn above based on the kinetics and pH dependence of proton exchange. Janz and Farrens (39) have implicated residues 226, 229, and 230, located on the inner surface of TM5, in the binding of a peptide similar to Gtα(340–350). The fact that the EPR spectrum of 227R1 on the outer surface of TM5 is not altered upon peptide binding indicates that there is little induced change in structure in this region caused by peptide binding.
Discussion
The present work was conducted to elucidate the relationship between the Schiff base deprotonation, TM6 motion and proton uptake steps involved in the activation of rhodopsin. The results obtained may generally reflect the behavior of all rhodopsin-like GPCRs. Indeed, TM6 motion appears to be a central event in all members of the family (40), and evidence for an involvement of proton uptake in the activation process has been provided for the α1B-adrenergic receptor (41), the β2-adrenergic receptor (42) and the thrombin receptor PAR1 (43). In the following paragraphs, the major conclusions are summarized in relation to the activation mechanism of rhodopsin.
Helix Movement Is Not Linked to SB Deprotonation but Occurs in a Separate Transformation.
The Arrhenius representation of the kinetic data in Fig. 4 reveals that at sufficiently low temperature, TM6 motion (measured by EPR changes) and SB deprotonation (measured by the rise of 380-nm absorbance) have the same kinetics. However, at higher temperatures, TM6 motion is clearly slower than SB deprotonation and has lower activation energy. The overall picture is consistent with a reaction scheme in which SB deprotonation sets the stage for TM6 motion that follows at a significantly slower rate.
Proton Uptake Is a Consequence of TM6 Movement.
In contrast to SB deprotonation, proton uptake from the aqueous phase coincides kinetically with TM6 motion at all temperatures. Viewed as separate steps, one of the reactions must therefore be rate-limiting, with the other occurring on a faster time scale. Thus, the kinetic data alone leave open whether TM6 motion is cause or consequence of proton uptake; proton uptake could either mark the neutralization (by protonation) of a cytoplasmic key residue, triggering movement of TM6, or TM6 motion could occur first, leading to the exposure of protonatable group(s) followed by fast proton uptake. The pH-dependent data allow us to resolve this issue. As Fig. 5 shows, TM6 motion occurs with its full-maximum amplitude at pH > 7, i.e., when proton uptake essentially does not occur, which proves that the proton uptake reaction is a consequence of TM6 motion rather than its necessary precursor.
This result, together with the similarity of the Arrhenius plots for proton uptake and TM6 motion (Fig. 4), allows an extension of the interpretation of earlier work that postulated two forms of MII in a pH-dependent equilibrium [MIIa (SB deprotonated) and MIIb (SB protonated proton taken up from the aqueous phase)]. The original MI ⇄ MIIa ⇄ MIIb scheme (9) can now be modified to that shown in Scheme 1. It should be noted that in solutions of DM, the MIIa ⇄ MIIb equilibrium is shifted far to the right, as shown by the lack of pH dependence for the TM6 movement detected by 227R1.
Scheme 1.
The highly conserved ERY motif at the cytoplasmic end of TM3 includes Glu-134 (Fig. 1). Proton uptake is likely to occur to this group and/or the cluster to which it belongs (11, 44). The shift of the pKa relative to an isolated Glu residue may be the result of the influence of the local environment (“forced protonation”) (13, 45).
Peptide Binding Occurs to the State of Rhodopsin with TM6 in the Outward Tilted Position.
C-terminal peptides derived from the Gtα subunit correspond to a key rhodopsin interaction site on Gt (18, 19). The peptides cause a release of protons on the background of light-induced proton uptake (Fig. 6 and SI Table 1). This release is seen from the behavior of the Gtα-derived high-affinity analog peptides, which bind slowly enough at low concentration to allow accumulation of MIIbH+ so that a transient protonation is seen (Fig. 6A). The rising phase occurs with a rate similar to TM6 motion (measured by the proton uptake in the absence of peptide), whereas the falling phase is faster the more peptide is present, in agreement with a bimolecular reaction between the active receptor and the peptide. At high concentrations of peptides, the peptide-induced proton release is so fast that net protonation equilibrates during the rise of the protonation signal so that a transient is no longer observed. These qualitative observations fit well with the conclusion that the outward position of TM6 is adopted before proton uptake has occurred and that peptide binding occurs only to the state of rhodopsin with TM6 in the tilted position. The net release of protons at saturating peptide concentrations indicates that additional groups on rhodopsin are deprotonated upon peptide binding. Further evidence that the C-terminal Gtα-derived peptides bind to this “open” state of the receptor comes from the lack of an effect of peptide binding on the EPR spectrum of 227R1 in the light-activated state (Fig. 6C) and the fact that rhodopsin mutants that block the motion of TM6 also block transducin activation (24, 46).
The C terminus of Gtα (represented by the synthetic peptides) has been described to be the “latch” for the activation of the G protein (47) and to undergo a conformational change upon rhodopsin binding (48–50). Its interaction with rhodopsin may be part of a sequential fit mechanism (19, 20) that also involves interactions with the C terminus of Gtγ. These interactions may involve different conformational states of MII (18, 21).
Conclusions
In summary, there are two important conclusions from this work. The first is that TM6 motion is a thermally activated process after the Schiff base deprotonation, which is driven by chromophore isomerization, eliminating the possibility that the motion of TM6 is directly driven by the chromophore isomerization and that such motion forces a concerted deprotonation of the Schiff base. The second is that the proton uptake from solution, presumably to Glu-134 of the ERY motif of rhodopsin, follows movement of TM6 and is not the cause but a result of helix motion. The proton uptake is likely due to a change in the pKa of Glu-134 resulting from the conformational change involving motion of TM6. Consistently, TM6 motion is the rate-limiting step for proton uptake. As expected, binding of C-terminal peptides from the α-subunit of transducin occurs after TM6 movement, which opens a cavity in the rhodopsin molecule; the binding step involves the exchange of additional protons from the rhodopsin molecule.
Materials and Methods
Preparation and Spin Labeling of Recombinant Bovine Rhodopsin.
Using standard cloning procedures, codon alterations corresponding to C140S/V227C/C316S replacements were introduced into the synthetic opsin gene cloned into the mammalian expression vector pMT3 (51). The mutant opsin was expressed in COS-1 cells, reconstituted with 11-cis-retinal and purified in DM solution by using an immunoaffinity procedure as described in ref. 52. While bound to the immunoaffinity resin, the pigment was reacted with 1-oxyl-2,2,5,5-tetramethyl-3-pyrroline-3-methanethiosulfonate spin label (kindly provided by Kalman Hideg, University of Pécs, Hungary) as described in ref. 53. Rhodopsin was eluted in 20 mM 1,3-bis[tris(hydroxymethyl)methylamino]propane (BTP, pH 6), 0.03% (wt/vol) DM, and 100 μM 1D4-peptide corresponding to C-terminal amino acids 330–348 of rhodopsin. For EPR spectroscopy, spin-labeled rhodopsin 227R1 was concentrated to 10–20 μM (steady-state measurements) and up to 600 μM (time-resolved measurements) by using Centricon concentrators (30-kDa exclusion limit; Millipore).
Preparation of Rhodopsin from Bovine Rod Cells.
Rod outer segment membranes were prepared as described in ref. 54. Rhodopsin was purified after solubilization with 1% (wt/vol) DM by using a ConA affinity batch procedure (ConA Sepharose 4B; GE Healthcare) and eluted in 20 mM BTP (pH 6.0), 0.03% DM, and 250 mM methyl-α-d-mannopyranoside. Under these conditions, the MI/MII equilibrium is fully shifted to MII (data not shown and ref. 13).
UV/Visible Spectroscopy.
Absorption spectra were taken at 20°C with a Varian Cary 50 Bio UV/visible spectrophotometer with a resolution of 1 or 2 nm. For each sample, absorption spectra between 250 and 650 nm were recorded in the dark and after illumination of the sample for 15 s with orange light using a 150-W fiberoptic light source equipped with a long pass (Schott GG 495) and a heat protection filter.
EPR Measurements.
EPR measurements were taken on a Bruker E580 spectrometer with a rectangular loop gap resonator (55) or a high-sensitivity resonator manufactured by Bruker. Samples were contained in Suprasil flat cells. CW spectra were obtained with a 100-G scan width and a 4-G modulation at a 100-kHz modulation frequency. The samples were adjusted to the designated temperature with nitrogen blown through the insulated resonator, the temperature being measured inside the flat cell with a microprobe.
For time-resolved measurements, the field position was fixed at the center field line trough (indicated by arrow b in Fig. 3A) or at the low field peak (indicated by arrow a in Fig. 3A). The transient change of the EPR signal after photoexcitation was recorded in a digital oscilloscope (LeCroy Waverunner 2). Temperature was controlled by a nitrogen flow system manufactured by Bruker in the range between 0 and 30°C. The sample was illuminated by using a YAG laser (Opotek) with a 10-ns pulse at 500-nm wavelength and an energy of ≈5 mJ per flash.
Flash Photolysis Measurements.
For optical measurements, a two-wavelength flash photometer was used (37), and absorption changes were recorded simultaneously in a digital oscilloscope (Nicolet Accura 100; LDS Test and Measurement GmbH). Absorption changes at 380 nm (MII formation) and 595 nm (pH changes) were recorded simultaneously. Samples contained 10 μM rhodopsin, 50 μM BCP, and 0.03% DM. Samples were unbuffered to enable pH measurements. The pH was set to the designated value by adding small amounts of diluted HCl and NaOH measuring with a pH microprobe (Schott Instruments). Measurements were taken in a quartz cuvette of 0.2-mm thickness (custom made by Hellma). The pH was determined by using the UV/visible absorbance peaks of BCP; the pH signal was calibrated by adding aliquots of 10 μM HCl to the sample, as described in ref. 37. The temperature was controlled with a combined water cooling and Peltier system and measured inside the cuvette with a microprobe. Dry air was blown along the cuvette at low temperatures to prevent condensation. The sample was illuminated with a flash by using a 490- to 540-nm broadband filter, bleaching 11% of the rhodopsin in the sample. Each measurement was taken on an unbuffered and a buffered aliquot, the buffered aliquot containing 100 mM BTP buffer at the designated pH. The two ΔH+ signals were subtracted from each other to correct for the small absorption change caused by rhodopsin bleaching, which is visible at 595 nm (for a description of the process see ref. 32).
Data Analysis.
The kinetic data were analyzed by simulation of the data with a single-exponential function, yielding the time constants of the process. This simulation assumes that the processes follow a first-order or pseudo first-order reaction scheme, which is the case for MIIa and MIIb in detergent (9).
Supplementary Material
ACKNOWLEDGMENTS.
We thank Christian Altenbach, Ned van Eps, and Roberto Bogomolni for help with the kinetic EPR measurements; Jana Engelmann and Helena Seibel for technical assistance; Siegurd Magnus for help with the flash photolysis setup; and Martin Heck for helpful discussions. This work was supported by Deutsche Forschungsgemeinschaft Grant SFB 449 (to O.P.E. and K.P.H.), National Institutes of Health Grant EY05216, the Jules Stein Professorship endowment, and a grant from the Bruce Ford and Anne Smith Bundy Foundation (to W.L.H.), the Boehringer Ingelheim Fonds, Foundation for Basic Research in Biomedicine and the Studienstiftung des Deutschen Volkes (to B.K.).
Footnotes
The authors declare no conflict of interest.
This article contains supporting information online at www.pnas.org/cgi/content/full/0710393104/DC1.
References
- 1.Lefkowitz RJ. Trends Pharmacol Sci. 2004;25:413–422. doi: 10.1016/j.tips.2004.06.006. [DOI] [PubMed] [Google Scholar]
- 2.Oldham WM, Hamm HE. Q Rev Biophys. 2006;39:117–166. doi: 10.1017/S0033583506004306. [DOI] [PubMed] [Google Scholar]
- 3.Matthews RG, Hubbard R, Brown PK, Wald G. J Gen Physiol. 1963;47:215–240. doi: 10.1085/jgp.47.2.215. [DOI] [PMC free article] [PubMed] [Google Scholar]
- 4.Bennett N. Biochem Biophys Res Commun. 1978;83:457–465. doi: 10.1016/0006-291x(78)91012-4. [DOI] [PubMed] [Google Scholar]
- 5.Bennett N. Eur J Biochem. 1980;111:99–103. doi: 10.1111/j.1432-1033.1980.tb06079.x. [DOI] [PubMed] [Google Scholar]
- 6.Hofmann KP. Photobiochem Photobiophys. 1986;13:309–327. [Google Scholar]
- 7.Emeis D, Hofmann KP. FEBS Lett. 1981;136:201–207. doi: 10.1016/0014-5793(81)80618-7. [DOI] [PubMed] [Google Scholar]
- 8.Emeis D, Kühn H, Reichert J, Hofmann KP. FEBS Lett. 1982;143:29–34. doi: 10.1016/0014-5793(82)80266-4. [DOI] [PubMed] [Google Scholar]
- 9.Arnis S, Hofmann KP. Proc Natl Acad Sci USA. 1993;90:7849–7853. doi: 10.1073/pnas.90.16.7849. [DOI] [PMC free article] [PubMed] [Google Scholar]
- 10.Ernst OP, Gramse V, Kolbe M, Hofmann KP, Heck M. Proc Natl Acad Sci USA. 2007;104:10859–10864. doi: 10.1073/pnas.0701967104. [DOI] [PMC free article] [PubMed] [Google Scholar]
- 11.Arnis S, Fahmy K, Hofmann KP, Sakmar TP. J Biol Chem. 1994;269:23879–23881. [PubMed] [Google Scholar]
- 12.Helmreich EJ, Hofmann KP. Biochim Biophys Acta. 1996;1286:285–322. doi: 10.1016/s0304-4157(96)00013-5. [DOI] [PubMed] [Google Scholar]
- 13.Hofmann KP. In: Handbook of Biological Physics. Hoff AJ, editor. Vol 3. Amsterdam: Elsevier; 2000. pp. 91–142. [Google Scholar]
- 14.Okada T, Ernst OP, Palczewski K, Hofmann KP. Trends Biochem Sci. 2001;26:318–324. doi: 10.1016/s0968-0004(01)01799-6. [DOI] [PubMed] [Google Scholar]
- 15.Ernst OP, Bartl FJ. Chembiochem. 2002;3:968–974. doi: 10.1002/1439-7633(20021004)3:10<968::AID-CBIC968>3.0.CO;2-Q. [DOI] [PubMed] [Google Scholar]
- 16.Szundi I, Mah TL, Lewis JW, Jäger S, Ernst OP, Hofmann KP, Kliger DS. Biochemistry. 1998;37:14237–14244. doi: 10.1021/bi981249k. [DOI] [PubMed] [Google Scholar]
- 17.Morizumi T, Imai H, Shichida Y. Biochemistry. 2005;44:9936–9943. doi: 10.1021/bi0504512. [DOI] [PubMed] [Google Scholar]
- 18.Kisselev OG, Meyer CK, Heck M, Ernst OP, Hofmann KP. Proc Natl Acad Sci USA. 1999;96:4898–4903. doi: 10.1073/pnas.96.9.4898. [DOI] [PMC free article] [PubMed] [Google Scholar]
- 19.Herrmann R, Heck M, Henklein P, Henklein P, Kleuss C, Hofmann KP, Ernst OP. J Biol Chem. 2004;279:24283–24290. doi: 10.1074/jbc.M311166200. [DOI] [PubMed] [Google Scholar]
- 20.Herrmann R, Heck M, Henklein P, Hofmann KP, Ernst OP. J Biol Chem. 2006;281:30234–30241. doi: 10.1074/jbc.M600797200. [DOI] [PubMed] [Google Scholar]
- 21.Downs MA, Arimoto R, Marshall GR, Kisselev OG. Vision Res. 2006;46:4442–4448. doi: 10.1016/j.visres.2006.07.021. [DOI] [PubMed] [Google Scholar]
- 22.Hubbell WL, Cafiso DS, Altenbach C. Nat Struct Biol. 2000;7:735–739. doi: 10.1038/78956. [DOI] [PubMed] [Google Scholar]
- 23.Altenbach C, Yang K, Farrens DL, Farahbakhsh ZT, Khorana HG, Hubbell WL. Biochemistry. 1996;35:12470–12478. doi: 10.1021/bi960849l. [DOI] [PubMed] [Google Scholar]
- 24.Farrens DL, Altenbach C, Yang K, Hubbell WL, Khorana HG. Science. 1996;274:768–770. doi: 10.1126/science.274.5288.768. [DOI] [PubMed] [Google Scholar]
- 25.Hubbell WL, Altenbach C, Hubbell CM, Khorana HG. Adv Protein Chem. 2003;63:243–290. doi: 10.1016/s0065-3233(03)63010-x. [DOI] [PubMed] [Google Scholar]
- 26.Kusnetzow AK, Altenbach C, Hubbell WL. Biochemistry. 2006;45:5538–5550. doi: 10.1021/bi060101v. [DOI] [PMC free article] [PubMed] [Google Scholar]
- 27.Salom D, Lodowski DT, Stenkamp RE, Le Trong I, Golczak M, Jastrzebska B, Harris T, Ballesteros JA, Palczewski K. Proc Natl Acad Sci USA. 2006;103:16123–16128. doi: 10.1073/pnas.0608022103. [DOI] [PMC free article] [PubMed] [Google Scholar]
- 28.Ridge KD, Palczewski K. J Biol Chem. 2007;282:9297–9301. doi: 10.1074/jbc.R600032200. [DOI] [PubMed] [Google Scholar]
- 29.Kim M, Xu Q, Fanucci GE, Cafiso DS. Biophys J. 2006;90:2922–2929. doi: 10.1529/biophysj.105.078246. [DOI] [PMC free article] [PubMed] [Google Scholar]
- 30.Farahbakhsh ZT, Hideg K, Hubbell WL. Science. 1993;262:1416–1419. doi: 10.1126/science.8248781. [DOI] [PubMed] [Google Scholar]
- 31.Janko K, Reichert J. Biochim Biophys Acta. 1987;905:409–416. doi: 10.1016/0005-2736(87)90470-6. [DOI] [PubMed] [Google Scholar]
- 32.Meyer CK, Hofmann KP. Methods Enzymol. 2000;315:377–387. doi: 10.1016/s0076-6879(00)15855-0. [DOI] [PubMed] [Google Scholar]
- 33.Meyer CK, Böhme M, Ockenfels A, Gärtner W, Hofmann KP, Ernst OP. J Biol Chem. 2000;275:19713–19718. doi: 10.1074/jbc.M000603200. [DOI] [PubMed] [Google Scholar]
- 34.Vogel R, Fan GB, Sheves M, Siebert F. Biochemistry. 2000;39:8895–8908. doi: 10.1021/bi000852b. [DOI] [PubMed] [Google Scholar]
- 35.Bartl FJ, Fritze O, Ritter E, Herrmann R, Kuksa V, Palczewski K, Hofmann KP, Ernst OP. J Biol Chem. 2005;280:34259–34267. doi: 10.1074/jbc.M505260200. [DOI] [PubMed] [Google Scholar]
- 36.Hamm HE, Deretic D, Arendt A, Hargrave PA, König B, Hofmann KP. Science. 1988;241:832–835. doi: 10.1126/science.3136547. [DOI] [PubMed] [Google Scholar]
- 37.Schleicher A, Hofmann KP. Z Naturforsch C. 1985;40:400–405. doi: 10.1515/znc-1985-5-619. [DOI] [PubMed] [Google Scholar]
- 38.Herrmann R, Heck M, Henklein P, Kleuss C, Wray V, Hofmann KP, Ernst OP. Vision Res. 2006;46:4582–4593. doi: 10.1016/j.visres.2006.07.027. [DOI] [PubMed] [Google Scholar]
- 39.Janz JM, Farrens DL. J Biol Chem. 2004;279:29767–29773. doi: 10.1074/jbc.M402567200. [DOI] [PubMed] [Google Scholar]
- 40.Schwartz TW, Frimurer TM, Holst B, Rosenkilde MM, Elling CE. Annu Rev Pharmacol Toxicol. 2006;46:481–519. doi: 10.1146/annurev.pharmtox.46.120604.141218. [DOI] [PubMed] [Google Scholar]
- 41.Scheer A, Fanelli F, Costa T, De Benedetti PG, Cotecchia S. Proc Natl Acad Sci USA. 1997;94:808–813. doi: 10.1073/pnas.94.3.808. [DOI] [PMC free article] [PubMed] [Google Scholar]
- 42.Ghanouni P, Schambye H, Seifert R, Lee TW, Rasmussen SG, Gether U, Kobilka BK. J Biol Chem. 2000;275:3121–3127. doi: 10.1074/jbc.275.5.3121. [DOI] [PubMed] [Google Scholar]
- 43.Seibert C, Harteneck C, Ernst OP, Schultz G, Hofmann KP. Eur J Biochem. 1999;266:911–916. doi: 10.1046/j.1432-1327.1999.00927.x. [DOI] [PubMed] [Google Scholar]
- 44.Fahmy K, Sakmar TP, Siebert F. Biochemistry. 2000;39:10607–10612. doi: 10.1021/bi000912d. [DOI] [PubMed] [Google Scholar]
- 45.Buczylko J, Saari JC, Crouch RK, Palczewski K. J Biol Chem. 1996;271:20621–20630. doi: 10.1074/jbc.271.34.20621. [DOI] [PubMed] [Google Scholar]
- 46.Sheikh SP, Zvyaga TA, Lichtarge O, Sakmar TP, Bourne HR. Nature. 1996;383:347–350. doi: 10.1038/383347a0. [DOI] [PubMed] [Google Scholar]
- 47.Nanoff C, Koppensteiner R, Yang Q, Fuerst E, Ahorn H, Freissmuth M. Mol Pharmacol. 2006;69:397–405. doi: 10.1124/mol.105.016725. [DOI] [PubMed] [Google Scholar]
- 48.Kisselev OG, Kao J, Ponder JW, Fann YC, Gautam N, Marshall GR. Proc Natl Acad Sci USA. 1998;95:4270–4275. doi: 10.1073/pnas.95.8.4270. [DOI] [PMC free article] [PubMed] [Google Scholar]
- 49.Koenig BW, Kontaxis G, Mitchell DC, Louis JM, Litman BJ, Bax A. J Mol Biol. 2002;322:441–461. doi: 10.1016/s0022-2836(02)00745-3. [DOI] [PubMed] [Google Scholar]
- 50.Oldham WM, Van Eps N, Preininger AM, Hubbell WL, Hamm HE. Nat Struct Mol Biol. 2006;13:772–777. doi: 10.1038/nsmb1129. [DOI] [PubMed] [Google Scholar]
- 51.Franke RR, Sakmar TP, Oprian DD, Khorana HG. J Biol Chem. 1988;263:2119–2122. [PubMed] [Google Scholar]
- 52.Fritze O, Filipek S, Kuksa V, Palczewski K, Hofmann KP, Ernst OP. Proc Natl Acad Sci USA. 2003;100:2290–2295. doi: 10.1073/pnas.0435715100. [DOI] [PMC free article] [PubMed] [Google Scholar]
- 53.Resek JF, Farahbakhsh ZT, Hubbell WL, Khorana HG. Biochemistry. 1993;32:12025–12032. doi: 10.1021/bi00096a012. [DOI] [PubMed] [Google Scholar]
- 54.Heck M, Hofmann KP. J Biol Chem. 2001;276:10000–10009. doi: 10.1074/jbc.M009475200. [DOI] [PubMed] [Google Scholar]
- 55.Piasecki W, Froncisz W, Hubbell WL. J Magn Reson. 1998;134:36–43. doi: 10.1006/jmre.1998.1482. [DOI] [PubMed] [Google Scholar]
- 56.Li J, Edwards PC, Burghammer M, Villa C, Schertler GF. J Mol Biol. 2004;343:1409–1438. doi: 10.1016/j.jmb.2004.08.090. [DOI] [PubMed] [Google Scholar]
Associated Data
This section collects any data citations, data availability statements, or supplementary materials included in this article.


