Abstract
Divorce is increasingly common around the world. Its causes, dynamics, and socioeconomic impacts have been widely studied, but little research has addressed its environmental impacts. We found that average household size (number of people in a household) in divorced households (households with divorced heads) was 27–41% smaller than married households (households with married heads) in 12 countries across the world around the year 2000 (between 1998 and 2002). If divorced households had combined to have the same average household size as married households, there could have been 7.4 million fewer households in these countries. Meanwhile, the number of rooms per person in divorced households was 33–95% greater than in married households. In the United States (U.S.) in 2005, divorced households spent 46% and 56% more on electricity and water per person than married households. Divorced households in the U.S. could have saved more than 38 million rooms, 73 billion kilowatt-hours of electricity, and 627 billion gallons of water in 2005 alone if their resource-use efficiency had been comparable to married households. Furthermore, U.S. households that experienced divorce used 42–61% more resources per person than before their dissolution. Remarriage of divorced household heads increased household size and reduced resource use to levels similar to those of married households. The results suggest that mitigating the impacts of resource-inefficient lifestyles such as divorce helps to achieve global environmental sustainability and saves money for households.
Keywords: energy, household, land, sustainability, water
Numerous studies have used aggregate variables, such as population size and population growth rate, to understand human impacts on the environment (1–5). Although those studies have generated important insights, there is an increasing recognition that aggregate variables alone are insufficient. For example, it is important to investigate the effects of household dynamics on the environment (6–10), because households are basic socioeconomic units and share resources (e.g., energy, land, and water) among occupants. Globally, the number of households has been growing much faster than population size (7). Even with a reduced population size or a declining global population growth rate (11), the number of households is still rising substantially because of factors such as divorce (7).
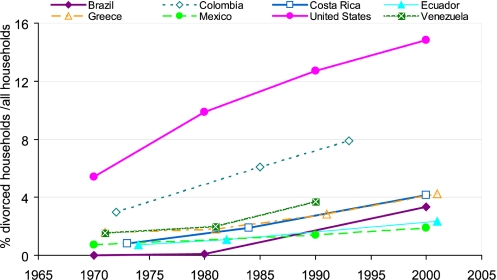
Divorce has become an increasingly common phenomenon around the world (12) (Fig. 1). In the United States (U.S.), for instance, the proportion of divorced households (households with divorced heads) among all households increased from 5% in 1970 to 15% in 2000 (an increase from 3.4 million to 15.6 million divorced households) (Fig. 1), whereas the proportion of married households (households with married heads) decreased from 69% in 1970 to 53% in 2000. Even in China, where divorce was traditionally uncommon, divorce rates have recently surged [1.6, 1.7, and 1.9 million couples cut their ties in 2004, 2005, and 2006, respectively (www.china.org.cn/english/features/cw/211746.htm) (13)].
Fig. 1.
Changes in the proportion of divorced households out of all households in eight countries. Data are from the Integrated Public Use Microdata Series—International database (http://international.ipums.org/international).
Although numerous studies have been undertaken to assess the dynamics, causes, and socioeconomic impacts of divorce (14–17), little is known about the environmental impacts of divorce. From the perspective of household dynamics (7), we hypothesize that divorce affects the environment by increasing the number of households and reducing household size (number of people in a household). Divorce usually causes a former spouse to move out and form a new household, thus increasing the use of materials and land for housing. Because divorce usually splits households into smaller units, it contributes to the global trend toward smaller household sizes and reduces the efficiency of resource use per person (18). Specifically, we hypothesize that increasing incidences of divorce have led to an increasing number of households and that the average household size and efficiency of resource use per person are lower in divorced households than in married households.
Results
Smaller Household Size in Divorced Households than in Married Households.
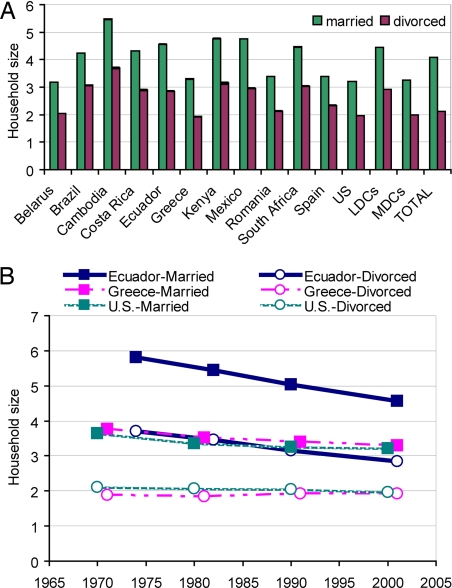
Divorced households had smaller household sizes than married households. In 12 countries around the year 2000 (from 1998 to 2002), there were 1.1–1.8 fewer people in an average divorced household than in an average married household (Fig. 2A). In terms of percent differences, average household sizes were 27–41% smaller in divorced households than in married households. The differences between divorced and married households also varied between more developed countries (MDCs) and less developed countries (LDCs). On average, a divorced household had 1.3 and 1.5 fewer people than a married household in the four MDCs (Greece, Romania, Spain, and the U.S.) and eight LDCs, respectively. Both divorced and married households in LDCs were larger than their counterparts in MDCs (Fig. 2A).
Fig. 2.
Average household sizes in divorced households and married households. (Numbers of divorced and married households are shown in Table 1.) Standard errors are drawn but may be too small to see. (A) Average household size in each of the 12 countries, 8 less developed countries (LDCs), 4 more developed countries (MDCs), and all 12 countries (TOTAL) around the year 2000. (B) Temporal changes in average household sizes of married households and divorced households in Ecuador, Greece, and the U.S. from 1970 to 2001.
From 1970 to 2001, household sizes in divorced households remained 36–50% smaller than those in married households (Fig. 2B). The differences between average sizes of married and divorced households ranged from 1.2 to 2.1 people. Although the average household sizes generally decreased over time in both married and divorced households (Fig. 2B), married households shrank faster than divorced households.
Divorce Led to More Households.
If divorced households in the 12 study countries around 2000 had combined to have the same average household size as that of married households, there could have been 7.4 million fewer households (Table 1). Divorced households accounted for 0.9–14.8% of all households in each country, whereas extra households due to divorce constituted 0.3–5.7% (Table 1). The numbers of extra households varied greatly among countries, ranging from 13,000 in Costa Rica to 6.1 million in the U.S. The four MDCs contributed ≈87% of the total extra households, and the U.S. alone dominated the contribution (82%).
Table 1.
Extra households and extra rooms due to divorce in 12 countries around the year 2000
| Countries | Year | Total households | Married households | Divorced households | Divorced households (out of total households), % | Extra households due to divorce | Extra households (out of total households), % | Extra rooms due to divorce |
|---|---|---|---|---|---|---|---|---|
| Belarus | 1999 | 3,800,070 | 2,128,490 | 389,350 | 10.2 | 140,037 | 3.7 | 217,521 |
| Brazil | 2000 | 44,777,522 | 24,592,129 | 1,493,693 | 3.3 | 410,413 | 0.9 | 3,747,184 |
| Cambodia | 1998 | 2,128,610 | 1,757,540 | 74,670 | 3.5 | 24,150 | 1.1 | 42,434 |
| Costa Rica | 2000 | 960,420 | 524,990 | 39,710 | 4.1 | 13,017 | 1.4 | 106,073 |
| Ecuador | 2001 | 2,874,950 | 1,491,180 | 67,290 | 2.3 | 25,177 | 0.9 | 130,653 |
| Greece | 2001 | 3,663,320 | 2,528,560 | 154,470 | 4.2 | 64,152 | 1.8 | 216,175 |
| Kenya | 1999 | 6,299,740 | 4,081,520 | 91,940 | 1.5 | 31,238 | 0.5 | 82,312 |
| Mexico | 2000 | 22,481,200 | 14,419,634 | 422,475 | 1.9 | 160,007 | 0.7 | 1,144,053 |
| Romania | 2002 | 7,320,160 | 4,609,850 | 500,360 | 6.8 | 186,216 | 2.5 | 479,061 |
| South Africa | 2001 | 11,750,105 | 5,431,856 | 393,944 | 3.4 | 132,335 | 1.1 | 1,014,932 |
| Spain | 2001 | 14,187,180 | 9,312,080 | 504,380 | 3.6 | 157,494 | 1.1 | 1,051,461 |
| U.S. | 2000 | 105,558,968 | 55,478,056 | 15,643,922 | 14.8 | 6,060,883 | 5.7 | 35,755,058 |
| LDCs | 95,072,617 | 54,427,339 | 2,973,072 | 3.1 | 936,374 | 1.0 | 6,485,162 | |
| MDCs | 130,729,628 | 71,928,546 | 16,803,132 | 12.9 | 6,468,745 | 4.9 | 37,501,754 | |
| Total | 225,802,245 | 126,355,885 | 19,776,204 | 8.8 | 7,405,119 | 3.3 | 43,986,917 |
MDCs refer to more developed countries, including Greece, Romania, Spain, and the U.S. The remaining eight countries are LDCs. Total, summation of all 12 countries.
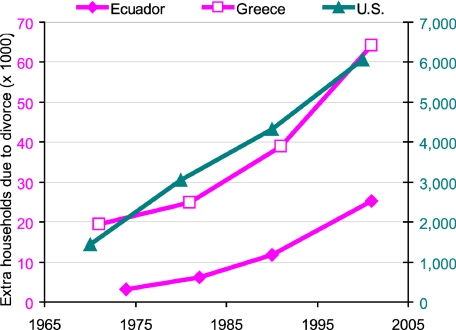
The number of extra households due to divorce increased 3.3- to 7.9-fold during the period 1970–2001 in the three countries analyzed in Fig. 3. The U.S. experienced the largest absolute increase in extra households due to divorce, from 1.4 million in 1970 to 6.1 million in 2000 (Fig. 3).
Fig. 3.
Extra households due to divorce in Ecuador and Greece (left y axis) and the U.S. (right y axis) from 1970 to 2001.
Greater Resource Consumption per Person in Divorced Households than in Married Households.
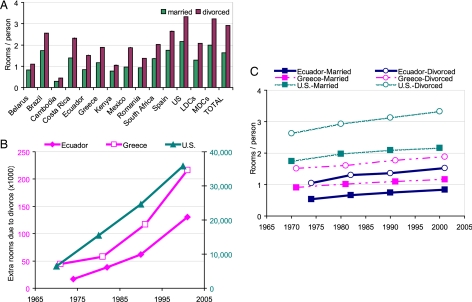
Divorced households used more resources per person than married households (Fig. 4). Across the 12 countries around 2000, divorced households occupied 33–95% more rooms per person than married households (Fig. 4A). On average, there were 0.8 and 1.2 more rooms per person in divorced households in LDCs and MDCs, respectively. If the average number of rooms per person in divorced households had been the same as that in married households, ≈8.4 and 37.5 million fewer rooms would have been needed in LDCs and MDCs, respectively (Table 1). In 2005, >38.5 million rooms would have been saved in the U.S. alone if the average number of rooms per person in divorced households had been comparable to that in married households (Table 2).
Fig. 4.
Average numbers of rooms per person in divorced households and married households. (Numbers of divorced and married households are shown in Table 1.) Standard errors are drawn but may be too small to see. (A) Average number of rooms in each of the 12 countries, 8 less developed countries (LDCs), 4 more developed countries (MDCs), and all 12 countries (TOTAL) around the year 2000. (B) Temporal changes in extra rooms per person due to divorce in Ecuador and Greece (left y axis), and the U.S. (right y axis) from 1970 to 2001. (C) Numbers of rooms per person in divorced households and married households in Ecuador, Greece, and the U.S. from 1970 to 2001.
Table 2.
Resource use in divorced households and married households in the U.S. in 2005 (total of 16,571,000 divorced households and 60,018,000 married households)
| Resource type | Resource use per person per month in divorced households, mean ± SE (sample size) | Resource use per person per month in married households, mean ± SE (sample size) | Total extra rooms or extra utility expenditure per month due to divorce | Total expenditures of extra utility due to divorce, billions of dollars/year | Total amounts of extra utility, billion kW·hr or billion gallons |
|---|---|---|---|---|---|
| Rooms | 3.66 ± 0.06 (1,169) | 2.49 ± 0.01 (7,952) | 38,511,681 | ||
| Electricity | $56.12 ± 1.35 (955) | $38.47 ± 0.33 (7,080) | $579,106,737 | 6.95 | 73.5 |
| Water | $25.92 ± 0.80 (664) | $16.59 ± 0.24 (5,621) | $306,122,711 | 3.67 | 627.3 |
Similar effects are also seen in average expenditure on utilities, such as water and electricity, in the U.S. in 2005 (Table 2). Divorced households spent 46–56% more money per person than married households on each utility. More than 73 billion kilowatt-hours of electricity and 627 billion gallons of water could have been saved in the U.S. in 2005 if the efficiency per person in divorced households had been the same as that in married households (Table 2).
The numbers of extra rooms due to divorce jumped during the period 1970–2001 by 450–690% (Fig. 4B). These big jumps are the product of the increases in extra households (Fig. 3) and increases in the numbers of rooms per person (Fig. 4C). The U.S. experienced the largest absolute increase in rooms per person in divorced households over the 30-year span (0.7), whereas Greece had the smallest absolute rise (0.4) (Fig. 4C). However, Ecuador had the highest percent increase (45%), followed by the U.S. and Greece. The numbers of rooms per person in divorced households were consistently higher than those in married households from the 1970s to the 2000s in each of the three countries where data were available (Fig. 4C).
Higher Resource Consumption After Divorce.
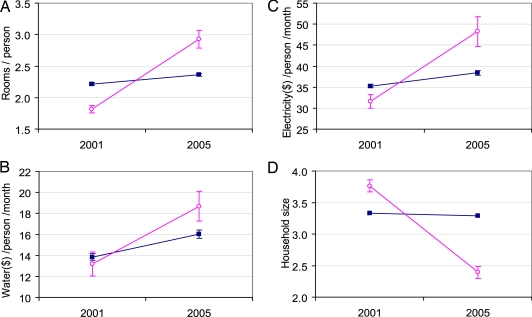
The environmental effects of divorce were further analyzed by following a sample of 3,283 households in the U.S. from 2001 to 2005. Households that divorced during this 4-year period demonstrated a 61% increase in the number of rooms per person compared with a mere 6% increase in households that remained married (Fig. 5A). Similarly large increases in utility use are apparent from electricity and water expenditures after divorce (53% and 42%, respectively) (Fig. 5 B and C). Rooms per person and expenditures on utilities were much greater in divorced households compared with their married counterparts in 2005 (Fig. 5 A–C). These marked differences in resource use are likely due to the drastic decline (36%) in the average size of households that experienced divorce compared with the slight drop (1%) in households that remained married (Fig. 5D).
Fig. 5.
Resource use and household size in sample households that were married in 2001 and remained married by 2005 (blue lines) or were divorced by 2005 (pink lines). (A) Rooms per person (3,092 households remained married, 191 households went to divorce). (B) Electricity expenditure (U.S. dollars) per person per month (subset of sample in A; 2,704 households remained married, 137 households went to divorce). (C) Water expenditure (U.S. dollars) per person per month (subset of sample in A; 1,942 households remained married, 81 households went to divorce). (D) Average household size (based on sample used in A; resultant household sizes were similar under A–C).
Lower Resource Consumption After Remarriage.
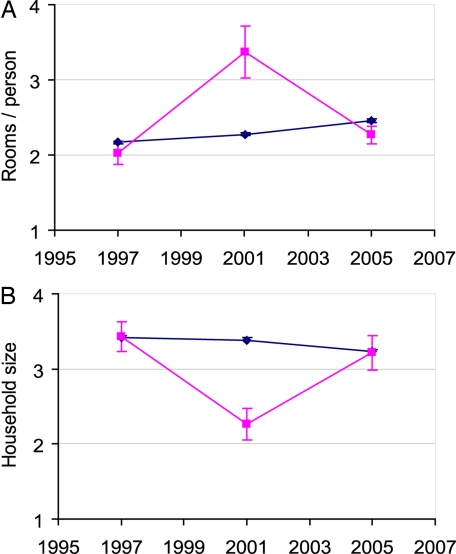
It is not uncommon for divorced household heads to remarry, even with former spouses. To evaluate the effects of remarriage on resource consumption, the number of rooms per person and household size were compared in married–divorced–remarried households to those in married–married–married households in the U.S. at three time steps (1997, 2001, and 2005). Households whose heads remained married demonstrated previously documented household trends (7) with rooms per person slightly increasing over time (Fig. 6A) and household size decreasing (Fig. 6B). For married–divorced–remarried households, the number of rooms per person showed a dramatic rise during the divorced period in 2001 (Fig. 6A), whereas household size demonstrated a parallel decline when household heads were divorced (Fig. 6B). After remarriage, average household size and number of rooms per person returned to levels of constantly married households.
Fig. 6.
Resource use and household size of households that remained married from 1997 through 2005 (blue lines; 2,411 households) or married in 1997, divorced in 2001, and remarried in 2005 (pink lines; 42 households). (A) Rooms per person. (B) Average household size.
Conclusions and Discussion
The results from this study support the hypotheses proposed at the beginning of the article. They indicate that divorce escalates consumption of increasingly limited resources (water, land, and energy) through household proliferation and reduction in household size. Because of higher consumption per person, an individual in a divorced household may also generate more waste (solid, liquid, and gaseous material like greenhouse gases) that contributes to global environmental changes such as climate change and biodiversity loss (7, 19, 20). Although waste is not analyzed in this study, other studies show that waste per person increases with a decrease in household size (21, 22). Furthermore, when divorce occurs, some shared items are thrown away and new household products are purchased. It is probable that visits between divorced parents and their children also increase energy consumption and emissions of greenhouse gases.
Divorce is just one mechanism that leads to a decline in household size and extra households. Other mechanisms include declines in multigenerational households, delays in first marriage, increases in empty-nesters, and increases in separated couples. These alternate lifestyles may create environmental impacts similar to divorce through a reduction in average household size and an increase in the number of households.
As global human values continue to shift toward greater autonomy and choice (23), the environmental impacts of increasing divorce will continue unless effective policies to minimize household dissolution are implemented or divorced households are able to improve their resource-use efficiency. Although countries like Chile, with restrictive divorce policies, do have lower rates of divorce, frequently other ways to live separately increase (14). Furthermore, historically Catholic countries (e.g., Italy and Portugal) are characterized by exceptionally high numbers of separated couples. The environmental impacts of divorce and other lifestyles such as separation should be considered when making personal choices and government policies. Cohabitation (24) and remarriage could be ways to counter the environmental impacts of separation and divorce. Maintaining resource-efficient lifestyles helps to lower household expenditures, reduce urban sprawl, and achieve global environmental sustainability.
Methods
To test the hypotheses, we compared the average household size and number of rooms per person between married households and divorced households in 12 countries throughout the world around the year 2000 (Table 1). We then estimated the number of extra households due to divorce by subtracting the number of divorced households that would exist if they had the average household size of married households from the actual number of divorced households:
where popd is the total number of people in divorced households, hhsd is the average household size of divorced households, hhsm is the average household size of married households, and hhnextra is the number of extra households due to divorce.
Similarly, to estimate the extra resource use (rooms, water or electricity expenditure) due to divorce (rextra), we subtracted the resource use in divorced households that would exist if they were as efficient as married households from the actual resource use in divorced households:
where rd and rm are the resource uses per person in divorced and married households, respectively. The extra amounts of water and electricity were the total extra water and electricity expenditures divided by their average unit prices, respectively. Data for energy and water use, and their unit prices and living arrangements in the U.S. (Table 2) were obtained from the American Water Works Association (26), the Energy Information Administration (www.eia.doe.gov/cneaf/electricity/epa/epat7p4.html), and the U.S. Census Bureau (27).
We used international census data from the Integrated Public Use Microdata Series—International database (http://international.ipums.org/international) to estimate (i) the number of households, f(ii) the average household size, and (iii) the average number of rooms per person, in both divorced and married households in 12 countries around 2000 and 3 countries from 1970–2001. These countries were chosen based on data availability, geographic distribution (Africa, Asia, Europe, North America, and South America), and representation of human development levels (25). Country classification into more or less developed countries was made by using the Human Development Index (HDI) from the Human Development Report 2006 (25). An HDI of >0.8 is considered high, and a country with that value or higher is listed as an MDC in our classification. A country with a HDI of <0.8 is considered medium to low in development and is classified as an LDC in this article.
Data from the Panel Study of Income Dynamics (PSID) (http://psidonline.isr.umich.edu) allowed us to compare household size and resource-use efficiency between married and divorced households in the U.S. by following the same households at different marital stages: before and after divorce, and after remarriage. The PSID collects data on items such as household size, number of rooms, and monthly expenditures on electricity and water. The panel data enabled us to compare the resource use per person of households where the heads were married in 2001 and divorced by 2005 with households whose heads had remained married during this period. Similarly, to assess the impact of remarriage on rooms per person and household size, households whose heads were married in 1997, divorced in 2001, and remarried by 2005 were compared with households whose heads remained constantly married during this period.
ACKNOWLEDGMENTS.
We thank Joanna Broderick, Paul Ehrlich, William McConnell, Nicholas Reo, and two anonymous reviewers for their constructive suggestions and comments on earlier drafts; Luke Polcyn, Donna Wang, and Eugene Yu for helpful support; the Integrated Public Use Microdata Series of the Minnesota Population Center, the Panel Study of Income Dynamics of the University of Michigan, the Energy Information Administration, the U.S. Census Bureau, and the American Water Works Association for provision of data; and Kurt Keeley and Shuxin Li for assistance in data access. This work was supported by the National Science Foundation, the National Institutes of Health, and Michigan State University (Rachel Carson Chair in Sustainability, University Distinguished Professorship, and Michigan Agricultural Experimental Station).
Footnotes
The authors declare no conflict of interest.
This article is a PNAS Direct Submission.
References
- 1.Ehrlich PR, Holdren JP. Science. 1971;171:1212–1216. doi: 10.1126/science.171.3977.1212. [DOI] [PubMed] [Google Scholar]
- 2.Lubchenco J, Olson AM, Brubaker LB, Carpenter SR, Holland MM, Hubbell SP, Levin SA, MacMahon JA, Matson PA, Melillo JM, et al. Ecology. 1991;72:371–412. [Google Scholar]
- 3.Vitousek PM, Mooney HA, Lubchenco J, Melillo JM. Science. 1997;277:494–499. [Google Scholar]
- 4.McKee JK, Sciulli PW, Fooce CD, Waite TA. Biol Conserv. 2004;115:161–164. [Google Scholar]
- 5.Diamond J. Collapse: How Societies Choose to Fail or Succeed. New York: Viking; 2005. [Google Scholar]
- 6.MacKellar FL, Lutz W, Prinz C, Goujon A. Popul Dev Rev. 1995;21:849–865. [Google Scholar]
- 7.Liu J, Daily GC, Ehrlich PR, Luck GW. Nature. 2003;421:530–533. doi: 10.1038/nature01359. [DOI] [PubMed] [Google Scholar]
- 8.Liu J, Dietz T, Carpenter SR, Alberti M, Folke C, Moran E, Pell AN, Deadman P, Kratz T, Lubchenco J, et al. Science. 2007;317:1513–1516. doi: 10.1126/science.1144004. [DOI] [PubMed] [Google Scholar]
- 9.Liu J, Dietz T, Carpenter SR, Folke C, Alberti M, Redman CL, Schneider SH, Ostrom E, Pell AN, Lubchenco J, et al. AMBIO. 2007;36:639–649. doi: 10.1579/0044-7447(2007)36[639:chans]2.0.co;2. [DOI] [PubMed] [Google Scholar]
- 10.Peterson MN, Peterson MJ, Peterson TR, Liu J. J Wildl Manage. 2007;71:1243–1248. [Google Scholar]
- 11.United Nations. World Population Prospects: The 2006 Revision, Highlights. New York: United Nations; 2007. [Google Scholar]
- 12.United Nations. World Fertility Report 2003, Executive Summary. New York: United Nations; 2004. [Google Scholar]
- 13.Liu J, Diamond J. Nature. 2005;435:1179–1186. doi: 10.1038/4351179a. [DOI] [PubMed] [Google Scholar]
- 14.Goode WJ. World Changes in Divorce Patterns. New Haven, CT: Yale Univ Press; 1993. [Google Scholar]
- 15.Dronkers J, Kalmijn M, Wagner M. Eur Sociol Rev. 2006;22:479–481. [Google Scholar]
- 16.Bitler MP, Gelbach JB, Hoynes HW, Zavodny M. Demography. 2004;41:213–236. doi: 10.1353/dem.2004.0011. [DOI] [PubMed] [Google Scholar]
- 17.Manting D, Bouman AM. Eur Sociol Rev. 2006;22:413–429. [Google Scholar]
- 18.Nelson JA. Econometrica. 1988;56:1301–1314. [Google Scholar]
- 19.Spangenberg JH, Lorek S. Ecol Econ. 2002;43:127–140. [Google Scholar]
- 20.Heltberg R, Arndt TC, Sekhar NU. Land Econ. 2000;76:213–232. [Google Scholar]
- 21.Lenzen M, Murray SA. Ecol Econ. 2001;37:229–255. [Google Scholar]
- 22.Cole MA, Neumayer E. Popul Environ. 2004;26:5–21. [Google Scholar]
- 23.Inglehart R. Modernization and Postmodernization: Cultural, Economic, and Political Change in 43 Societies. Princeton: Princeton Univ Press; 1997. [Google Scholar]
- 24.Thornton A, Axinn W, Xie Y. Marriage and Cohabitation. Chicago: Univ of Chicago Press; 2007. [Google Scholar]
- 25.United Nations Development Programme. Human Development Report 2006—Beyond Scarcity: Power, Poverty, and the Global Water Crisis. New York: United Nations; 2007. [Google Scholar]
- 26.American Water Works Association and Raftelis Financial Consultants Inc. Water and Wastewater Rate Survey. Denver: American Water Works Association; 2006. [Google Scholar]
- 27.US Census Bureau. America's Families and Living Arrangements. Atlanta: US Census Bureau; 2005. [Google Scholar]


