

Abstract
Cryo-electron microscopy and three-dimensional, single-particle image analysis have been used to reveal the specific binding site of imperatoxin A (IpTxa) on the architecture of the calcium release channel/ryanodine receptor from skeletal muscle (RyR1). IpTxa is a peptide toxin that binds with high affinity to RyR1 and affects its functioning. The toxin was derivatized with biotin to enhance its detection with streptavidin. IpTxa binds to the cytoplasmic moiety of RyR1 between the clamp and handle domains, 11 nm away from the transmembrane pore. The proposed mimicry by IpTxa of the dihydropyridine receptor (DHPR) II-III loop, thought to be a main physiological excitation-contraction trigger, suggests that the IpTxa binding location is a potential excitation-contraction signal transduction site.
Keywords: ryanodine receptor, imperatoxin A, cryo-electron microscopy, three-dimensional reconstruction, excitation-contraction coupling
The ryanodine receptor isoform 1 (RyR1)1 is a large multi-subunit transmembrane protein (four identical subunits of 565-kD and four 12-kD subunits) that functions as the calcium release channel in the sarcoplasmic reticulum (SR) of mammalian skeletal muscle (recently reviewed by Franzini-Armstrong and Protasi 1997). Dihydropyridine receptors (DHPRs) are located in the tubular invaginations of the plasma membrane known as transverse (T) tubules. RyR1s and DHPRs meet at the triad junctions, specialized myofiber regions where the T tubules meet the terminal cisternae regions of the SR. At these junctions the RyRs and DHPRs form two extended rows in their respective membranes, appearing to form complementary lattices from which the relative geometry of the two receptors has been inferred (Block et al. 1988). According to the currently favored mechanism of excitation-contraction (E-C) coupling in skeletal muscle, a neuronal voltage-induced conformational change in the DHPR, by means of direct interaction with RyR1, switches RyR1 from a closed to an open configuration, thereby releasing Ca2+ from the SR and provoking muscular contraction (Schneider and Chandler 1973; Catterall 1991; Rios and Pizzaro, 1991).
The three-dimensional (3D) structure of RyR1 as determined by cryo-EM and image processing (Radermacher et al. 1994; Serysheva et al. 1995; for review see Samsó and Wagenknecht 1998) reveals a large symmetric square-prism shaped structure forming the cytoplasmic moiety with 10 well-defined domains. The cytoplasmic peripheral features are also known as “clamp” (domains 5–10) and “handle” (domain 3). A smaller transmembrane region bears the ion channel. The large cytoplasmic region, which occupies the gap between the T tubule and SR membranes at the triad junction, likely contains the site(s) of interaction with the DHPR, but the precise location of this putative interaction on the surface of the RyR1 is unknown.
A peptide toxin, imperatoxin A (IpTxa; 33 amino acid residues), isolated from the venom of scorpion Pandinus imperator, interacts specifically with the skeletal (RyR1) and cardiac (RyR2) isoforms of the RyR. It reversibly enhances binding of ryanodine to the receptors (El-Hayek et al. 1995b), and when added to the cytosolic side of single receptors reconstituted in lipid bilayers, induces long-lived subconductance states (Tripathy et al. 1998; Gurrola et al. 1999). The binding location of IpTxa on the RyR is unknown, and since the peptide toxin presumably mimics a DHPR domain that triggers RyR openings (Gurrola et al. 1999), identification of the binding location of IpTxa may shed light on the structural domains of RyR1 that participate in E-C coupling.
Image analysis of single particles in frozen solution as observed in the electron microscope is a powerful method for the structural study of large membrane-bound proteins complexes, such as membrane receptors and channels, which are not easily crystallized (Frank 1996; Samsó and Wagenknecht 1998). One important application of these methods is the determination of binding locations of macromolecular ligands by 3D reconstruction of the protein-ligand complexes. In the case of RyR1, the binding locations of calmodulin and the FK-506 binding protein have been determined on the RyR1 (Wagenknecht et al. 1997). In this study we take advantage of the high affinity between IpTxa and RyR1 to localize the toxin binding site on the RyR1 3D structure, which should reveal the location of a switch for channel gating and thus provide insight into the fundamental principles of action of this macromolecule. Furthermore, this location could also correspond to an interaction site of an activating domain of the DHPR with the RyR1.
Materials and Methods
Biocytin was purchased from Bachem BioScience, Inc. All other biochemicals were purchased from Sigma Chemical Co. Skeletal RyRs were isolated from terminal cisternae vesicles from rabbit skeletal muscle as described in Wagenknecht et al. 1997. IpTxa was synthesized according to its sequence (Zamudio et al. 1997) with or without biocytin at the NH2 terminus. The peptides were prepared by the Wadsworth Center's Peptide Synthesis core facility on an automated synthesizer (model 431; Applied Biosystems) using 9-fluoroenylmethoxycarbonyl chemistry with standard cycles on 4-hydroxymethyl-phenoxymethylcopolystyrene, 1% divinylbenzene resin. Composition and purity of the peptides were confirmed by amino acid analysis (Systems Gold, model 126; Beckman Instruments) and by electrospray mass spectroscopy (MAT TSQ 700; Finnigan). [3H]Ryanodine binding assay was performed as indicated in Zamudio et al. 1997.
Affinity Chromatography and Gel Electrophoresis
Purified RyR (10 μg) was diluted and incubated with biotinylated or nonbiotinylated IpTxa in 100 μl binding buffer to yield the following final concentrations: 20 mM MOPS-NaOH (pH 7.4), 200 mM NaCl, 0.3% (vol/vol) CHAPS, 0.1 mM CaCl2, 0.24 mM DTT, 1 mM NEM, 5 μg/ml leupeptin, and 2.6 μM IpTxa. Preequilibrated streptavidin (SA)-agarose (40 μl of a 50% slurry) was added. The mixture was shaken for 15 min at room temperature. The supernatant was recovered by centrifugation for 2 min at 1,000 g. The sedimented SA-agarose was resuspended in 100 μl washing buffer of the following composition: 20 mM MOPS-NaOH (pH 7.4), 200 mM NaCl, 0.3% (vol/vol) CHAPS, 0.1 mM CaCl2, and 5 μg/ml leupeptin. The mixture was recentrifuged and the supernatant saved. This step was repeated nine times. Subsequently, the RyR was eluted batchwise in three steps with 125 μl elution buffer that contained 0.1 M sucrose, 2% SDS, 62.5 mM Tris-HCl (pH 6.8), 2 mM EDTA, 50 mM DTT, and 0.01% (wt/vol) bromophenol blue. All the supernatants recovered (100 μl each) were also mixed with 25 μl fivefold concentrated elution buffer. Aliquots (40 μl) were applied onto discontinuous SDS-polyacrylamide gels (3.5% stacking and 5% resolving gel). The resolved proteins were visualized by Coomassie staining.
Cryo-EM and Image Processing
RyR1:IpTxa-B:SA complexes were prepared in 20 mM Tris-HCl, pH 7.4, 0.15 M KCl, 0.1 mM CaCl2, and incubated between 10 and 30 min at room temperature before cryo-grid preparation. A 20-fold molar excess of IpTxa and SA over RyR1 was used. Vitrified specimens were prepared on 300-mesh carbon-coated gold grids as described in Wagenknecht et al. 1997. Samples were examined on a Philips 420 electron microscope operated at 100 kV under low-dose conditions at a magnification of 52,000. Underfocus was 1.8 μm. Micrographs were scanned on a Hi-Scan microdensitometer (Eurocore) using a pixel size corresponding to 3.85 Å on the specimen. Images were processed using the software SPIDER/WEB (Frank et al. 1996). 3D reconstructions were obtained following the projection-matching method (Penczek et al. 1994), taking care that all eulerian angles in both control and experimental volumes were well represented (Boisset et al. 1998). The total number of particles used for the final volumes was 3,900 and 2,347 particles for the IpTxa-containing and the control sample, respectively, after removing oversampled views and noisy images. 3D volumes were filtered to their limiting resolution, its value obtained using the Fourier shell correlation with a cutoff value at 0.5 (see appendix in Malhotra et al. 1998). The density threshold chosen for isosurface representation was the midpoint of the 3D boundary density profile.
Results
IpTxa-B Activity and Stability of IpTxa-B:SA Complex
IpTxa was synthesized with a biocytin group added to the NH2 terminus to facilitate its detection by cryo-EM using SA. Biotin-derivatized IpTxa (IpTxa-B) retained the ryanodine-binding enhancement property of the native toxin, although higher concentrations were needed to obtain the same half-maximal effect, and the plateau of maximal effect was 80% of that for native IpTxa (Fig. 1 a). The affinity of IpTxa-B for RyR1 is within the range suitable for cryo-EM.
Figure 1.

(a) Dose-dependent activation of [3H]ryanodine binding by native and biotinylated IpTxa. Skeletal SR vesicles were incubated with 7 nM [3H]ryanodine in the absence (control, 100%) and the indicated concentrations of native (open circles) or biotinylated IpTxa (filled circles). The binding reaction was carried out for 90 min at 36°C in medium containing 0.2 M KCl, 10 mM Na-Hepes (pH 7.2), and 10 μM CaCl2. Free and bound ligand were separated by rapid filtration, as previously described (Gurrola et al. 1999). Data were fitted with the equation: B = B0/(1 + [ED50]/[IpTxa]); where B is the specific binding of [3H]ryanodine (obtained by subtracting the binding in the presence of 10 μM ryanodine), B0 is the specific binding of [3H]ryanodine in the absence of IpTxa (0.38 ± 0.06 pmol/mg protein, n = 4), and ED50 is the concentration of IpTxa that produces half-maximal effect (9.8 and 45 nM for native and biotinylated IpTxa, respectively). (b) Precipitation of RyR1 by biotinylated IpTxa, using SA-agarose. Purified RyR was incubated with 60-fold molar excess of biotinylated-IpTxa (IpTxa-B) or nonbiotinylated IpTxa (IpTxa), and SA-agarose equilibrated as described in Materials and Methods. The affinity matrix was washed 10 times (W1–W10), and RyR was eluted using SDS and DTT (E1 and E2). Aliquots corresponding to the first supernatant (S), wash supernatants (W1–W10), and material released by denaturation (E1 and E2) were applied onto SDS-polyacrylamide gels. Proteins were visualized by Coomassie staining. The position of the RyR is indicated.
Precipitation of RyR1 by SA-agarose in the presence of IpTxa-B confirms that a stable complex forms between IpTxa-B and RyR1 (Fig. 1 b). The SA-agarose resin does not precipitate RyR1 when the mixture contains IpTxa instead of IpTxa-B (Fig. 1 b).
Cryo-EM and IpTxa-B:SA Difference Map
RyR1 was incubated with a molar excess of IpTxa-B and SA, and prepared for cryo-EM in parallel with a control reaction consisting of RyR1 and SA. In the presence of IpTxa-B and SA the receptors distributed homogeneously on the grid, but some dimers and a few higher oligomers formed, probably due to the tetravalent binding potential of both RyR1 for IpTxa-B and SA for biotin (Fig. 2 a). The control specimen (Fig. 2 b) showed mostly individual channels and some small particles on the background, presumably corresponding to free SA (in the experimental sample, less free SA was observed because a significant fraction of the SA was presumably bound by the RyR1:IpTxa-B). Although these observations are indicative of the formation of RyR1:IpTxa-B:SA complexes, it is impossible to assert by direct visual examination of the raw micrographs whether particular RyR1s contain ligand, and if so, where it is located.
Figure 2.
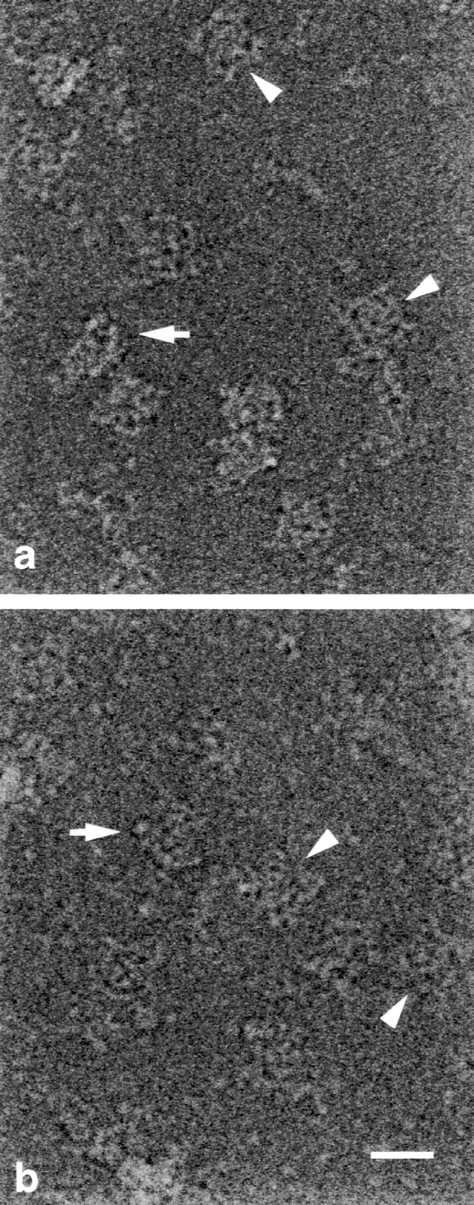
Unprocessed cryo-electron micrographs. (a) RyR1 incubated in the presence of IpTxa-B and SA. (b) RyR1 control incubated in the presence of SA (without IpTxa-B). Arrowheads point to typical RyR1 square-shaped views, arrows point to RyR1 side views. Bar, 29 nm.
Two-dimensional (2D) Analysis
2D image processing was performed on the frequently occurring square-shaped views of RyR1 as described in Wagenknecht et al. 1997. Both experimental and control 2D averages display the characteristic morphology with four protruding corners (clamps) and a central low-density cross (Fig. 3, a and b). Careful inspection reveals an extra mass density in the case of RyR1 incubated with SA and IpTxa-B versus the RyR1 incubated with SA only (Fig. 3 a, arrowheads). The difference map (Fig. 3 c) takes the form of four sharp, discrete, and elongated positive densities that are attributed to bound IpTxa-B:SA, and weaker differences that possibly correspond to minor conformational readjustments. The t test shows the regions of the difference map significant at the 98% confidence level (Fig. 3 d). These regions correspond to the main differences shown in Fig. 3 c.
Figure 3.

(a) 2D average of 221 fourfold symmetric particles corresponding to RyR1 incubated with IpTxa-B and SA. (b) 2D average of 215 particles corresponding to the RyR1 control sample. The arrowheads point to the four symmetry-related locations where there is extra mass in the presence of IpTxa-B. (c) 2D difference map showing the IpTxa-B:SA locations (in white). (d) t test displaying statistically significant regions of the difference map at the 98% confidence level (in white). 2D averages were filtered to their limiting resolution (29 Å). Bar, 10 nm.
Analysis
3D reconstructions were computed for both control and experimental samples. Surface renderings of the reconstructed volumes filtered to their limiting resolution of 29 Å (Fig. 4) show the characteristic square-prism cytoplasmic moiety containing 10 well-defined domains and the smaller transmembrane assembly that have been documented previously (Radermacher et al. 1994; Serysheva et al. 1995). A major difference between the two reconstructions occurs in the crevice delimited by domains 3 and 7/8 of the control reconstruction, which appears to be filled in by density in the reconstruction done in the presence of IpTxa-B and SA (compare Fig. 4, a and b). When the two volumes were subtracted, and the difference volume is displayed at the same threshold as the control and experimental volumes, the only differences remaining localize in the above-mentioned crevice (Fig. 4 c, violet). We attribute these differences to bound IpTxa-B:SA, and hereafter we refer to them as such. The fact that these differences appeared at the same threshold as the control and experimental volumes is indicative that most of the receptors had all four sites occupied. This finding is supported by the results of Gurrola et al. 1999 who have reported that 4 mol of IpTxa bind per mole of tetrameric RyR1.
Figure 4.

(a) Solid body representations of the 3D reconstruction of RyR1 incubated in the presence of IpTxa-B and SA. Resolution, 29 Å. (b) 3D reconstruction of RyR1 control incubated in the presence of SA. Resolution, 29 Å. (c) Control reconstruction (green) with differences (violet) obtained by subtracting reconstruction in a and b superimposed. This map shows the locations of bound IpTxa-B:SA (violet). The volumes are seen from the T tubule–facing side (left), SR-facing side (middle), and from the side (right) with the cytoplasmic moiety of the receptor on top, and the transmembrane assembly at the bottom. The numerals point to distinguishable domains as described in Radermacher et al. 1994.
The locations of the bound IpTxa-B:SA agree with the positions of the four significant differences seen in the 2D analysis (compare Fig. 4 c, violet 3D masses, left panel, and Fig. 3c and Fig. d, which are in the same orientation). Whereas 2D averages are performed using square projections only, most of the input data for 3D reconstruction come from other views. Thus, agreement in the differences detected by the 2D and 3D analyses is a further test of the internal consistency of the results.
The attachment of IpTxa-B:SA (Fig. 4 c, violet regions) to the RyR1 appears to occur near the base of the crevice (Fig. 5 a), indicating that IpTxa-B, the link between RyR1 and SA, is probably located at this region of the difference map.
Figure 5.
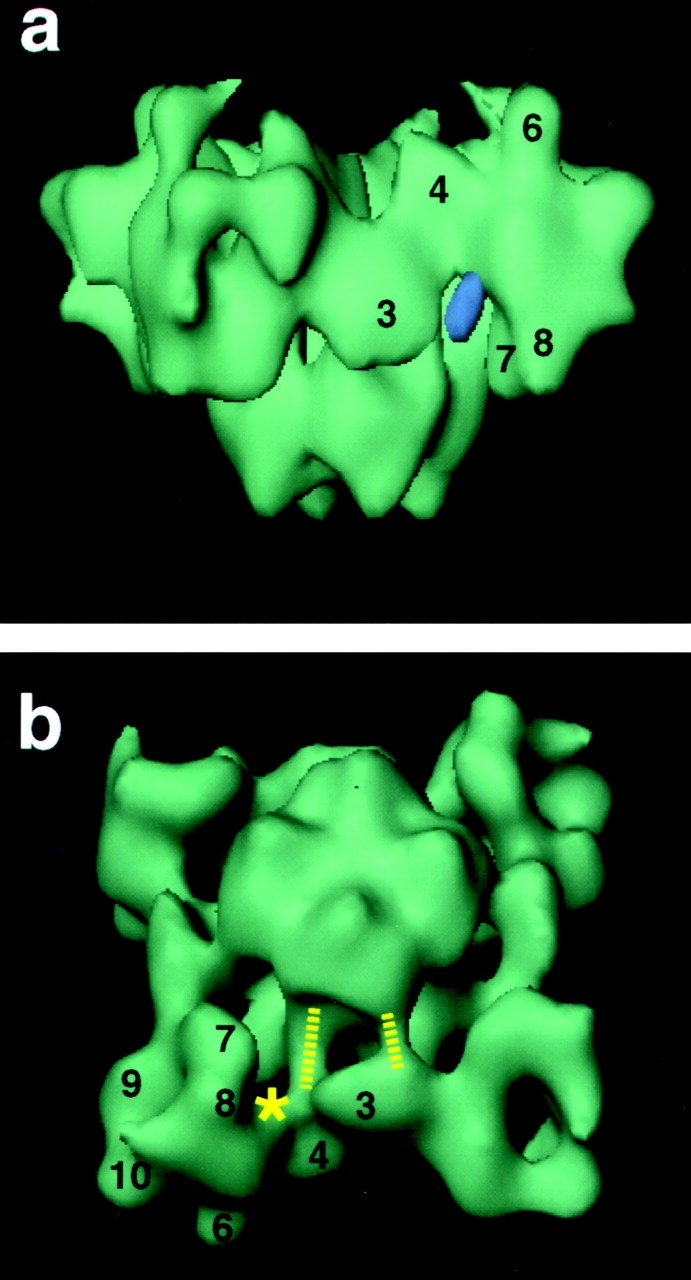
3D reconstructions of the control RyR1 displayed in different orientations to illustrate specific features. (a) Likely site of attachment of IpTxa to RyR1. The difference map was displayed at a higher threshold (in violet) to determine the region of higher rigidity. This region remains connected to the RyR1 structure at one location, suggesting that this is the attachment site. (b) The dashed lines indicate bridges of mass connecting domain 3 and the transmembrane assembly. The asterisk indicates the likely site of attachment of IpTxa.
The apparent size of the surface-rendered difference between the experimental and control reconstructions appears to be smaller than SA's dimensions. This discrepancy likely results from a loss of signal at the distal regions of the SA due to its mobility, and thus dilution of the signal through averaging. Similar effects have been seen in reconstructions using antibodies as ligands (e.g., Yu et al. 1998). Furthermore, analysis of the variance associated with the 2D average of RyR1:IpTxa-B:SA shows locally high variance of the mass attributed to SA in the distal region, which would be consistent with mobility of this protein (not shown).
Although IpTxa has been shown to induce subconductance states in the RyR1 (Tripathy et al. 1998), our 3D reconstruction of the RyR1 containing bound IpTxa-B and SA does not reveal any major conformational changes such as were reported for ryanodine-modified RyR1 (Orlova et al. 1996). Perhaps minor differences exist, but they are unappreciable at our current resolution.
Discussion
Allosteric Activation by IpTxa
Binding of IpTxa to the RyR1 induces the appearance of subconductance states of long lifetime. Our finding that the IpTxa binding locations are far (<11 nm) from the center of the cytoplasmic side of the transmembrane region of the channel supports an allosteric mechanism of action of IpTxa as opposed to a mechanism involving direct positioning of the toxin within the ion conducting channel (both models have been discussed by Tripathy et al. 1998). IpTxa is the third modulator ligand of RyR1 that has been localized by cryo-microscopy and 3D reconstruction, and intriguingly, all three bind to sites on the cytoplasmic region of the receptor that are far from the transmembrane portion of RyR1. The other mapped ligands are calmodulin, which binds at a site near that found here for IpTxa, and FK506-binding protein, which binds at the periphery of the cytoplasmic region on the opposite side of domain 3 from that of IpTxa (Wagenknecht et al. 1997). It seems possible that domain 3 plays a key role in the allosteric mechanism of channel modulation by these ligands, perhaps by moving so as to affect the conformation of the transmembrane assembly to which it appears to be connected by a bridge of density (Fig. 5 b, short dashed line). IpTxa could also affect the transmembrane domain through the other bridge of density indicated by the long dashed line in Fig. 5 b, or through a concerted movement of both of them.
Mimicry by the II-III Loop of the α1 Subunit of the DHPR
Recently, convincing evidence has been reported in support of the hypothesis that IpTxa mimics the effects of RyR1-activating peptides derived from the DHPR (Gurrola et al. 1999). Specifically, residues 681–687 (Arg-Lys-Arg-Arg-Lys-Met-Ser), which lie in the cytoplasmic II-III loop (residues 666–791; Tanabe et al. 1990) of the α1 subunit of the DHPR, are crucial for the activating effects that the isolated II-III loop and various derived subfragments have on the RyR1 (Lu et al. 1994, Lu et al. 1995; El-Hayek et al. 1995a; El-Hayek and Ikemoto 1998). A similar cluster of basic amino acids followed by a hydroxyl-containing amino acid occurs at residues 19–26 of IpTxa (Lys-Lys-Cys-Lys-Arg-Arg-Gly-Thr) and is essential for the effects of IpTxa on RyR1 (Gurrola et al. 1999). Although the precise role of the II-III loop in E-C coupling seems to be complex, including its relationship to other regions of the DHPR or other components of the triad junction (El-Hayek and Ikemoto 1998; Leong and MacLennan 1998b; Nakai et al. 1998), the mimicry shown by IpTxa suggests that the site of IpTxa binding on the 3D architecture of RyR1 can potentially correspond to a DHPR interaction site crucial for E-C coupling.
In this context, the 37–amino acid sequence Arg1076–Asp1112 from RyR1 that interacts with the DHPR II-III loop identified by Leong and MacLennan 1998a,Leong and MacLennan 1998b would locate at the base of the crevice between domains 3 and 7/8.
To correlate further our results with the work implicating IpTxa as a DHPR mimic, we examined how the density attributed to IpTxa-B:SA in our reconstruction (Fig. 4 c, violet) fits into the known quaternary arrangement of DHPRs at the triad junction (Block et al. 1988). The distance between the centers of mass of neighboring IpTxa-B:SA is 15 nm, which would lie within the boundaries defined by the morphologic units (DHPRs) comprising the tetrads seen by freeze-fracture EM (for this comparison we project the four IpTxa-B:SA per RyR1 and the four subunits of a tetrad into a plane normal to the axis of fourfold symmetry). In the orthogonal direction (i.e., parallel to the fourfold axis of the RyR1s), the differences attributed to IpTxa-B:SA are <5 nm from the T tubule–facing side of domain 4 of RyR1 (Fig. 4 c, side view). For the basic sequence of the II-III loop to extend to this region would apparently require a fully extended conformation for the first 15 residues of the II-III loop that precede it (El-Hayek et al. 1995a). Alternatively, a less extended configuration would suffice if the interaction between RyR1 and DHPR involves more interdigitation than supposed.
Regardless of the potential use of IpTxa as a tool to help elucidate E-C coupling, it is important to emphasize that IpTxa produces discrete functional effects on RyR1 that ultimately lead to calcium release in isolated SR vesicles (Gurrola et al. 1999) and in skinned muscle cells (Shiftman et al. 1999). Thus, activation of the IpTxa binding domain identified here must lead to conformational changes in RyR1 that shift channel conductance.
In conclusion, we have found by cryo-EM and 3D reconstruction that IpTxa binds to RyR1 along the edges of the cytoplasmic assembly, in a crevice between the clamp and handle domains. We suggest that a subtle conformational change mediates pore gating and toxin binding, and we discuss the possibility that the toxin binding location represents one of the physiological activating sites of RyR1 during E-C coupling.
Acknowledgments
The authors gratefully acknowledge the use of the Wadsworth Center Electron Microscopy and Research Computing core facilities. We thank the Peptide Synthesis, Mass Spectroscopy and Biochemistry core facilities for synthesis and analysis of IpTxa and IpTxa-B; Jon Berkowitz for the purification of RyR1; and Brenda Benacquista for help in preparation of 2.
R. Trujillo was supported in part by the Ministry of Education and Culture of Spain. This work was supported by grants from the National Institutes of Health AR40615 (to T. Wagenknecht) and HL55438 (to H.H. Valdivia).
Footnotes
1.used in this paper: 2D, two-dimensional; 3D, three-dimensional; DHPR, dihydropyridine receptor; E-C, excitation-contraction; IpTxa, imperatoxin A; IpTxa-B, IpTxa-biotin conjugate; RyR, ryanodine receptor; RyR1, skeletal muscle isoform of the ryanodine receptor; SA, streptavidin; SR, sarcoplasmic reticulum; T tubule, transverse tubule
References
- Block B.A., Imagawa T., Campbell K.P., Franzini-Armstrong C. Structural evidence for direct interaction between the molecular components of the transverse tubule/sarcoplasmic reticulum junction in skeletal muscle. J. Cell Biol. 1988;107:2587–2600. doi: 10.1083/jcb.107.6.2587. [DOI] [PMC free article] [PubMed] [Google Scholar]
- Boisset N., Penczek P.A., Taveau J.C., You V., Dehaas F., Lamy J. Overabundant single-particle electron microscope views induce a three-dimensional reconstruction artifact. Ultramicroscopy. 1998;74:201–207. [Google Scholar]
- Catterall W.A. Functional subunit structure of voltage-gated calcium channels. Science. 1991;253:1499–1500. doi: 10.1126/science.1654596. [DOI] [PubMed] [Google Scholar]
- El-Hayek R., Ikemoto N. Identification of the minimum essential region in the II-III loop of the dihydropyridine receptor α1 subunit required for activation of skeletal muscle-type excitation-contraction coupling. Biochemistry. 1998;37:7015–7020. doi: 10.1021/bi972907o. [DOI] [PubMed] [Google Scholar]
- El-Hayek R., Antoniu B., Wang J., Hamilton S.L., Ikemoto N. Identification of calcium release-triggering and blocking regions of the II-III loop of the skeletal muscle dihydropyridine receptor J. Biol. Chem. 270 1995. 22116 22118a [DOI] [PubMed] [Google Scholar]
- El-Hayek R., Lokuta A.J., Arevalo C., Valdivia H.H. Peptide probe of ryanodine receptor function. Imperatoxin A, a peptide from the venom of the scorpion Pandinus imperator, selectively activates skeletal-type ryanodine receptor isoforms J. Biol. Chem. 270 1995. 28696 28704b [DOI] [PubMed] [Google Scholar]
- Frank, J. 1996. Three-Dimensional Electron Microscopy of Macromolecular Assemblies. Academic Press, New York.
- Frank J., Radermacher M., Penczek P., Zhu J., Li Y., Ladjadj M., Leith A. SPIDER and WEBprocessing and visualization of images in 3D electron microscopy and related fields. J. Struct. Biol. 1996;116:190–199. doi: 10.1006/jsbi.1996.0030. [DOI] [PubMed] [Google Scholar]
- Franzini-Armstrong C., Protasi F. Ryanodine receptors of striated musclesa complex channel capable of multiple interactions. Physiol. Rev. 1997;77:699–729. doi: 10.1152/physrev.1997.77.3.699. [DOI] [PubMed] [Google Scholar]
- Gurrola G.B., Arevalo C., Sreekumar R., Lokuta A.J., Walker J.W., Valdivia H.H. Activation of ryanodine receptors by imperatoxin A and a peptide segment of the II-III loop of the dihydropyridine receptor. J. Biol. Chem. 1999;274:7879–7886. doi: 10.1074/jbc.274.12.7879. [DOI] [PubMed] [Google Scholar]
- Leong P., MacLennan D.H. A 37-amino acid sequence in the skeletal muscle ryanodine receptor interacts with the cytoplasmic loop between domains II and III in the skeletal muscle dihydropyridine receptor J. Biol. Chem. 273 1998. 7791 7794a [DOI] [PubMed] [Google Scholar]
- Leong P., MacLennan D.H. The cytoplasmic loops between domains II and III and domains III and IV in the skeletal muscle dihydropyridine receptor bind to a contiguous site in the skeletal muscle ryanodine receptor J. Biol. Chem. 273 1998. 29958 29964b [DOI] [PubMed] [Google Scholar]
- Lu X., Xu L., Meissner G. Activation of the skeletal muscle calcium release channel by a cytoplasmic loop of the dihydropyridine receptor. J. Biol. Chem. 1994;269:6511–6516. [PubMed] [Google Scholar]
- Lu X., Xu L., Meissner G. Phosphorylation of dihydropyridine receptor II-III loop peptide regulates skeletal muscle calcium release channel function. Evidence for an essential role of the β-OH group Ser687 . J. Biol. Chem. 1995;270:18459–18464. doi: 10.1074/jbc.270.31.18459. [DOI] [PubMed] [Google Scholar]
- Malhotra A., Penczek P., Agrawal R.K., Gabashvilli I.S., Grassucci R.A., Jünemann R., Burkhardt N., Nierhaus K.H., Frank J. Escherichia coli 70 S ribosome at 15 Å resolution by cryo-electron microscopylocalization of fMet-tRNAMet f and fitting of L1 protein. J. Mol. Biol. 1998;280:103–116. doi: 10.1006/jmbi.1998.1859. [DOI] [PubMed] [Google Scholar]
- Nakai J., Tanabe T., Konno T., Adams B., Beam K.G. Localization in the II-III loop of the dihydropyridine receptor of a sequence critical for excitation-contraction coupling. J. Biol. Chem. 1998;273:24983–24986. doi: 10.1074/jbc.273.39.24983. [DOI] [PubMed] [Google Scholar]
- Orlova E.V., Serysheva I.I., van Heel M., Hamilton S.L., Chiu W. Two structural configurations of the skeletal muscle calcium release channel. Nature Struct. Biol. 1996;3:547–552. doi: 10.1038/nsb0696-547. [DOI] [PubMed] [Google Scholar]
- Penczek P.A., Grassucci R.A., Frank J. The ribosome at improved resolutionnew techniques for merging and orientation refinement in 3D cryo-electron microscopy of biological particles. Ultramicroscopy. 1994;53:251–270. doi: 10.1016/0304-3991(94)90038-8. [DOI] [PubMed] [Google Scholar]
- Radermacher M., Rao V., Grassucci R., Frank J., Timerman A.P., Fleischer S., Wagenknecht T. Cryo-electron microscopy and three-dimensional reconstruction of the calcium release channel ryanodine receptor from skeletal muscle. J. Cell Biol. 1994;127:411–423. doi: 10.1083/jcb.127.2.411. [DOI] [PMC free article] [PubMed] [Google Scholar]
- Rios E., Pizarro G. Voltage sensor of excitation-contraction coupling in skeletal muscle. Physiol. Rev. 1991;71:849–908. doi: 10.1152/physrev.1991.71.3.849. [DOI] [PubMed] [Google Scholar]
- Samsó M., Wagenknecht T. Contributions of electron microscopy and single-particle techniques to the determination of the ryanodine receptor three-dimensional structure. J. Struct. Biol. 1998;121:172–180. doi: 10.1006/jsbi.1997.3955. [DOI] [PubMed] [Google Scholar]
- Schneider M.F., Chandler W.K. Voltage dependent charge movement of skeletal musclea possible step in excitation-contraction coupling. Nature. 1973;242:244–246. doi: 10.1038/242244a0. [DOI] [PubMed] [Google Scholar]
- Serysheva I.I., Orlova E.V., Chiu W., Sherman M.B., Hamilton S.L., van Heel M. Electron cryomicroscopy and angular reconstitution used to visualize the skeletal muscle calcium release channel. Nature Struct. Biol. 1995;2:18–24. doi: 10.1038/nsb0195-18. [DOI] [PubMed] [Google Scholar]
- Shiftman A., Ward C.W., Valdivia H.H., Schneider M.F. Induction of long duration Ca2+ release events by imperatoxin A in frog skeletal muscle. Biophys. J. 1999;76:A465. [Google Scholar]
- Tanabe T., Beam K.G., Adams B.A., Nicodome T., Numa S. Regions of the skeletal muscle dihydropyridine receptor critical for excitation-contraction coupling. Nature. 1990;346:567–569. doi: 10.1038/346567a0. [DOI] [PubMed] [Google Scholar]
- Tripathy A., Resch W., Xu L., Valdivia H.H., Meissner G. Imperatoxin A induces subconductance states in Ca2+ release channels (ryanodine receptors) of cardiac and skeletal muscle. J. Gen. Physiol. 1998;111:679–690. doi: 10.1085/jgp.111.5.679. [DOI] [PMC free article] [PubMed] [Google Scholar]
- Wagenknecht T., Radermacher M., Grassucci R., Berkowitz J., Xin H.-B., Fleischer S. Locations of calmodulin and FK506-binding protein on the three-dimensional architecture of the skeletal muscle ryanodine receptor. J. Biol. Chem. 1997;272:32463–32471. doi: 10.1074/jbc.272.51.32463. [DOI] [PubMed] [Google Scholar]
- Yu X., Shibata T., Egelman E.H. Identification of a defined epitope on the surface of the active recA-DNA filament using a monoclonal antibody and three-dimensional reconstruction. J. Mol. Biol. 1998;283:985–992. doi: 10.1006/jmbi.1998.2141. [DOI] [PubMed] [Google Scholar]
- Zamudio F.Z., Gurrola G.B., Arevalo C., Sreekumar R., Walker J.W., Valdivia H.H., Possani L.D. Primary structure and synthesis of imperatoxin A (IpTxa), a peptide activator of Ca2+ release channels ryanodine receptors. FEBS (Fed. Eur. Biochem. Soc.) Lett. 1997;405:385–389. doi: 10.1016/s0014-5793(97)00227-5. [DOI] [PubMed] [Google Scholar]