Abstract
Although tumor necrosis factor (TNF) initially came to prominence because of its anti-tumor activity, most attention is now focused on its proinflammatory actions. TNF appears to play a critical role in both early and late events involved in inflammation, from localizing the noxious agent and amplifying the cellular and mediator responses at the local site and systemically, to editing (e.g., apoptosis) injured cells or effete immune cells and repairing inflammatory damage. We have generated mice deficient in TNF (TNF−/− mice) and have begun to examine the multiple functions attributed to TNF. TNF−/− mice develop normally and have no gross structural or morphological abnormalities. As predicted, they are highly susceptible to challenge with an infectious agent (Candida albicans), are resistant to the lethality of minute doses of lipopolysaccharide (LPS) following D-galactosamine treatment, have a deficiency in granuloma development, and do not form germinal centers after immunization. Phagocytic activity of macrophages appears relatively normal, as do T cell functions, as measured by proliferation, cytokine release, and cytotoxicity. B cell response to thymus-independent antigens is normal, but the Ig response to thymus-dependent antigen is reduced. Surprisingly, cytokine production induced by LPS appears essentially intact, with the exception of reduced colony-stimulating factor activity. Other unexpected findings coming from our initial analysis are as follows. (i) TNF has low toxicity in TNF−/− mice. (ii) TNF−/− mice show an anomalous late response to heat-killed Corynebacterium parvum. In contrast to the prompt response (granuloma formation, hepatosplenomegaly) and subsequent resolution phase in C. parvum-injected TNF+/+ mice, similarly treated TNF−/− mice show little or no initial response, but then develop a vigorous, disorganized inflammatory response leading to death. These results suggest that TNF has an essential homeostatic role in limiting the extent and duration of an inflammatory process—i.e., an anti-inflammatory function. (iii) In contrast to the expectation that TNF+/+ mice and TNF+/− mice would have identical phenotypes, TNF+/− mice showed increased susceptibility to high-dose LPS lethality, increased susceptibility to Candida challenge, and delayed resolution of the C. parvum-induced inflammatory process, indicating a strong gene dose requirement for different actions of TNF.
Tumor necrosis factor (TNF) was originally defined on the basis of its ability to induce hemorrhagic necrosis of transplanted mouse tumors and by its selective cytotoxicity for transformed cells (1). In the decades since its discovery, TNF has been found to play a key role in orchestrating the complex events involved in inflammation and immunity (2, 3). These responses are mediated by the binding of TNF to at least two receptors, TNF-receptor 1 (TNF-R1) and TNF-receptor 2 (TNF-R2), which are expressed by most nucleated cells and are members of a family of related receptors (4). Lymphotoxin α (LT-α) and lymphotoxin β (LT-β), proteins that share sequence homology with TNF, are encoded by genes flanking the TNF gene in the major histocompatibility complex of the mouse. While homotrimers of TNF or LT-α compete for binding to TNF-R1 and TNF-R2, heterotrimers of LT-α and LT-β interact with a distinct member of the TNF receptor family, the LT-β receptor, mediated by binding through the LT-β subunit (5). The almost ubiquitous expression of TNF receptors, the production of TNF by a number of different cell types under a variety of immune and inflammatory conditions, and the complex interaction between members of the growing family of TNF ligands and receptors have greatly complicated attempts to define the precise physiological role of TNF.
To investigate the functions of TNF in vivo, a number of groups have characterized mice deficient in the genes for the TNF receptors, TNF, or the related ligands LT-α and LT-β (6–13), and analysis of these mice has established some consistent observations. Deficiency in TNF or TNF-R2 renders mice somewhat less sensitive to high-dose lipopolysaccharide (LPS) toxicity (8, 12). Mice deficient in TNF or TNF-R1 are far more resistant to lethality induced by LPS under conditions where hepatic RNA and, ultimately, protein synthesis, is inhibited by D-galactosamine (D-gal) (6, 7, 12). TNF-, TNF-R1-, or TNF-R2-deficient mice succumb to infection with Listeria monocytogenes, an agent normal mice can control (6–8, 12). An unexpected result of these studies was the demonstration that the ligands LT-α, LT-β, and the receptors TNF-R1 and LT-βR play an important role in lymphoid organ development. Mice deficient in these proteins lack Peyer’s patches, and in the case of LT-α, lymph nodes are also absent (9, 10, 14). Mice deficient in LT-α, TNF-R1, or TNF have also been shown to be compromised in their ability to form germinal centers in the spleen after immunization and in the maturation of the antibody response (10–12, 15, 16). In this study, we describe the generation of a TNF-deficient mouse and characterize the response of these mice to a variety of inflammatory, infectious, and antigenic stimuli.
MATERIALS AND METHODS
Generation of TNF−/− Mice.
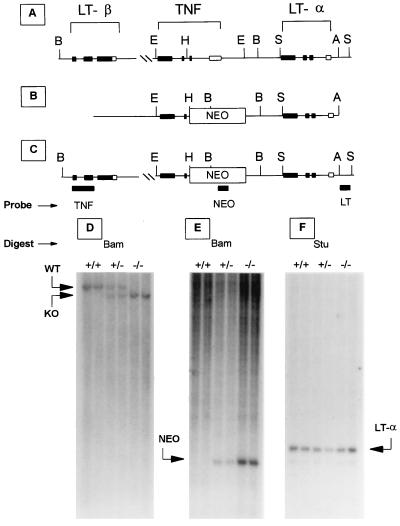
A genomic clone containing the complete coding sequences of LT-α and TNF (GenBank accession no. Y00467; a gift from C. V. Jongeneel, Lausanne, Switzerland) has been sequenced and each nucleotide assigned a unique number ranging from 1 to 7208. A replacement-type targeting vector was constructed composed of nucleotides 1052 (AvrII)-6463 (EcoRI), in which a phosphoglycerate kinase (PGK)-neomycin (neo) expression cassette (17) replaced nucleotides 3704–5364 of the TNF gene in the plasmid PGEM-5Z. Transfection of W9.5 embryonic stem cells (18) and blastocyst injection were performed as described (19). Disruption of the TNF-α allele was confirmed by Southern blot analysis of BamHI-digested genomic DNA after hybridization with a SmaI–SmaI fragment (see Fig. 1C). Southern blot analysis of the LT-α gene was accomplished using a PCR-generated probe corresponding to the region between nucleotides 908 and 1032 (see Fig. 1C). The introduced PGK-neo cassette was analyzed using a BamHI–StuI fragment of the neo gene (see Fig. 1C). Mice were housed in a specific pathogen-free environment and tested monthly to confirm their pathogen-free status. Experiments were performed in accordance with protocols approved by the Memorial Sloan–Kettering Cancer Center Institutional Animal Care and Use Committee.
Figure 1.
Schematic diagram of the targeted disruption of the TNF gene in mice. (A) Structure of the linked wild-type LT-α, TNF, and LT-β genes. Solid boxes indicate exons and restriction sites are indicated as follows: A, AvrI; E, EcoRI; B, BamHI; H, HindIII; S, StuI. (B) Targeting construct and (C) targeted TNF gene. Targeting results in the insertion of a PGK-neo cassette and acquisition of a novel BamHI site as indicated. The location of the Southern probes for TNF (TNF), PGK-neo (NEO), and LT-α (LT) genes are indicated. (D) Southern blot analysis of BamHI-digested genomic DNA probed with a TNF-specific probe demonstrates that the TNF gene (TNF) is disrupted by the insertion of the PGK-neo cassette yielding the wild-type 12-kb band only in TNF+/+ mice, the shorter 11-kb fragment only in TNF−/− mice, and both fragments in TNF+/− mice. (E) Southern blot analysis of BamHI-digested genomic DNA using a PGK-neo-specific probe demonstrates the predicted gene dosage effect (NEO) in TNF+/+, TNF+/−, or TNF−/− mice, and no other sites of integration. (F) Southern blot analysis of StuI-digested genomic DNA using an LT-α-specific probe demonstrates that the LT-α gene is not affected by integration of the targeting construct in TNF+/+, TNF+/−, or TNF−/− mice.
Cytokine Measurements.
Serum levels of cytokines and inflammatory mediators were quantitated by ELISA or bioassay with reagents from the following sources: TNF-α; interferon γ (Genzyme); interleukin (IL)-1β (Endogen, Cambridge, MA); granulocyte–macrophage colony-stimulating factor (GM-CSF), IL-6, IL-10 (R&D Systems, Minneapolis); IL-12, (SAA) macrophage chemotactic protein-1 (MCP-1), serum amyloid A (BioSource International, Camarillo, CA), nitrite (Alexis, San Diego). Serum TNF levels were confirmed using a cytotoxicity assay based on WEHI 164 clone 13 (20). Total CSF levels were determined by plating sera at 50, 25, 10, 5, and 1 μl per 1 ml agarose cultures containing 5 × 10⁴ BALB/c bone marrow cells. Colonies were scored at 7 days and units calculated per milliliter. One unit was defined as one colony on the linear part of the dose response curve. The number of observations per point ranged from 3 to 6. The number of colonies per 5 × 10⁴ marrow cells using the specific CSF types, granulocyte (G), GM-CSF, and CSF-1, at saturating concentrations (1,000 units per ml) served as control values. Bioassays of CSF-1 (21) and G-CSF (22) levels were measured as described. Kit ligand concentrations were defined using a specific bioassay (P. Besmer, unpublished observations). Sera from 2–4 animals at each time point were measured separately and plotted as the mean concentration plus error bars representing the SEM.
Corynebacterium parvum.
Mice were injected i.p. with 1 mg of heat-killed C. parvum (Burroughs Wellcome) and sacrificed at 10-day intervals. In the case of C. parvum priming for LPS-induced TNF production, mice were injected i.p. with 10 μg LPS 10 days after injection of C. parvum and serum was harvested at 1.5 hr after LPS. For determining lethality, mice were injected with C. parvum and observed daily for a period of 100 days.
Neutrophil Respiratory Burst.
Respiratory burst activity was measured by flow cytometric analysis of phorbol 12-myristate 13-acetate (Sigma) or immune complex-stimulated (Molecular Probes) whole blood (23).
Phagocytosis in Vitro and in Vivo.
Phagocytic activity of thioglycollate-elicited macrophages for sheep red blood cells (SRBC) (Cedarlane Laboratories), or opsonized SRBC using subagglutinizing doses of anti-sheep IgG (Sigma), and the induction of nitrite were determined (24). Phagocytosis of latex beads (nos. 15700, 15702, and 17147; Polysciences) or colloidal carbon particles (Sanford, Lewisburg, TN) was determined by scoring particle positive macrophages after a 1-hr incubation at 37°C. Phagocytosis of Candida albicans in vitro by peritoneal macrophages (25) and clearance of C. albicans or colloidal carbon in vivo were quantitated (26, 27).
T Cell Activities.
To measure antigen-induced T cell proliferation and cytokine production, mice were immunized in the rear footpad with 100 μg of keyhole limpet hemocyanin (Pierce) in 0.05 ml of sterile saline in incomplete Freund’s adjuvant (Sigma). Cells of the popliteal lymph nodes were isolated 7–10 days after immunization and treated with anti-Lyt 2.2 mAb and preselected rabbit serum as a source of complement before passage through a column of nylon wool. The resulting cells were greater than 90% Thy-1+ CD4+, and 1 × 10⁵ cells were cultured at 37°C in 5% CO2 in air with mitomycin C-treated antigen-presenting spleen cells pulsed with keyhole limpet hemocyanin. Proliferative response was determined after 3 days in culture by incorporation of [3H]thymidine for 18–24 hr. Cytokine production was determined using cytokine-specific ELISA as described above.
The mixed lymphocyte response was measured by uptake of [3H]thymidine by 3 × 10⁵ responder spleen cells (H-2b) after 4-day incubation with 2 × 10⁵ mitomycin C-treated stimulator BALB/c spleen cells (H-2d). Allogeneic cytotoxic T cell response was determined by the incubation of 3 × 10⁷ responder spleen cells with 2 × 10⁷ BALB/c spleen cells for 5 days. Cytotoxicity was determined using 51Cr-labeled BALB/c target cells (RL ♂ 1). For the generation of antigen-specific cytotoxic T cell response, mice were immunized with OVA peptide (SIINFKL) in TiterMax (CytRx, Norcross, GA). Spleen cells (2.5 × 10⁷) from immunized mice were cultured with OVA peptide-pulsed and mitomycin C-treated spleen cells for 5 days. Cytotoxicity was assessed in a 51Cr release assay using EL-4 cells pulsed with OVA peptide.
Antibody Production and Germinal Center Formation.
Mice were immunized by rear footpad injection with 25 μg of trinitrophenyl-Ficoll (TNP-Ficoll) or by i.p. injection with 0.2 ml of sterile saline containing 2 × 10⁸ SRBC (28). Immune complex trapping was visualized by i.v. injection of 50 μl of rabbit peroxidase alkaline phosphatase complexes (Dako) as described (29). Sera from mice on days 0, 6, and 15 were assayed by TNP-Ficoll or SRBC-specific ELISA using class and subclass reagents (Southern Biotechnology Associates).
LPS, Staphlococcal Enterotoxin B, and TNF.
LPS (serotype 0127:B8), staphlococcal enterotoxin B, D-Gal (Sigma), and recombinant murine TNF (PharMingen) were diluted in pyrogen-free saline and injected. Mice were monitored for 7 days after injection.
Infection with C. albicans.
Mice were injected i.v. with 1 × 10⁵ live C. albicans (ATCC 18804) and killed at the indicated times. To quantitate the number of viable organisms, tissues were removed aseptically and homogenized in a volume of water equal in milliliters to the tissue–gram weight. Ten-fold dilutions of homogenate were cultured overnight on plates of Sabouraud dextrose agar and the colony forming units per gram of tissue were determined. Mice were monitored daily for 30 days after injection of C. albicans.
Statistics.
Groups of four or more mice were used for each experiment. Data are presented as means ± SEM. To test for statistically significant differences, the unpaired Student’s t test and Fisher’s exact test were used.
RESULTS
Disruption of the TNF Gene.
A replacement-type targeting vector designed to inactivate the TNF gene was constructed (Fig. 1B). The vector contains a 2.5-kb fragment from the 5′-flanking region of the mouse TNF locus (which includes the LT-α gene coding sequence), a PGK-neo expression cassette, and an ≈1-kb fragment spanning exons 3 and 4 of the TNF gene. Integration of the targeting vector results in the deletion of a 2.2-kb fragment containing the promoter region, transcriptional start site, and exons 1 and 2 of the TNF gene. These exons encode a portion of the mature TNF domain as well as the leader sequence, a highly conserved region required for proper intracellular processing (30). Of 184 cells transfected with this construct, 2 tested positive for the targeted TNF gene by Southern blot analysis of genomic DNA. Chimeric mice generated from both targeted embryonic stem cell lines transmitted the targeted allele to their offspring in a Mendelian fashion. Heterozygous mice derived from these chimeras were mated to generate the TNF−/−, TNF+/−, and TNF+/+ littermates described here. The insertion of the neo resistance cassette introduced a novel BamHI site (Fig. 1B) and this was used for genotyping the mice. Southern blot analysis of genomic DNA digested with BamHI and probed with an SmaI fragment from outside the TNF locus (Fig. 1C), yielded a 12-kb band in the case of TNF+/+ mice and a smaller 11-kb fragment in TNF−/− mice (Fig. 1D). Southern blot analysis of BamHI-digested genomic DNA probed with a neo probe (Fig. 1C), produced bands of the expected intensity and size in TNF−/− mice and TNF+/− littermates (Fig. 1E). To establish that disruption of the TNF locus did not result in a rearrangement of the 5′-flanking region, genomic DNA was digested with StuI, an enzyme that digests genomic DNA at sites flanking the LT-α locus. Southern blot analysis using a LT-α specific probe (Fig. 1C) confirms that the LT-α gene is intact in TNF−/−, TNF+/−, and TNF+/+ mice (Fig. 1F).
TNF Production.
Serum levels of TNF in TNF+/+ or TNF+/− mice 1.5 hr after LPS challenge were in the range of 3–10 ng/ml (Table 1). TNF−/− mice failed to produce TNF (Table 1). A more rigorous way to demonstrate that TNF−/− mice lack the capacity to produce TNF involves LPS treatment of C. parvum-primed mice. C. parvum-primed TNF+/+ or TNF+/− mice produce 1,000–5,000 ng/ml TNF, whereas TNF−/− mice lacked detectable TNF as defined by ELISA (Table 1) or bioassay (data not shown).
Table 1.
LPS-induced TNF production
| Treatment | Serum TNF (ng/ml)
|
||
|---|---|---|---|
| TNF+/+ | TNF+/− | TNF−/− | |
| LPS (100 μg) | 9.0 ± 0.6 | 3.0 ± 0.5* | 0 |
| C. parvum + LPS (10 μg) | 1,500 ± 450 | 3,000 ± 1,500 | 0 |
Serum TNF levels 1.5 h after i.p. injection of LPS. C. parvum was injected 10 days before LPS.
P < 0.05 compared with TNF+/+ mice.
General Characteristics of TNF−/− Mice.
TNF−/− mice appeared normal and exhibited no consistent histological or morphological abnormalities. Sex ratios, litter size, and weight gain of TNF−/− mice were similar to TNF+/+ littermates. Comparison of TNF+/+ and TNF−/− mice revealed no significant differences in the distribution of lymphocyte, granulocyte, or monocyte populations (CD4−8−, CD4+CD8+, CD4+CD8−, CD8−CD4+, B220, and Mac-1) in the thymus, spleen, or peripheral blood. Hematocrit, platelet, and white cell counts were in the same range as control mice. Table 2 summarizes the functional characteristics of macrophage, neutrophil, T cell, and B cell populations in TNF−/− mice. By several parameters, macrophage, neutrophil, and T cell functions in TNF−/− mice were essentially indistinguishable from littermate controls. TNF−/− mice immunized with the thymus-independent antigen TNP-Ficoll generated similar antibody responses to those observed in TNF+/+ mice. In contrast, immunization of TNF−/− mice with the T cell-dependent antigen SRBC demonstrated a deficiency in the maturation of the normal antibody response, with TNF−/− mice developing normal levels of IgM but failing to develop significant titers of specific IgG subclasses.
Table 2.
Macrophage, neutrophil, T cell, and B cell functions in TNF−/− mice
| Functional characteristics | Response |
|---|---|
| Macrophage | |
| In vitro phagocytosis | |
| Latex beads, carbon particles | Normal |
| SRBC, C. albicans | Normal |
| Opsonized SRBC | Normal/elevated |
| In vitro nitric oxide production | |
| LPS, LPS + IFN-γ | Normal |
| IFN-γ | Normal/depressed |
| In vivo phagocytosis | |
| Carbon particles, C. albicans | Normal/depressed |
| Neutrophil | |
| Respiratory burst | |
| Immune complexes, PMA | Normal |
| T cell | |
| CD8 | |
| Cytotoxicity | |
| Allogeneic target, antigen specific | Normal |
| CD4 | |
| Mixed lymphocyte response | Normal |
| Antigen induced cytokines | |
| IL-2, IL-4, IL-10, IFN-γ | Normal |
| B cell | |
| Thymus-dependent response | |
| SRBC | |
| IgM, IgG2a, IgG3 | Normal |
| IgG1, IgG2b | Depressed |
| Thymus-independent response | |
| TNP-Ficoll | Normal |
In addition, TNF−/− mice failed to develop germinal centers in the spleen following immunization with SRBC, and the normal uptake of aggregated gamma globulin by follicular dendritic cells in the spleen of immunized mice was also absent in TNF−/− mice.
LPS-Induced Cytokine Release.
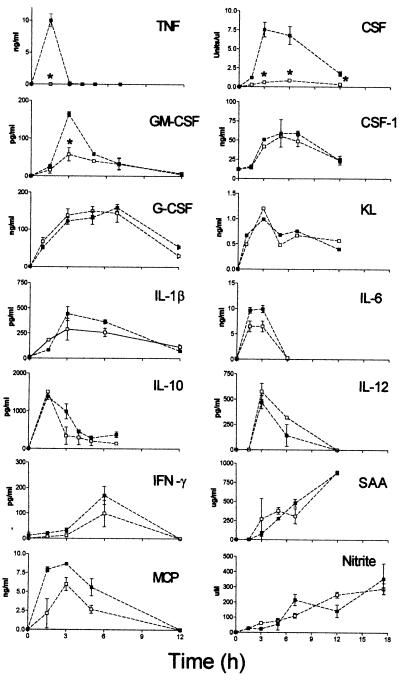
Treatment of normal mice with LPS up-regulates the production of a number of cytokines and inflammatory factors, and TNF is thought to be involved in mediating these responses (2, 3). The serum levels of IL-1β, IL-6, IL-10, IL-12, interferon-γ, SAA, MCP-1, and nitric oxide following LPS administration were not significantly different in TNF−/− mice as compared with TNF+/+ mice (Fig. 2). In contrast, the levels of CSF in serum of LPS-treated TNF−/− mice were appreciably lower (Fig. 2, CSF). Assays of individual CSF components demonstrated a 2- to 3-fold reduction in GM-CSF levels in TNF−/− mice (Fig. 2, GM-CSF), whereas G-CSF, CSF-1, or Kit ligand levels were not reduced (Fig. 2).
Figure 2.
Serum levels of inflammatory mediators after i.p. injection of 100 μg LPS. TNF+/+ mice (▪), TNF−/− mice (□); ∗, P < 0.05 compared with TNF+/+ mice.
Toxicity of LPS and TNF.
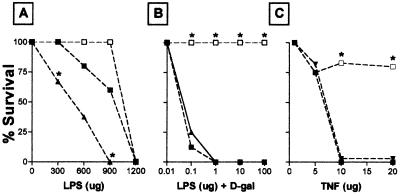
Fig. 3A shows responses of TNF+/+, TNF+/−, and TNF−/− mice to high doses of LPS. Similar to TNF+/+ mice, LPS-treated TNF+/− mice and TNF−/− mice became profoundly ill, experiencing shivering, lethargy, watery eyes, and diarrhea. At the 1200-μg dose level, all mice died. However, at the 600 and 900 μg dose level, TNF−/− mice appeared somewhat more resistant to the lethal effects of LPS, whereas TNF+/− mice showed an increased susceptibility. Fig. 3B illustrates the effect of a low dose of LPS in D-gal-treated mice. In contrast to the exquisite sensitivity of a D-gal-treated TNF+/+ and TNF+/− mice to LPS, TNF−/− mice are totally resistant. Similarly, TNF−/− mice are resistant to staphlococcal enterotoxin B in the presence of D-gal. TNF−/− mice also show a strong resistance to the lethal effect of recombinant mouse TNF (Fig. 3C).
Figure 3.
Survival after treatment with the indicated doses of (A) LPS alone, (B) LPS + D-gal (20 mg), (C) TNF. TNF+/+ mice (▪), TNF+/− mice (▴), TNF−/− mice (□); ∗, P < 0.05 compared with TNF+/− mice.
Response to C. albicans Infection.
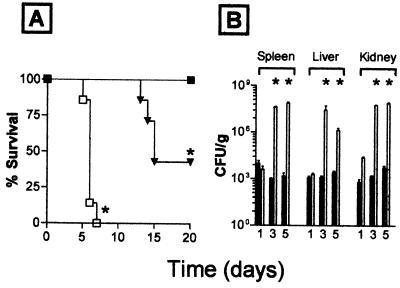
Fig. 4 shows the response of TNF−/− mice to challenge with C. albicans. Whereas TNF+/+ mice control the infection, TNF−/− mice cannot (Fig. 4A). TNF+/− mice exhibited an intermediate sensitivity to C. albicans, with 60% of animals dying after infection (Fig. 4A). The increased susceptibility of TNF−/− mice was associated with an increase in colony forming units in the tissues of infected mice (Fig. 4B).
Figure 4.
(A) Survival after infection with C. albicans. TNF+/+ mice (▪), TNF+/− mice (▴), TNF−/− mice (□). (B) Colony counts recovered from organs at the indicated times after infection. TNF+/+ mice (solid bars), TNF−/− mice (open bars); ∗, P < 0.05 compared with TNF+/− mice.
Response to Heat-Killed C. parvum.
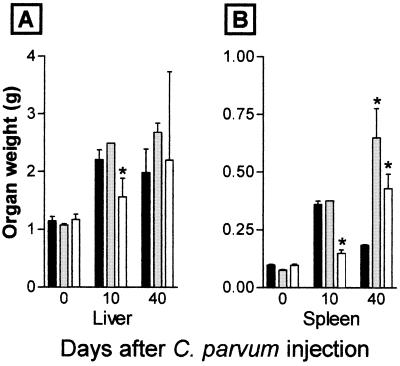
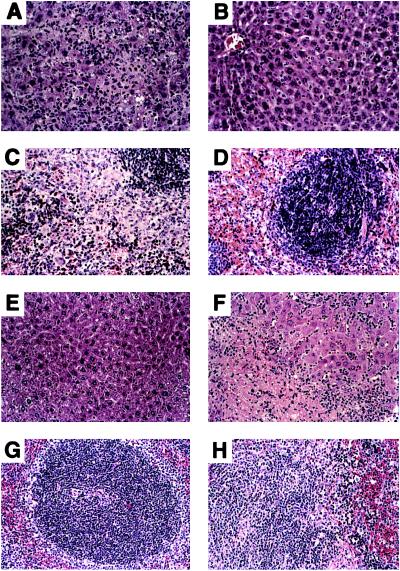
A single injection of heat-killed C. parvum induces a characteristic response pattern in normal mice consisting of hepatosplenomegaly, abundant granuloma formation, and prominent extramedullary hematopoiesis in the spleen. These responses peak at 10–14 days, with a progressive reversion to normal morphology by day 40 and a reduction in organ weight. No lethality is associated with C. parvum injection in normal mice. Fig. 5 shows the response of TNF+/+, TNF+/−, and TNF−/− mice to C. parvum. In contrast to TNF+/+ and TNF+/− mice, TNF−/− mice show no hepatosplenomegaly, granuloma formation or extramedullary hematopoiesis at day 10. By day 40, however, TNF−/− mice appear sick, with ruffled hair, enlarged livers and spleens, and the development of ascites in a proportion of mice. By day 80, C. parvum-injected TNF−/− mice die. The livers and spleens of the TNF−/− mice 40 days after C. parvum show sheet-like infiltrates of F4/80+ monocytic cells and poorly organized granulomas (Fig. 6 F and H). The livers of TNF−/− mice have disseminated foci of necrosis with regenerative changes in adjacent viable tissue (Fig. 6F). The early response of TNF+/− mice to C. parvum is similar to TNF+/+ mice, with development of granulomas and hepatosplenomegaly. However, unlike TNF+/+ mice, they do not down-regulate the inflammatory response, continuing to show massive hepatosplenomegaly after 40 days. In contrast to TNF−/− mice, C. parvum-treated TNF+/− mice do not become sick or die.
Figure 5.
Liver and spleen weight after C. parvum. TNF+/+ mice (solid columns), TNF+/− mice (shaded columns), TNF−/− mice (open columns); ∗, P < 0.05 compared with TNF+/+ mice.
Figure 6.
Histology of liver and spleen from C. parvum-treated TNF+/+ and TNF−/− mice (hematoxylin/eosin, ×200). (A–D) Liver and spleen sections from mice 10 days after C. parvum treatment showing characteristic inflammatory responses in liver (A) and spleen (C) of TNF+/+ mice and the absence of these responses and the preserved architecture of the liver (B) and spleen (D) of TNF−/− mice. (E–H) Liver and spleen sections from mice 40 days after C. parvum treatment showing the almost normal morphology typical of the down-regulated inflammatory response in liver parenchyma (E) and spleen (G) of TNF+/+ mice, and the late inflammatory infiltration in liver (F) and spleen (H) of TNF−/− mice.
DISCUSSION
Since the cloning of TNF in 1985, there has been an avalanche of new information about the multiple biological activities of this cytokine. Initial emphasis was on the toxicity of recombinant TNF in rodents and humans and the role of TNF as a mediator of LPS-induced toxicity (2, 3). Subsequent studies established that TNF is one of the central proinflammatory cytokines and that TNF is essential for recovery from infection with a number of different infectious agents. Until now, our knowledge of TNF physiology has come from indirect sources, e.g., in vitro systems, in vivo neutralization with anti-TNF antibody, transgenic mice expressing TNF or expressing soluble TNF receptors, and TNF-R1 and TNF-R2 knock-out mice. The construction of mice lacking the TNF gene provides a direct way to test many of the assumptions that have arisen about the role of this cytokine in health and disease. The apparently normal phenotype of unperturbed TNF−/− mice suggests that TNF does not have an irreplaceable role in prenatal tissue modeling or organogenesis. Lymphoid and hematopoietic development also appears to proceed normally, as indicated by morphological studies, cellular profiles in lymphoid organs and peripheral blood, and normal basal Ig levels. As far as we have tested, T cell functions involving CD4 and CD8 T cells are also normal. The presence of Peyer’s patches in TNF−/− mice distinguishes them from mice lacking TNF-R1 or the LT-α gene (9, 10, 14). However, as expected from previous studies (12), TNF−/− mice do not form germinal centers and produce lower levels of IgG antibodies (particularly IgG2b subclass) after immunization with SRBC. The IgM response to thymus-dependent and thymus-independent antigens appears uncompromised.
Although there continues to be uncertainty about the specific role of TNF in a number of disease states, results from TNF-deficient or TNF receptor-deficient animals confirm a critical role for TNF in three experimental models: (i) recovery from infectious challenges (6–8, 12, 31), (ii) granuloma formation (32), and (iii) the toxicity of minute doses of LPS for D-gal-treated mice (6, 7, 12). Our analysis of TNF−/− mice confirms these observations. Although there has been a widespread impression that TNF mediates the toxicity of high doses of LPS and is a key factor in septic shock, this view clearly needs revision, particularly in view of recent clinical trials showing no benefit from treatment with TNF antibody or soluble TNF receptors and a trend toward increased lethality in treated patients (33). TNF−/− mice show the same symptoms of toxicity as wild-type mice following high doses of LPS, implicating factors other than TNF in high-dose LPS toxicity. Understanding why TNF−/− mice require a slightly larger dose of LPS for lethality is complicated by the very high doses of LPS required (mice have an innate resistance to LPS) and by the unexpectedly increased sensitivity of TNF+/− mice to LPS lethality (see below).
Another widely held belief is that TNF plays a central role in initiating and regulating the cytokine cascade. Indeed, it has been suggested that TNF is one, if not the prime mover in initiating the inflammatory response. For this reason it was surprising to find so little perturbation in the pattern of LPS-induced cytokines in TNF−/− mice. Perhaps a different result might have been obtained with other inducing agents. A clear difference in CSF activity was found in serum of LPS-treated TNF−/− mice. The levels of the major contributors to this activity, namely CSF-1 and G-CSF, were unaltered. Serum GM-CSF levels were lower, but could not account for the difference in overall CSF activity. One possible explanation for the apparent decrease in CSF activity is the presence of a CSF inhibitor in the serum of LPS-treated TNF−/− mice. Alternatively, previous work has shown that TNF regulates expression of CSF receptors (34). Whether reduced CSF levels can account for the low CSF activity in the serum of TNF−/− mice, or whether inhibition of CSF receptor signaling is involved, needs further exploration.
The response of TNF−/− mice to heat-killed C. parvum provides a revealing picture of another facet of TNF that is less recognized than its role in tissue damage—the ability of TNF to regulate and limit the inflammatory response and to promote repair and recovery from infectious and toxic agents. The absence of granuloma formation, hepatosplenomegaly, and extramedullary hematopoiesis in TNF−/− mice 10 days after C. parvum is consistent with findings from prior work with TNF receptor-deficient mice or wild-type mice treated with neutralizing TNF antibody and challenged with other agents (bacillus Calmette–Guerin, Mycobacterium tuberculosis, Schistosomiasis) (32, 35, 36). However, we had not expected the florid inflammatory response that developed in TNF−/− mice 6–8 weeks after C. parvum, at a time when the inflammatory lesions in the TNF+/+ mice had resolved. (An advantage of using a heat-killed organism as the inflammatory stimulus is that the contribution of an evolving/resolving infectious process can be eliminated.) The delayed but progressive inflammatory process in C. parvum-injected TNF−/− mice, leading to hepatosplenomegaly, ascites, and death, reveals the two faces of TNF; proinflammatory in the initial phase of infection and inflammation and an anti-inflammatory/repair function after the infectious or toxic agent has been localized and controlled. TNF mediated killing of injured or effete cells, and induction of factors that down-regulate inflammation, such as IL-10 and transforming growth factor β, are likely involved in initiating and regulating this recovery process. A number of recent observations in TNF receptor-deficient mice support this general view that TNF has a critical role in limiting and reversing inflammation and tissue injury, e.g., more extensive brain damage after ischemic or excitotoxic brain injury (37), larger inflammatory lesions in Leishmania-infected mice (38), enhanced-contact hypersensitivity reactions (39), and accelerated lymphadenopathy in lpr mice (40). The delayed recovery of TNF−/− mice following immunization with myelin oligodendrocyte glycoprotein (J. Liu, M.W.M., G. Wong, D.G., A.D., J. Bettadepura, and C. C. A. Bernard, unpublished work) is also consistent with the notion that TNF is essential for the repair phase following inflammatory/immunological injury. In this regard, the compromised response of TNF+/− mice to C. parvum may give a clue as to the differential requirements for TNF in TNF-mediated proinflammatory and the anti-inflammatory/repair actions. Granuloma formation and hepatosplenomegaly appear to proceed normally in TNF+/− mice, but resolution is delayed, suggesting that the repair function has a more stringent requirement for TNF levels. Similarly, the greater susceptibility of TNF+/− mice to LPS lethality could be explained on the same basis, i.e., less TNF needed for damage than for repair. The increased sensitivity of Candida-infected TNF+/− mice indicates that the levels of TNF may be rate limiting during recovery from other infectious agents, and this gene dosage effect needs to be considered in future studies with TNF.
Acknowledgments
We would like to thank Drs. J. Cutler, G. Hodgson, V. Jongeneel, J. Thorbecke, R. Stanley, and B. Ryffel for their guidance; M. Dominguez for help with assay of CSF-1; Dr. J. Mann for the gift of W9.5 embryonic stem cells; and H. Pettelwaite for technical assistance.
ABBREVIATIONS
- CSF
colony-stimulating factor
- D-gal
D-galactosamine
- G-CSF
granulocyte CSF
- GM-CSF
granulocyte–macrophage CSF
- IL
interleukin
- LPS
lipopolysaccharide
- LT-α
lymphotoxin α
- LT-β
lymphotoxin β
- neo
neomycin
- PGK
phosphoglycerate kinase
- SRBC
sheep red blood cells
- TNF
tumor necrosis factor
- TNF-R1
TNF receptor 1
- TNF-R2
TNF receptor 2
References
- 1.Carswell E A, Old L J, Kassel R L, Green S, Fiore N, Williamson B. Proc Natl Acad Sci USA. 1975;72:3666–3670. doi: 10.1073/pnas.72.9.3666. [DOI] [PMC free article] [PubMed] [Google Scholar]
- 2.Beutler B, editor. Tumor Necrosis Factors: The Molecules and Their Emerging Role in Medicine. New York: Raven; 1992. [Google Scholar]
- 3.Aggarwal B B, Vilček J, editors. Tumor Necrosis Factors: Structure, Function, and Mechanism of Action. New York: Dekker; 1992. [PubMed] [Google Scholar]
- 4.Beutler B, van Huffel C. Science. 1994;264:667–668. doi: 10.1126/science.8171316. [DOI] [PubMed] [Google Scholar]
- 5.Crowe P D, VanArsdale T L, Walter B N, Ware C F, Hession C, Ehrenfels B, Browning J L, Din W S, Goodwin R G, Smith C A. Science. 1994;264:707–710. [PubMed] [Google Scholar]
- 6.Pfeffer K, Matsuyama T, Kündig T M, Wakeham A, Kishihara K, Shahinian A, Wiegmann K, Ohashi P S, Krönke M, Mak T W. Cell. 1993;73:457–467. doi: 10.1016/0092-8674(93)90134-c. [DOI] [PubMed] [Google Scholar]
- 7.Rothe J, Lesslauer W, Lötscher H, Lang Y, Koebel P, Köntgen F, Althage A, Zinkernagel R, Steinmetz M, Bluethmann H. Nature (London) 1993;364:798–802. doi: 10.1038/364798a0. [DOI] [PubMed] [Google Scholar]
- 8.Erickson S L, de Sauvage F J, Kikly K, Carver-Moore K, Pitts-Meek S, Gillett N, Sheehan K C, Schreiber R D, Goeddel D V, Moore M W. Nature (London) 1994;372:560–563. doi: 10.1038/372560a0. [DOI] [PubMed] [Google Scholar]
- 9.De Togni P, Goellner J, Ruddle N H, Streeter P R, Fick A, Mariathasan S, Smith S C, Carlson R, Shornick L P, Strauss-Schoenberger J, Russel J H, Karr R, Chaplin D D. Science. 1994;264:703–707. doi: 10.1126/science.8171322. [DOI] [PubMed] [Google Scholar]
- 10.Banks T A, Rouse B T, Kerley M K, Blair P J, Godfrey V L, Kuklin N A, Bouley D M, Thomas J, Kanangat S, Mucenski M L. J Immunol. 1995;155:1685–1693. [PubMed] [Google Scholar]
- 11.Le Hir M, Bluethmann H, Kosco-Vilbois M H, Muller M, di Padova F, Moore M, Ryffel B, Eugster H P. J Exp Med. 1996;183:2367–2372. doi: 10.1084/jem.183.5.2367. [DOI] [PMC free article] [PubMed] [Google Scholar]
- 12.Pasparakis M, Alexopoulou L, Episkopou V, Kollias G. J Exp Med. 1996;184:1397–1411. doi: 10.1084/jem.184.4.1397. [DOI] [PMC free article] [PubMed] [Google Scholar]
- 13.Amiot F, Bellkaid Y, Lebastard M, Ave P, Dautry F, Milon G. Eur Cytokine Network. 1996;7:733–739. [PubMed] [Google Scholar]
- 14.Neumann B, Luz A, Pfeffer K, Holzmann B. J Exp Med. 1996;184:259–264. doi: 10.1084/jem.184.1.259. [DOI] [PMC free article] [PubMed] [Google Scholar]
- 15.Matsumoto M, Mariathasan S, Nahm M H, Baranyay F, Peschon J J, Chaplin D D. Science. 1996;271:1289–1291. doi: 10.1126/science.271.5253.1289. [DOI] [PubMed] [Google Scholar]
- 16.Ryffel B, Di Padova F, Schreier M H, Le Hir M, Eugster H P, Quesniaux V F. J Immunol. 1997;158:2126–2133. [PubMed] [Google Scholar]
- 17.Tybulewicz V L J, Crawford C E, Jackson P K, Bronson R T, Mulligan R C. Cell. 1991;65:1153–1163. doi: 10.1016/0092-8674(91)90011-m. [DOI] [PubMed] [Google Scholar]
- 18.Mann J R, Stewart C L. Development (Cambridge, UK) 1991;113:1325–1333. doi: 10.1242/dev.113.4.1325. [DOI] [PubMed] [Google Scholar]
- 19.Bradley A. In: Teratocarcinomas and Embryonic Stem Cells: A Practical Approach. Robertson E J, editor. Oxford: IRL; 1987. pp. 152–178. [Google Scholar]
- 20.Espevik T, Nissen-Myer J. J Immunol Methods. 1986;95:99–105. doi: 10.1016/0022-1759(86)90322-4. [DOI] [PubMed] [Google Scholar]
- 21.Stanley E R. Methods Enzymol. 1985;116:564–587. doi: 10.1016/s0076-6879(85)16044-1. [DOI] [PubMed] [Google Scholar]
- 22.Metcalf D, Willson T, Rossner M, Lock P. Growth Factors. 1994;11:145–152. doi: 10.3109/08977199409001056. [DOI] [PubMed] [Google Scholar]
- 23.Vowells S J, Sekhsaria S, Malech H L, Shalit M, Fleisher T A. J Immunol Methods. 1995;178:89–97. doi: 10.1016/0022-1759(94)00247-t. [DOI] [PubMed] [Google Scholar]
- 24.Coligan E J, Kruisbeek A M, Margulies D H, Schevach E M, Strober W. Current Protocols in Immunology. Vol. 3. New York: Wiley; 1994. pp. 14.0.3–14.9.3. [Google Scholar]
- 25.Redmond H P, Shou J, Gallagher H J, Kelly C J, Daly J M. J Immunol. 1993;150:3427–3433. [PubMed] [Google Scholar]
- 26.Qian Q, Jutila M A, Van Rooijen N, Cutler J E. J Immunol. 1994;152:5000–5008. [PubMed] [Google Scholar]
- 27.Biozzi G, Benacerraf B, Halpern B N. Br J Pathol. 1953;34:441–457. [PMC free article] [PubMed] [Google Scholar]
- 28.Kelly B S, Levy J G, Sikora L. Immunology. 1979;37:45–52. [PMC free article] [PubMed] [Google Scholar]
- 29.Van den Berg T K, Döpp E A, Daha M R, Kraal G, Dijkstra C D. Eur J Immunol. 1992;22:957–962. doi: 10.1002/eji.1830220412. [DOI] [PubMed] [Google Scholar]
- 30.Cseh K, Beutler B. J Biol Chem. 1989;264:16256–16260. [PubMed] [Google Scholar]
- 31.Steinshamn S, Bemelmans M H, van Tits L J, Bergh K, Buurman W A, Waage A. J Immunol. 1996;157:2155–2159. [PubMed] [Google Scholar]
- 32.Flynn J L, Goldstein M M, Chan J, Triebold K J, Pfeffer K, Lowenstein C J, Schreiber R, Mak T W, Bloom B R. Immunity. 1995;2:561–572. doi: 10.1016/1074-7613(95)90001-2. [DOI] [PubMed] [Google Scholar]
- 33.Fisher C J J, Jr, Agosti J M, Opal S M, Lowry S F, Balk R A, Sadoff J C, Abraham E, Schein R M H, Benjamin E. N Engl J Med. 1996;334:1697–1702. doi: 10.1056/NEJM199606273342603. [DOI] [PubMed] [Google Scholar]
- 34.Jacobsen S E, Ruscetti F W, Dubois C M, Keller J R. J Exp Med. 1992;175:1759–1772. doi: 10.1084/jem.175.6.1759. [DOI] [PMC free article] [PubMed] [Google Scholar]
- 35.Kindler V, Sappino A-P, Grau G E, Piguet P-F, Vassalli P. Cell. 1989;56:731–740. doi: 10.1016/0092-8674(89)90676-4. [DOI] [PubMed] [Google Scholar]
- 36.Amiri P, Locksley R M, Parslow T G, Sadick M, Rector E, Ritter D, McKerrow J H. Nature (London) 1992;358:604–607. doi: 10.1038/356604a0. [DOI] [PubMed] [Google Scholar]
- 37.Bruce A J, Boling W, Kindy M S, Peschon J, Kraemer P J, Carpenter M K, Holtsberg F W, Mattson M P. Nat Med. 1996;2:788–794. doi: 10.1038/nm0796-788. [DOI] [PubMed] [Google Scholar]
- 38.Vieira L Q, Goldschmidt M, Nashleanas M, Pfeffer K, Mak T, Scott P. J Immunol. 1996;157:827–835. [PubMed] [Google Scholar]
- 39.Kondo S, Wang B, Fujisawa H, Shivji G M, Echtenacher B, Mak T W, Sauder D N. J Immunol. 1995;155:3801–3805. [PubMed] [Google Scholar]
- 40.Zhou T, Edwards C K, Yang P, Wang Z, Bluethmann H, Mountz J D. J Immunol. 1996;156:2661–2265. [PubMed] [Google Scholar]


