Abstract
Gene expression from plasmids containing the araBAD promoter can be regulated by the concentration of arabinose in the growth medium. Guzman et al. [Guzman, L.-M., Belin, D., Carson, M. J. & Beckwith, J. (1995) J. Bacteriol. 177, 4121–4130] showed that expression of a cloned gene could be modulated over several orders of magnitude in cultures grown in the presence of subsaturating concentrations of arabinose. We constructed plasmids expressing a fast-folding mutant Aequorea victoria green fluorescent protein from the araBAD promoter to examine the distribution of expressed gene products in individual cells at intermediate induction levels. Microscopic examination of cells grown at low arabinose concentrations shows mixtures of brightly fluorescent and dark cells, suggesting that intermediate expression levels in cultures reflect a population average of induced and uninduced cells. The kinetics of green fluorescent protein induction suggest that this reflects an “autocatalytic” induction mechanism due to accumulation of the inducer by active transport. This mechanism, which is analogous to the induction of the lac operon at subsaturating inducer concentrations in lacY+ cells, was described 40 years ago by Novick and Weiner [Novick, A. & Weiner, M. (1957) Proc. Natl. Acad. Sci. USA 43, 553–566].
Keywords: enzyme induction, green fluorescent protein, arabinose
The ability to express a cloned gene under controlled conditions is often very useful. In Escherichia coli, plasmid-based inducible promoter systems have been implemented using bacterial, phage, and chimeric promoters. These systems have been generally designed to respond to an external inducer by expressing high levels of the gene product(s) of interest, often for the purpose of obtaining material for purification. Plasmid systems also have been designed to have low basal levels of expression to minimize the effects of exposing cells to toxic gene products during growth.
Plasmid systems based on the lac promoter are notoriously leaky; repression is often incomplete due to a combination of plasmid copy number effects and the absence of secondary operators required for the full range of gene control in the natural lac operon (1). Background expression levels should be lower in systems based on positive rather than negative control. Recently, expression plasmids based on the araBAD promoter (ParaBAD) have been constructed by Guzman et al. (2). Because the ara system can be induced by arabinose and is repressed by both catabolite repression in the presence of glucose or by competitive binding of the anti-inducer fucose, these plasmids have very low background levels of expression. In addition, gene expression can be turned on and off rapidly by changing the sugars in the medium.
In addition to providing material for biochemical studies, the ability to conditionally control the expression of specific genes is useful for understanding how the presence or absence of the genes of interest affects the physiology of E. coli. Conditional expression also allows for selections and screens for mutations in other genes. For example, cells that express an essential gene under control of the araBAD promoter can be grown in the presence of arabinose, and then plated for growth on glucose to select for mutations that bypass the requirement for that function (2). Similarly, mutants that affect the toxicity of an expressed gene product could be isolated by selecting for growth in the presence of the inducer.
For physiological and genetic studies, the very high levels of protein expressed by most inducible systems are often inappropriate. Ideally, one would like to be able to modulate gene expression over a range of levels. Guzman et al. (2) presented evidence that the pBAD vectors are also suitable for this purpose. Using alkaline phosphatase as a reporter, they showed that the levels of alkaline phosphatase in cultures grown in different concentrations of arabinose could be varied over an approximately 300-fold range. Moreover, expression could be set at intermediate levels by using inducer concentrations between 1.33 μM and 133 μM.
In this report we address the nature of the intermediate expression levels observed at subsaturating induction of the araBAD promoter. Intermediate levels of gene expression in cultures do not always mean that gene expression is uniform with respect to individual cells. In the extreme cases, either every cell in the culture makes the same percentage of the fully induced level as is seen for the culture as a whole, or the culture consists of a mixture of fully induced and completely uninduced cells. In the latter case, the intermediate expression levels observed in the culture reflect the proportion of cells that are fully induced, rather than intermediate expression in any individual cell.
Determining where the actual situation lies between these extremes requires measuring gene expression in individual cells. In this report, we describe experiments using Aequorea victoria green fluorescent protein (GFP) as a reporter in both bulk cultures and individual cells. We find that GFP expression in cultures grown at low concentrations of arabinose is bimodal, consistent with an autocatalytic mechanism for induction of transcription of ParaBAD due to active uptake of the inducer. This phenomenon is analogous to the autocatalytic induction of the lac operon described by Novick and Weiner 40 years ago (3).
MATERIALS AND METHODS
Bacterial Strains and Plasmids.
All of the experiments described here were done in E. coli strain MC1061 (4), which is able to transport arabinose, but is unable to metabolize it. pDS439, which expresses GFPmut2 from the araBAD promoter, was constructed by cloning a XbaI–HindIII fragment encoding GFPmut2 (5) into pBAD18 (2), also digested with XbaI and HindIII. In this report, we will refer to this mutant form of GFP, which has better fluorescence properties than the wild-type protein, simply as GFP.
Colonies containing pDS439 are visibly green under fluorescent light when grown on Luria–Bertani medium containing ampicillin and 0.2% arabinose and are bright green under illumination by a hand-held UV lamp. High-level expression of GFP seems to be toxic to E. coli; cells plated on Luria–Bertani medium with 0.2% arabinose in the absence of ampicillin form colonies with a variable number of dark and fluorescent sectors. In the absence of arabinose, or in the presence of glucose, the cells are uniformly dark under UV illumination.
Growth Conditions.
Single colonies were used to inoculate overnight cultures in M63 minimal medium (6) supplemented with 0.5% glycerol, 2 μg/ml thiamine, 40 μg/ml each of Ala, Arg, Glu, Gly, His, Ile, Leu, Lys, Met, Pro, Ser, Thr, and Val, and 150 μg/ml ampicillin. Fresh overnight cultures were diluted to OD600 ≈ 0.02 into the same medium and grown at 37°C in a shaking water bath to OD600 = 0.1 to 0.2 at which time arabinose was added to the concentration indicated. Growth was continued with shaking. To determine the fraction of the cells in a culture that could induce GFP synthesis, arabinose was added to 6.6 mM (0.1%) and after an additional 2 hr of growth, cells were examined by fluorescence microscopy.
Fluorescence Measurements.
At various times after the addition of arabinose, aliquots were removed, chloramphenicol was added to 20 μg/ml to halt synthesis of GFP, and the cells were pelleted and resuspended in M63 salts with 20 μg/ml chloramphenicol. To minimize background scattering and inner filter effects, the OD600 of the suspension was adjusted to be ≤ 0.3 in a volume of ≥3 ml. The 3-ml samples were transferred to a 1-cm × 1-cm quartz cuvette, and fluorescence was measured in an SLM–Aminco (Urbana, Il) 8000 fluorescence spectrophotometer.
Microscopy and Image Quantitation.
Five-microliter samples were spotted onto glass slides and examined with an Olympus BX50 microscope using a UPlan Fl 100X/1.3 oil immersion objective. Cells were viewed using both Nomarski differential interference contrast (DIC) optics and epifluorescent illumination. For detection of GFP fluorescence, a DM500 dichroic mirror/BP470–490 exciter filter/BA515 barrier filter set was used.
To quantitate the fluorescence of individual cells, several fields of cells from each sample were photographed using Nomarski (DIC) optics and epifluorescent illumination. When epifluorescent illumination was used, multiple exposures were taken of each field to assure that the fluorescence signal was within the linear range of the film and the scanner. Photomicrographs were taken with Kodak Ektachrome 100 film. Slides were scanned in a Nikon LS-1000 film scanner, and the fluorescence was quantified using Fujix MacBAS software. For each cell, an area was defined that bounded the cell image. The intensity in an area of the same shape and size over a part of the image with no cells was used as a background subtraction. The corrected intensity then was normalized to the area of the cell image to correct for differences in cell size.
RESULTS
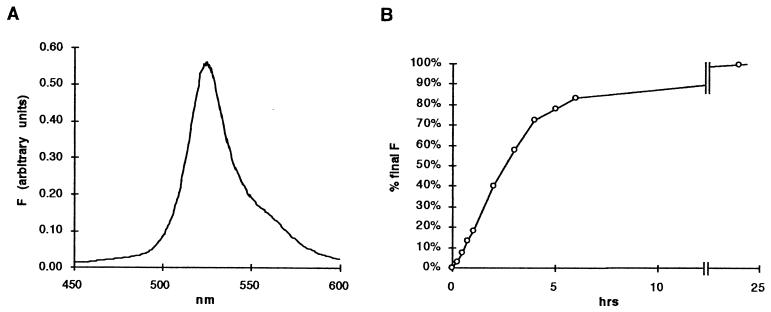
We first determined whether the average fluorescence in a culture could be measured quantitatively in whole cells. Fig. 1A shows an emission spectrum for a suspension of cells excited at 420 nm. Intact E. coli expressing GFP gave an emission peak with a maximum around 520 nm. The shape of the peak is comparable to the published spectrum for this protein in cell lysates (5), and the signal due to fluorescence and scattering of cells that do not express GFP is negligible at this wavelength.
Figure 1.
GFP fluorescence measured in cell suspensions. Cultures were grown and samples were prepared as described in Materials and Methods. (A) Emission spectrum for cells containing pDS439 (ParaBAD-GFPmut2) after growth for 6 hr in the presence of 1.33 mM arabinose. The excitation wavelength used was 420 nm. Fluorescence is expressed in arbitrary units. (B) Induction kinetics after addition of arabinose to 1.33 mM.
Fig. 1B shows the kinetics for induction of GFP after the addition of arabinose to 1.33 mM. Fluorescence above background in the culture suspensions could be detected within 15 min, and the fluorescence/OD600 increased for about 5 hr. Growth of the cultures continued after induction, but the growth rate decreased as the GFP levels increased.
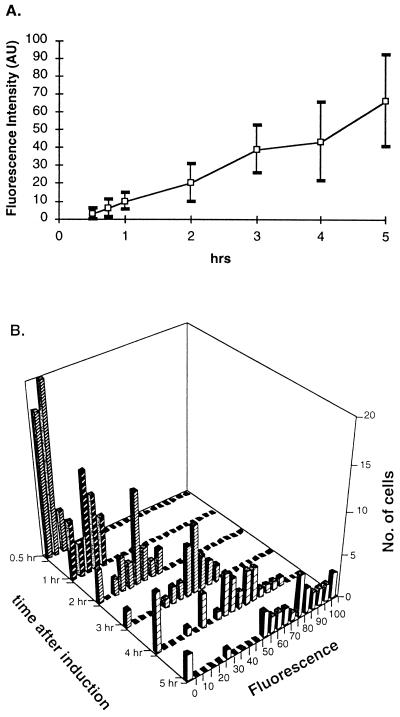
Expression after induction by 1.33 mM arabinose also was examined in individual cells by fluorescence microscopy. The kinetics of induction measured as the average fluorescence intensity per time point are shown in Fig. 2A. Detectably bright cells appeared within 15 min after adding inducer, and the mean intensity of fluorescence increased with time. Fig. 2B shows histograms of the distribution of fluorescence intensities of cells at various times after the addition of arabinose. By 30 min after the addition of arabinose, the majority of the cells are faintly fluorescent. The distribution of fluorescence intensities is narrow early after induction and becomes broader with time. However, even at 5 hr after the addition of arabinose, the majority of the cells are distributed in a single population around the average intensity of the culture. A few cells remain dark; these probably have lost the GFP plasmid.
Figure 2.
Induction kinetics in individual cells after addition of arabinose to 1.33 mM. Cultures were grown and samples were prepared as described in Materials and Methods. The fraction of measurably fluorescent cells at each time point was determined by comparing the number of cells visible in scanned fluorescence photomicrographs to the number visible in Nomarski photomicrographs; for each time point 100 to 200 total cells were examined. The fluorescence intensities of 25 to 30 individual bright cells were quantitated as described in Materials and Methods using only well separated cells. Because not every cell in any field was quantitated, the number of dark cells at each time point was calculated (using the fraction of measurably bright cells) as the expected number of cells that would be too faint to be detected by scanning in a population with the observed number of bright cells. Dark cells, which include both completely dark cells and cells that were visibly fluorescent, but too faint to detect by scanning, were assigned an intensity of zero. (A) The average fluorescence intensity at different times after induction. The average fluorescence includes both bright cells and a calculated number of dark cells determined as described above. Error bars indicate one SD above and below the average values at each time point. (B) Histogram showing the distribution of fluorescence intensities for individual cells at each time point.
These data also show that we could reliably detect low levels of GFP in the cell. After 1 hr of induction, when the amount of GFP in the culture is only 18% of the fully induced level, 80% of the cells made enough GFP to give a quantifiable fluorescence signal by scanning the micrographs.
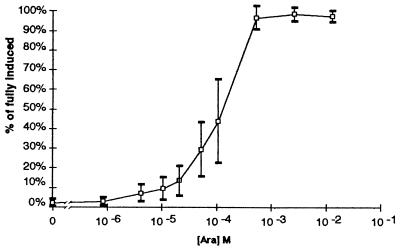
To determine how the observed fluorescence correlates with the amount of inducer added to a culture, we measured fluorescence of suspensions of cells grown with different concentrations of arabinose. As was observed for induction of alkaline phosphatase in the original description of pBAD18, lower concentrations of arabinose led to lower steady-state levels of GFP in the cultures (Fig. 3). Intermediate values for the fluorescence of the bulk cultures were observed at concentrations of arabinose between 20 and 500 μM. At arabinose concentrations below 20 μM, the fluorescence intensity was too low to be reliably differentiated from background scattering.
Figure 3.
Dependence of GFP levels on inducer concentration. Cultures were grown in the presence of the indicated concentrations of arabinose for 5 hr as described in Materials and Methods. Fluorescence was measured on suspensions of intact cells as in Fig. 1. Data shown are the average values for three independent experiments. Error bars indicate one SD above and below the average values at each inducer concentration.
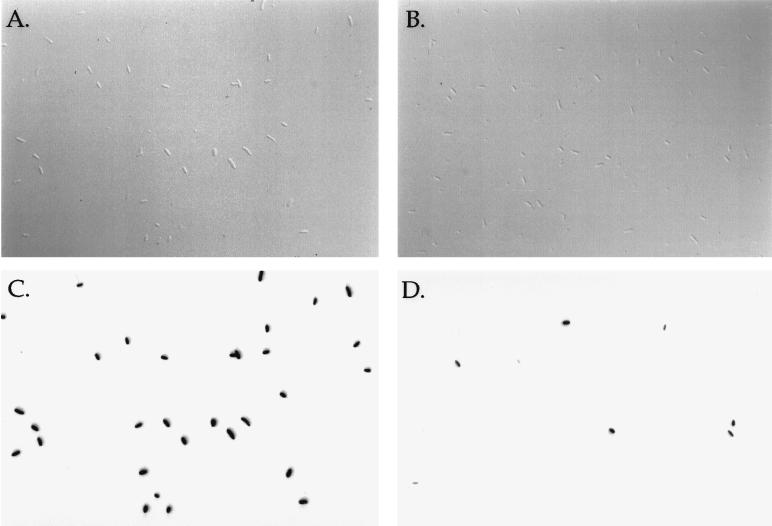
At the level of individual cells, however, the fluorescence intensities varied over a broad range within populations grown at subsaturating arabinose concentrations. At the lowest concentrations of arabinose, a few very bright cells are found among many dark cells. Fig. 4 shows scanned images of Nomarski and fluorescence micrographs of cells grown in 2.66 mM or 106 μM arabinose. The vast majority of cells in the high arabinose culture are very bright. The 21% of the cells that are dark in this experiment probably have lost the plasmid. At the lower arabinose concentration, a minority of the cells are extremely bright, while the intensities of the remaining cells range from moderately bright to undetectable. After addition of arabinose to 6.6 mM, 89% of the cells became bright, indicating that the vast majority of cells in the low arabinose culture still retained the plasmid. Note that the average fluorescence intensity of this culture is well within the range that can be reliably measured by microscopy based on the data in Fig. 2.
Figure 4.
Photomicrographs of cells grown in different arabinose concentrations for 5 hr. (A) Sample from high arabinose culture (2.66 mM arabinose) visualized with Nomarski optics. (B) Sample from low arabinose culture (106 μM arabinose) visualized with Nomarski optics. (C) Sample from high arabinose culture (2.66 mM arabinose) visualized with epifluorescent illumination. (D) Sample from low arabinose culture (106 μM arabinose) visualized with epifluorescent illumination. In the high arabinose culture, 79% of the cells were bright. In the low arabinose sample shown, 89% of the cells became bright after addition of arabinose to 6.6 mM (0.1%).
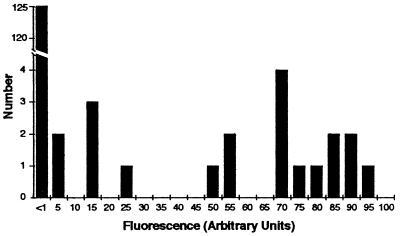
Fig. 5 shows a histogram of the fluorescence intensities of individual cells grown in 106 μM arabinose for 5 hr. The distribution of fluorescence intensities clearly falls into two peaks, with a majority of the cells giving low to undetectable fluorescence. Thus, at subsaturating inducer concentrations, intermediate levels of gene expression from ParaBAD represent a population average of the expression levels from cells that are individually very different.
Figure 5.
Histogram of the fluorescence intensities of cells in the low arabinose (106 μM) culture. Fluorescence intensities of 145 cells were quantitated based on scanned photomicrographs as described in Materials and Methods and are expressed in arbitrary units. Due to day-to-day fluctuations in lamp intensity, the units in this figure cannot be directly compared with the values shown in Fig. 2.
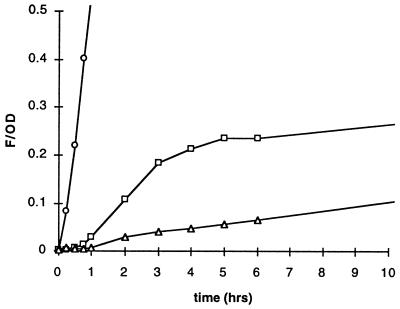
To examine the kinetics of GFP induction at different arabinose concentrations, we measured fluorescence of cultures at different times after the addition of saturating and subsaturating concentrations of arabinose. Fig. 6 shows the kinetics of GFP induction at three different arabinose concentrations. At 13.3 mM arabinose, synthesis of GFP is rapidly induced in the entire culture. At the lower concentrations, however, there is a noticeable lag, and the induction curves have a sigmoid shape.
Figure 6.
Kinetics of induction at different arabinose concentrations. GFP fluorescence was measured at the indicated times after addition of arabinose to 1.3 mM (○), 10 μM (□), and 1 μM (▵). Fluorescence was measured for intact cell suspensions as in Fig. 1.
DISCUSSION
Our experiments with the ParaBAD-GFP expression plasmid indicate that intermediate levels of gene expression observed by Guzman et al. (2) reflect population averages of nonuniform mixtures of cells. This kind of nonuniform induction behavior was demonstrated 40 years ago for the lac operon by the classical experiments of Novick and Weiner (3) and was confirmed microscopically by Maloney and Rotman (7), who assayed β-galactosidase in individual cells. Novick and Weiner (3) demonstrated that induction of the lac operon at low concentrations of inducer involves an autocatalytic positive feedback loop. Wild-type cultures contain a dynamic mixture of cells with different levels of galactoside permease. In the absence of inducer, random, spontaneous induction events lead to a burst of synthesis of LacY, but after repression is re-established the levels decline as the protein is diluted out by growth. When a low concentration of inducer is present, the fraction of cells that contain enough permease to concentrate the inducer derepress the synthesis of permease. As permease accumulates, that individual cell and its offspring become stably derepressed, as the amount of permease is now well above that needed to concentrate the inducer.
Our results can be explained by a regulatory feedback loop similar to that observed for the lac system by Novick and Weiner (3). Induction of the ara regulon requires binding of the inducer, arabinose, to AraC, the activator of the arabinose regulon. However, synthesis of both the high-affinity transporter encoded by araFGH and the low-affinity uptake system encoded by araE is induced by arabinose through the transcriptional activator AraC (reviewed in ref. 8). If synthesis of the transporters is induced, active transport will lead to accumulation of the inducer, which will, in turn, stimulate expression of the uptake systems.
Presumably, background levels of ara expression, like those of the lac operon, reflect stochastic processes that allow the occasional transcription of one of the promoters of the ara regulon. At any given moment, some fraction of the cells will have recently expressed a burst of ara uptake proteins. The concentration of the transporters will decrease in those cells as the proteins are diluted by cell division and/or turnover. If there is arabinose in the culture, the probability that any individual cell will accumulate inducing levels of arabinose before losing its transporters will depend on the concentration of arabinose. Thus, the fraction of cells that achieve induction will vary, but those cells that are induced will contain high concentrations of the inducer.
Novick and Weiner (3) also pointed out that this kind of feedback induction mechanism gives a characteristic sigmoidal kinetic response to addition of inducer, which we also observe. At saturating concentrations of inducer, the synthesis of operon proteins is immediately induced to a new steady-state rate. At lower concentrations of inducer, however, the synthesis of operon proteins increases exponentially as more and more cells are recruited into the fraction of the population that is fully induced.
After the lag in induction at low arabinose concentrations, the level of GFP approaches a plateau that is substantially lower than the fully induced level. If cells that spontaneously reach a threshold concentration of uptake proteins become fully induced, then over a long enough time all of the cells should become induced. However, in the lac system, Novick and Weiner showed that uninduced cells had a growth advantage over induced cells. Thus, the rate at which uninduced cells outreplicate induced cells eventually balances the rate of induction. In addition to the physiological load of synthesizing high levels of GFP, which does not benefit E. coli, the toxicity of high levels of GFP also should contribute to this effect.
Whereas the pBAD vectors have the advantages of rapid regulation and low basal levels compared with plasmids based on regulation by lac repressor, our results suggest that growth in varying concentrations of arabinose is not well suited to modulate the expression of cloned genes. Expression from the lac promoter can be modulated using different concentrations of the membrane-permeable inducer isopropyl β-d-thiogalactoside in a lacY− strain, where in the absence of an inducible transport system the level of expression in individual cells in the population is relatively homogeneous (7, 9). Plasmids with promoters controlled by lac repressor have been used to modulate expression of genes over a 20- to 250-fold range (10, 11). The importance of performing such experiments in a permeaseless strains should be emphasized.
ara-based vectors may yet prove amenable to other approaches. More homogeneous populations of cells with intermediate expression from ParaBAD should be produced if intracellular inducer can be prevented from increasing its own uptake by turning on genes involved in transport. For example, it may be possible to synthesize a membrane-permeable, gratuitous inducer for AraC that could be used to modulate ara expression in transport-deficient mutants. Alternatively, this might be accomplished by constitutive expression of one or both of the arabinose uptake systems.
Acknowledgments
This manuscript is dedicated to Aaron Novick on the occasion of the 40th anniversary of the publication of the Proceedings of the National Academy of Sciences paper describing autocatalytic induction of the lac operon. We thank David Giedroc for the use of the SLM fluorimeter, Jim Carrington for the use of the Olympus BX50 microscope, Luz-Maria Guzman for pBAD18, Bill Margolin for the GFPmut2 plasmid, Mike Plamann for the use of the Nikon LS-1000 film scanner, and Vince Cassone, Larry Griffing, and Bill Margolin for helpful discussions. This work was supported by National Science Foundation Grant MCB-9305403 to J.C.H. and National Institutes of Health James A. Shannon Director’s Award GM49770 to D.A.S.
ABBREVIATION
- GFP
green fluorescent protein
References
- 1.Oehler S, Eismann E R, Krämer H, Müller-Hill B. EMBO J. 1990;9:973–979. doi: 10.1002/j.1460-2075.1990.tb08199.x. [DOI] [PMC free article] [PubMed] [Google Scholar]
- 2.Guzman L-M, Belin D, Carson M J, Beckwith J. J Bacteriol. 1995;177:4121–4130. doi: 10.1128/jb.177.14.4121-4130.1995. [DOI] [PMC free article] [PubMed] [Google Scholar]
- 3.Novick A, Weiner M. Proc Natl Acad Sci USA. 1957;43:553–566. doi: 10.1073/pnas.43.7.553. [DOI] [PMC free article] [PubMed] [Google Scholar]
- 4.Casadaban M J, Cohen S N. J Mol Biol. 1980;138:179–207. doi: 10.1016/0022-2836(80)90283-1. [DOI] [PubMed] [Google Scholar]
- 5.Cormack B P, Valdivia R H, Falkow S. Gene. 1996;173:33–38. doi: 10.1016/0378-1119(95)00685-0. [DOI] [PubMed] [Google Scholar]
- 6.Miller J H. Experiments in Molecular Genetics. Plainview, NY: Cold Spring Harbor Lab. Press; 1972. [Google Scholar]
- 7.Maloney P C, Rotman B. J Mol Biol. 1973;73:77–91. doi: 10.1016/0022-2836(73)90160-5. [DOI] [PubMed] [Google Scholar]
- 8.Schleif R. In: Escherichia coli and Salmonella typhimurium: Cellular and Molecular Biology. Neidhardt F C, Curtiss R III, Ingraham J L, Lin E C C, Low K B, Magasanik B, Reznikoff W S, Riley M, Schaechter M, Umbarger H E, editors. Washington, DC: Am. Soc. Microbiol.; 1996. pp. 1300–1309. [Google Scholar]
- 9.Herzenberg L A. Biochim Biophys Acta. 1959;31:525–538. doi: 10.1016/0006-3002(59)90029-0. [DOI] [PubMed] [Google Scholar]
- 10.Maurer R, Meyer B J, Ptashne M. J Mol Biol. 1980;139:147–161. doi: 10.1016/0022-2836(80)90302-2. [DOI] [PubMed] [Google Scholar]
- 11.Cole J R, Olsson C L, Hershey J W B, Grunberg-Manago M, Nomura M. J Mol Biol. 1987;198:383–392. doi: 10.1016/0022-2836(87)90288-9. [DOI] [PubMed] [Google Scholar]


