

Abstract
Adriamycin is a popular antineoplastic agent whose ability to form covalent adducts with DNA has been correlated to cellular apoptosis (programmed cell death) in tumor models. We have isolated and purified this adduct formed under oxido-reductive (Fenton) conditions in Tris buffer. We show by homo- and heteronuclear NMR spectroscopy that the covalent Adriamycin-DNA adduct is structurally equivalent to that resulting from direct reaction with formaldehyde. Covalent linkage of the drug to one of the DNA strands confers remarkable stability to the duplex, indicated by a 162-fold reduction in the rate of strand displacement compared with the complex with noncovalently bound drug. Glyceraldehyde also engenders covalent Adriamycin-DNA complexes, providing a possible relevant biological context for in vivo adduct formation.
Of the approximately 50 drugs used in chemotherapy regimens, doxorubicin (tradename, Adriamycin) has found one of the widest applications because of its activity against a broad range of malignancies (1). Despite a large body of evidence that Adriamycin acts dominantly at the DNA level through intercalation, the lack of any detailed understanding of the mechanism of Adriamycin activity in vivo has hampered years of effort aimed at producing more active derivatives of this drug with reduced side effects.
Some years ago, in vitro transcription analysis indicated that Adriamycin can form covalent adducts with DNA (2). These occurred almost exclusively at GpC sequences and were found to behave much as classical interstrand DNA cross–links in their ability to block RNA polymerase (3, 4). It has since been shown that adduct formation has an absolute requirement for the 2-NH2 of guanine (5). X-ray analysis has indicated that this group participates in one side of a formaldehyde (CH2O)-mediated aminal bridge, of which the other side is the 3′-NH2 of the Adriamycin sugar (6, 7). The importance of the 3′-NH2 has also been demonstrated in solution studies using modified Adriamycin derivatives lacking this moiety (8). Mass spectroscopy (MS) studies have strongly suggested that the CH2O-mediated adduct is in fact the same species as seen by transcriptional analysis under Fenton-like conditions in the presence of Tris buffer (9, 10). Furthermore, Adriamycin appears to be covalently linked to only one strand of the DNA (c-strand) in the manner described above and stabilizes the duplex via uncommonly strong noncovalent interactions to the opposite strand (n-strand) (Fig. 1). The ability of Adriamycin to form adducts of this nature with DNA correlates strongly to its cytotoxicity in certain cell lines, suggesting that the therapeutic activity of this drug may derive from an ability to initiate such covalent complexes with DNA in patients (11, 12).
Figure 1.

Structure of Adriamycin showing its covalent and noncovalent bonding array to, respectively, the c-strand and the n-strand of DNA. Rings B–D are intercalated into duplex DNA from the minor groove, and drug-DNA association, whether covalent or noncovalent, is mediated through guanine N2 amino groups on either strand. The covalent methylene linkage between Adriamycin-N3′ and c-strand guanine N2 derives from formaldehyde.
Until now, the extreme temperature and pH lability of the covalent Adriamycin-DNA complex has restricted studies of these adducts to kinetic measurements of formation and decay and analytical-scale MS of reaction product distribution under various reaction conditions (9, 10, 13). Although these efforts have yielded valuable information, this instability has prevented any experimental approach requiring the long-term persistence of these adducts in solution. We have found that by carefully monitoring temperature, the problem of adduct instability can be circumvented; purified single-lesion adducts show less than 1% degradation after 4 months of storage at 4–7°C.
MATERIALS AND METHODS
Materials.
All DNA sequences used in experiments were machine-synthesized by standard phosphoroamidite chemistry. Phosphate buffers and NaCl were purchased from Mallinkrodt. Tris base, urea, acrylamide, and N,N′-methylenebisacrylamide were purchased from American Bioanalytical. EDTA and CH2O (37% solution) were purchased from J. T. Baker. Adriamycin-HCl was purchased from Sigma and was suspended in water for use without further purification. Centricon (2-ml capacity) and Centriprep (15-ml capacity) centrifugal concentrators were purchased from Amicon. Filters (0.2-μm pore size) were purchased from Millipore. Dialysis membrane (molecular weight cutoff = 1,000) was purchased from Spectrum. The 100% and 99% 2H2O for NMR were purchased from Aldrich Chemicals. Isotopically labeled 13CH2O and C2H2O were purchased from Cambridge Isotopes Laboratories (Cambridge, MA). NMR tubes were purchased from Shigemi (Tokyo). Radiolabel ([γ-32P]rATP) was purchased from NEN, and T4 polynucleotide kinase was purchased from New England Biolabs. All water used in gels, reactions, and dialysis was double-distilled.
Buffers and Gels.
Buffer A was 20 mM sodium phosphate (pH 7.0), 150 mM NaCl, and 0.5 mM EDTA. Buffer B was 10 mM Tris⋅HCl (pH 7.5) and 1 mM EDTA. Buffer C was 50 mM Tris Borate (pH 7.5) and 1 mM EDTA. Gel type A was 20% (59:1 acrylamide/N,N′-methylenebisacrylamide) polyacrylamide containing 80 mM Tris Borate (pH 7.5) and 1 mM EDTA. Gel type B was 20% (29:1 acrylamide/N,N′-methylenebisacrylamide) polyacrylamide containing 8 M urea, 80 mM Tris borate (pH 7.5), and 1 mM EDTA.
DNA Purification.
After 1-μmol-scale syntheses, the crude DNA reaction products were purified on gel type B (20 × 40 cm) at 1.25 W/cm by electrophoresis. The desired band was visualized by UV shadowing, excised from the gel, and eluted into 100 ml of water overnight at ambient temperature. This solution was filtered to remove particulate acrylamide before loading onto a PerSeptive Biosystems HQ-20 anion-exchange HPLC column. After elution with 1 M NaCl, the approximately 4-ml samples were dialyzed overnight against two changes of 4 liters of double-distilled H2O and were subsequently dried in a Speed-Vac. Purified DNA pellets were resuspended in 0.2–0.5 ml of buffer A.
Spectrophotometric Quantitation of Adriamycin and DNA.
A molar extinction coefficient of 11,500 M−1⋅cm−1 at 480 nm was used for free Adriamycin; for covalently bound Adriamycin, the molar extinction coefficient used was 7,677 M−1⋅cm−1 at 506 nm. The molar extinction coefficient used for the self-complementary hexamer d(ATGCAT)2 in the NMR experiments was 120,800 M(dup)−1⋅cm−1 at 260 nm. For the non-self-complementary DNA in the strand-exchange reactions, the following extinction coefficients were used: ɛ260 = 138,300 M−1⋅cm−1 for 5′-ATTTATGCTTATTA-3′ and ɛ260 = 152,500 M−1⋅cm−1 for 5′-TAATAAGCATAAAT-3′.
Formation of Covalent Adriamycin-DNA Adducts.
Formation with Tris/DTT/Fe(III). Multiple 15-ml reactions were run in parallel. Each contained 4.2 μM d(ATGCAT)2, 10 μM Adriamycin, 75 μM FeCl3, 7 mM DTT, and 40 mM Tris⋅HCl (pH 7.0). Reactions were run at 10°C for 1 week, the time determined for nearly 100% conversion of all DNA to covalent species.
Formation with CH2O. Multiple 0.5-ml reactions were run in parallel. Each contained 125 μM d(ATGCAT)2, 125 μM Adriamycin, and 0.37% CH2O in buffer A. Reactions were run at 10°C for 4 h, the time determined for nearly 100% conversion of all DNA to covalent species.
Formation with 13CH2O. 13C-labeled Adriamycin-DNA adducts were formed as described above for CH2O except that 13CH2O was used in place of CH2O.
Formation with CD2O. Adriamycin-DNA adducts containing a deuterated methylene bridge were formed as described above for CH2O except that C2H2O was used in place of CH2O, and the reactions were carried out in 99% 2H2O instead of in H2O.
Formation with Glyceraldehyde. The glyceraldehyde-mediated adduct was formed under identical conditions, except that CH2O was replaced by glyceraldehyde, and only one reaction was run for analytical purposes.
NMR Sample Preparation.
After the reaction, volumes were pooled into centrifugal concentrators, concentrated to approximately 0.2 ml at 4°C, and loaded onto gel type B that had been precooled to 4°C. Electrophoretic separation of Adriamycin-DNA adduct away from unreacted DNA followed overnight at 4°C and 2 W, after which the adduct was clearly visible to the naked eye as a pink band on the gel. Rapid electroelution of the adduct into buffer C at 4°C using barriers fashioned from dialysis membrane (molecular weight cutoff, 1,000) yielded pure adduct. This was again centrifugally concentrated at 4°C to approximately 0.2 ml, dialyzed into buffer A at 4°C, lyophilized, and resuspended in 0.2 ml 100% 2H2O.
NMR Spectroscopy.
One- and two-dimensional NMR experiments were performed on a Varian Unity model 500 MHz spectrometer at 10°C on a triple resonance (H, C, N) probe. A standard two-dimensional nuclear Overhauser effect spectroscopy (NOESY) pulse sequence provided by Varian was used for all homonuclear experiments. A sweep width of 4,000 Hz with 1,024 complex data points was used for all 1H spectra. For each of 300 t1 increments, 16 transients were acquired, each with a recycle delay of 7 s. The mixing time was 0.25 s. After acquisition, data were transferred to a Silicon Graphics INDY Workstation and processed with the software package felix95 (Biosym Technologies, San Diego, CA). In general, processing entailed deconvolution of the H2HO signal, apodization with a sine-bell squared function and zero filling to 1,024 data points before Fourier transformation. The heteronuclear 1H–13C heteronuclear single quantum correlation (HSQC) experiment was performed by using a standard HSQC pulse sequence provided by Varian. The sweep widths for the proton and carbon dimensions were, respectively, 4,000 Hz and 10,000 Hz. Decoupler offset frequency was set to −5,000 Hz, the final spectrum was centered at 40 ppm, and 160 Hz was used as the one-bond 1H–13C coupling constant in the experiment. Analysis was as above for the homonuclear experiments.
Strand-Exchange Experiments.
All strand-exchange experiments were performed in buffer A, maintained at 15°C in a temperature bath. The 14-mer duplex d(ATTTATGCTTATTA)⋅d(TAATAAGCATAAAT) was preannealed at 1:1 stoichiometry by heating to 100°C and slow cooling to 10°C in buffer A before use in the exchange reactions. The exchange reactions for unintercalated and reversibly bound DNA contained 30 μM preannealed duplex and 30 μM single-stranded d(TAATAAGCATAAAT) and were supplemented with a trace amount of 5′-labeled 32P-d(TAATAAGCATAAAT). The incubations for covalent adducts contained 30 μM purified virtual cross-link (vxl) duplex and 30 μM d(TAATAAGCATAAAT) supplemented as above with radiolabeled tracer strand. Aliquots were removed from the incubations at various times and frozen until resolution on gel type A (for incubations with noncovalent Adriamycin-DNA complexes and incubations with DNA alone) or on gel type B (for incubations containing purified adduct) at 10°C.
Quantitation and Analysis of Strand-Exchange Products.
After gel resolution, gels were covered with Saran Wrap and allowed to expose a Fuji BasIII imaging plate. After imaging on a Fuji PhosphorImager, data were analyzed by using macbas software (Version 1.01). Values for the fractional amount of exchange at time t were calculated as the baseline corrected ratios of quantitated double- to single-stranded band intensities (Ids/Iss) on the gels. Strand-exchange rates were then calculated as d(Ids/Iss)/dt. For the reversibly bound duplex at 30 μM, strand-exchange rates at 0, 10, 20 and 40 μM Adriamycin were calculated and replotted as d(Ids/Iss)/dt vs. Adriamycin/duplex, allowing interpolation to the strand-exchange rate at one Adriamycin/duplex (stoichiometrically comparable to the covalent adduct). This then served as a comparison to free and covalently bound DNA species.
RESULTS AND DISCUSSION
Comparison of Tris/Fe(III)/DTT- and CH2O-Mediated NMR Spectra. Our ability to produce and purify large amounts of stable covalent Adriamycin-DNA adduct in solution has allowed a more direct structural comparison of these adducts than previously possible by MS.
CH2O-and Tris/Fe(III)/DTT-mediated Adriamycin-DNA adducts were formed on the self-complementary hexanucleotide d(ATGCAT)2, containing only a single potential site for adduct formation. Isolation and purification of the respective adduct and analysis by high-field 1H NMR indicated that the CH2O- and Tris/Fe(III)/DTT-mediated Adriamycin-DNA adducts are structurally identical (Fig. 2a). These direct structural data show unambiguously that adduct formation under Fenton conditions with Tris buffer proceeds via CH2O, itself a product of the radical disproportionation of Tris (14). Furthermore, the retention of Adriamycin carbohydrate resonances in the adduct spectrum dispels the notion that Adriamycin-DNA adduct formation under reductive conditions must proceed via formation of an electrophilic quinone methide intermediate at Adriamycin C7 with concomitant reductive elimination of the daunosamine sugar (15).
Figure 2.

The 500-MHz 1H and HSQC NMR spectra of covalent Adriamycin-DNA adducts at 10°C. (a) Comparison of CH2O- and Tris/Fe(III)/DTT-mediated Adriamycin-DNA adducts by 1H NMR indicates that the two are structurally equivalent. (b) Portion of the carbon HSQC spectrum of 13CH2O-mediated Adriamycin-DNA. The methylene 13C has strong cross-peaks to each of its nonequivalent geminal protons, which in turn bear cross-peak arrays structurally consistent with the incorporation of CH2O into the Adriamycin-DNA adduct as shown in Fig. 1.
Incorporation of 13C -labeled CH2O.
This finding corroborates earlier MS data with direct structural evidence that CH2O is the essential species required for covalent Adriamycin-DNA adduct formation. To demonstrate that CH2O is itself incorporated into the covalent complex and to gain insight as to the locus of this incorporation, the covalent adduct was formed and isolated as described above with isotopically labeled 13CH2O. If the aminal linkage between Adriamycin and DNA were in fact to derive from CH2O, as suggested by x-ray studies, then the adduct resulting from incorporation of 13CH2O would be expected to bear the 13C at the methylene center of this linkage. The carbon HSQC spectrum of the 13CH2O-mediated Adriamycin-DNA adduct is shown in Fig. 2b with its strong J-coupled cross–peaks between the methlyene 13C and each of its (nonequivalent) geminal protons at 4.08 and 5.13 ppm. In independent two-dimensional 1H NOESY spectra, these protons show NOE cross–peaks to the following assigned drug and DNA protons: 5′-MeAdriamycin (1.35 ppm), C10H2′DNA (1.97 ppm), A11H2DNA (8.34 ppm), A11H8DNA (8.39 ppm), and C10H6DNA (7.66 ppm). Atom labels are as shown in Fig. 3 for the DNA and in Fig. 1 for Adriamycin. These through-space contacts are consistent with the x-ray model, indicating unambiguously that the aminal linkage joining Adriamycin and DNA indeed derives from CH2O. The identity of these methylene protons was further corroborated by the abolition of the above cross-peaks in the two-dimensional 1H NOESY spectrum of the adduct formed with C2H2O. The mutual cross–peak between the two methylene protons was similarly abolished in the spectrum of the C2H2O-mediated adduct.
Figure 3.

Anomeric-aromatic portion of the 500-Mhz 1H NOESY spectrum at 10°C of the Adriamycin-DNA adduct mediated by Tris/Fe(III)/DTT. The connectivity patterns between anomeric and aromatic DNA protons are correlated by color to the schematic Adriamycin-DNA adduct shown above. The c-strand is shown in blue, whereas the n-strand is depicted in black and red. The NOESY connectivity pattern between DNA protons is interrupted between the C4pA5 step of the c-strand and the T8pG9 step of the n-strand, indicating intercalation of the Adriamycin chromophore at this point and covalent attachment to G3. Connectivity along the c-strand is completed by contacts between the aromatic protons C4H6 and A5H8 to the Adriamycin-H1′ carbohydrate proton. The box representing connectivity between the protons G9H8, G9H1′, C10H6, and C10H5, shown in green, was a characteristic feature of all observed Adriamycin-DNA spectra of the type d[(AT)nGC(AT)n]2. Residual unlabeled cross-peaks represent small amounts of unreacted DNA that was coexcised from the gel with the adduct.
Spectroscopic Characteristics of the Adduct.
Fig. 3 shows the anomeric-aromatic portion of the two-dimensional 1H NOESY spectrum of the Adriamycin-DNA adduct formed on d(ATGCAT)2. From the connectivity pattern in this region, it is clear that only one reaction product is present, in which a single Adriamycin molecule is covalently bound per DNA duplex. Because the DNA oligomer is self-complementary before adduct formation, covalent Adriamycin binding to either strand generates an identical product. In this way, once either strand has become the c-strand through covalent linkage to Adriamycin (and by default the opposite strand has become the n-strand with noncovalent contacts to the drug), the dyad symmetry of the molecule is lost, and the absence of additional GpC sites precludes further adduct formation. The location of the intercalated Adriamycin chromophore and NOESY cross–peaks between Adriamycin and DNA protons is consistent with x-ray analysis, implying that the Adriamycin-DNA adduct in solution is structurally comparable to the crystal species, with Adriamycin covalently bound only to the c-strand and that the immense stabilization of the duplex against denaturation derives from the specific noncovalent interactions between Adriamycin and the opposite n-strand. Because of its extreme stability to denaturation, the term “virtual cross–link” (vxl) has been proposed to describe this monocovalent species (9, 10).
The interruption of anomeric-aromatic cross-peak connectivity between bases C4pA5 and bases T8pG9 indicates that the chromophore of Adriamycin is intercalated 3′ adjacent to the central GpC step on the c-strand and 5′ adjacent to this domain on the n-strand. To date, x-ray and MS studies have used self-complementary oligonucleotides of the type d[(GC)n]2 and d[(CG)n]2 because it was assumed that intercalation of the drug chromophore between guanine and cytosine was a prerequisite for Adriamycin-DNA adduct formation. Fig. 3 shows that Adriamycin need not intercalate between GpC or CpG to form a stable covalent adduct with DNA. Rather, Adriamycin intercalation, which occurs adjacent to such domains, seems to be the primary determinant in fostering the covalent and noncovalent interactions necessary for duplex stabilization by the drug.
Stability of Adduct via Strand-Exchange Kinetics.
With direct solution-based structural evidence establishing the importance of CH2O in the formation of the vxl, irrespective of reaction conditions, we sought to quantitatively evaluate the high duplex stabilization caused by noncovalent contacts to the n-strand. As with the NMR studies, it was also important in this experiment to be able to rely on the stability of the purified adduct in solution over time. Duplex stabilization energy was measured as a function of labeled n-strand incorporation by exchange into (i) the duplex alone, (ii) the duplex intercalated (but not covalently reacted) with Adriamycin, and (iii) the purified vxl duplex. If the Adriamycin-DNA adduct were truly monocovalent to only the c-strand, one would expect some measurable exchange of an additional n-strand into the adduct without loss of vxl character. The rate of this exchange as compared with unintercalated and intercalated duplexes of identical sequence would yield a measure of the kinetic duplex stabilization afforded by, respectively, the entire vxl complex and the noncovalent contacts to the n-strand alone.
Strand-exchange rate, and, therefore, the duplex stabilization energy, was found to vary markedly with DNA species. Experimental results for strand-exchange incubations of duplex DNA with and without a single vxl lesion are shown in Fig. 4, and the respective strand-exchange rates are summarized in Table 1.
Figure 4.

Results of kinetic strand-exchange experiments with unintercalated DNA (○), purified Adriamycin-DNA adduct (□), and DNA intercalated with 1 Adriamycin/duplex. The latter is shown as a dashed line and represents the rate estimated by interpolation from a separate series of strand-exchange experiments containing various concentrations of noncovalently bound Adriamycin. Strand-exchange rate constants are summarized in Table 1. The DNA used in the kinetic strand-exchange experiments was the 14-bp oligomer d(TAATAAGCATAAAT)⋅d(ATTTATGCTTATTA), which contains a single potential site for adduct formation.
Table 1.
Summary of strand exchange data from Fig. 4 for various species
| DNA species | k, hr−1 | Relative k |
|---|---|---|
| vxl adduct | 1.25 × 10⁻⁴ | 1 |
| One intercalated Adr/duplex | 2.02 × 10⁻²* | 161.6 |
| Unintercalated DNA | 7.97 × 10⁻² | 637.6 |
Interpolated value determined in an independent series of strand-exchange incubations containing various concentrations of reversibly bound Adriamycin.
The time-dependent incorporation of labeled n-strand into the vxl duplex without loss of vxl character is itself cogent evidence that the Adriamycin in this adduct is covalently bound to only one DNA strand rather than to each strand, as would be expected for a classical DNA cross-link. One molecule of intercalated but unreacted Adriamycin stabilizes the duplex by 3.9-fold with respect to unintercalated DNA (Fig. 4). The corresponding stabilization by one covalent Adriamycin-DNA adduct over unintercalated DNA is 637-fold. Alternatively, specific noncovalent interactions between Adriamycin and the n-strand in the vxl species result in a duplex stabilization 40-fold greater than that afforded by simple intercalation. Presumably, noncovalent interactions between Adriamycin and the n-strand are facilitated by immobilization of the drug attending its covalent attachment to the c-strand.
Independent experiments comparing the denaturation propensity for purified vxl adducts and unreacted unintercalated duplexes of various sizes have estimated the total vxl stabilization over Adriamycin-free DNA to be worth between six A⋅T base pairs and four G⋅C base pairs (data not shown). Total vxl duplex stabilization by this measure is, therefore, energetically equivalent to approximately 12 interstrand DNA H-bonds.
Adriamycin-DNA Adducts Mediated by Glyceraldehyde.
It is very likely that this surprising degree of vxl duplex stabilization against denaturation is related to the ability of covalent Adriamycin-DNA complexes to persist in vivo. Various mechanisms for the in vivo production of CH2O have been proposed, including autocatalytic Bayer–Villiger oxidation at Adriamycin C13 by H2O2 (9, 10), and oxidation of DNA-associated polyamines such as spermine by hydroxide radical (9, 10). Each scenario is dependent on the ability of Adriamycin to bind Fe(III) with extremely high affinity (16, 17) and on the availability of cellular reduction potential in the form of glutathione or xanthine oxidase, which is required for iron redox cycling leading to reactive oxygen species. In addition, we have found that glyceraldehyde is sufficient to engender Adriamycin-DNA complexes stable to denaturation (Fig. 5). In this case, the reaction proceeded only at ambient temperatures. Although the more biologically accessible 3-phosphate derivative of glyceraldehyde (G3P) failed to elicit stable Adriamycin-DNA adducts, it is unknown whether this inability is genuine or, rather, due to the instability of G3P at the ambient temperatures required for reaction. Similar attempts using acetaldehyde, erythrose, pyridoxal, and pyridoxal 5-phosphate as potential vxl mediators did not yield significant levels of vxl species.
Figure 5.
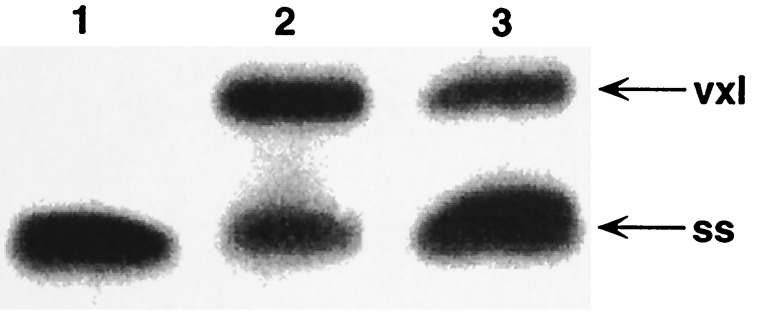
Mediation of stable Adriamycin-DNA adduct formation by glyceraldehyde. Reactions were in buffer A (13), and resolution was on gel type B (13). Reactions contained 100 μM Adriamycin and 100 μM oligomer d(AAAAGCTTTT)2 and were run overnight at 25°C. Lanes: 1, only DNA and Adriamycin; 2, DNA, Adriamycin, and 0.4% CH2O; 3, DNA, Adriamycin, and 0.5% glyceraldehyde. The gel was photographed by UV shadowing. Although not as efficient an initiator of stable Adriamycin-DNA adducts as CH2O, glyceraldehyde mediates stable adduct formation in high enough yield to be of potential biological significance.
The ability to isolate stable covalent Adriamycin-DNA adducts opens up new experimental routes for the structural evaluation and comparison of covalent complexes formed under the biologically relevant conditions proposed above, as well as under conditions not yet recognized. Of greatest initial importance will be the question of whether CH2O is a prerequisite for adduct formation in vivo or whether comparable duplex stabilization might also be effected by some other, hitherto unsuspected, cellular species or process.
Acknowledgments
This work was supported by Grant GM21966 from the National Institutes of Health.
ABBREVIATIONS
- NOESY
nuclear Overhauser effect spectroscopy
- HSQC
heteronuclear single quantum correlation
- vxl
virtual cross-link
Footnotes
This paper was submitted directly (Track II) to the Proceedings Office.
References
- 1. Weiss R B. Semin Oncol. 1992;19:670–686. [PubMed] [Google Scholar]
- 2.Phillips D R, White R J, Cullinane C. FEBS Lett. 1989;246:233–240. doi: 10.1016/0014-5793(89)80289-3. [DOI] [PubMed] [Google Scholar]
- 3.Cullinane C, Phillips D R. Biochemistry. 1990;29:5638–5646. doi: 10.1021/bi00475a032. [DOI] [PubMed] [Google Scholar]
- 4.Cullinane C, van Rosmalen A, Phillips D R. Biochemistry. 1994;33:4632–4638. doi: 10.1021/bi00181a025. [DOI] [PubMed] [Google Scholar]
- 5.Cutts S M, Phillips D R. Nucleic Acids Res. 1995;23:2450–2456. doi: 10.1093/nar/23.13.2450. [DOI] [PMC free article] [PubMed] [Google Scholar]
- 6.Wang A H-J, Gao Y-G, Liaw Y-C, Li Y-K. Biochemistry. 1991;30:3812–3815. doi: 10.1021/bi00230a002. [DOI] [PubMed] [Google Scholar]
- 7.Zhang H, Gao Y-G, van der Marel G A, van Boom J H, Wang A H-J. J Biol Chem. 1993;268:10095–10101. [PubMed] [Google Scholar]
- 8.Leng F, Savkur R, Fokt I, Przewloka T, Priebe W, Chaires J B. J Am Chem Soc. 1996;118:4731–4738. [Google Scholar]
- 9.Taatjes D J, Gaudiano G, Resing K, Koch T H. J Med Chem. 1996;39:4135–4138. doi: 10.1021/jm960519z. [DOI] [PubMed] [Google Scholar]
- 10.Taatjes D J, Gaudiano G, Resing K, Koch T H. J Med Chem. 1997;40:1276–1286. doi: 10.1021/jm960835d. [DOI] [PubMed] [Google Scholar]
- 11.Skladanowski A, Konopa J. Biochem Pharmacol. 1994;47:2269–2278. doi: 10.1016/0006-2952(94)90265-8. [DOI] [PubMed] [Google Scholar]
- 12.Skladanowski A, Konopa J. Biochem Pharmacol. 1994;47:2279–2287. doi: 10.1016/0006-2952(94)90266-6. [DOI] [PubMed] [Google Scholar]
- 13.Taatjes D J, Gaudiano G, Koch T H. Chem Res Toxicol. 1997;10:953–961. doi: 10.1021/tx970064w. [DOI] [PubMed] [Google Scholar]
- 14.Shiraishi H, Kataoka M, Morta Y, Umemoto J. Free Radical Res Comm. 1993;19:315–321. doi: 10.3109/10715769309056520. [DOI] [PubMed] [Google Scholar]
- 15.Sinha B K, Trush M A, Kennedy K A, Mimnaugh E G. Cancer Res. 1984;44:2892–2896. [PubMed] [Google Scholar]
- 16.Myers C, Gianni L, Zweier J, Muindi J, Sinha B K, Eliot H. Fed Proc. 1986;45:2792–2797. [PubMed] [Google Scholar]
- 17.Gelvan D, Samuni A. Cancer Res. 1988;48:5645–5649. [PubMed] [Google Scholar]