Abstract
Staphylococcus aureus can cause a range of diseases, such as osteomyelitis, as well as colonize implanted medical devices. In most instances the organism forms biofilms that not only are resistant to the body's defense mechanisms but also display decreased susceptibilities to antibiotics. In the present study, we have examined the effect of increasing silver contents in phosphate-based glasses to prevent the formation of S. aureus biofilms. Silver was found to be an effective bactericidal agent against S. aureus biofilms, and the rate of silver ion release (0.42 to 1.22 μg·mm−2·h−1) from phosphate-based glass was found to account for the variation in its bactericidal effect. Analysis of biofilms by confocal microscopy indicated that they consisted of an upper layer of viable bacteria together with a layer (∼20 μm) of nonviable cells on the glass surface. Our results showed that regardless of the silver contents in these glasses (10, 15, or 20 mol%) the silver exists in its +1 oxidation state, which is known to be a highly effective bactericidal agent compared to that of silver in other oxidation states (+2 or +3). Analysis of the glasses by 31P nuclear magnetic resonance imaging and high-energy X-ray diffraction showed that it is the structural rearrangement of the phosphate network that is responsible for the variation in silver ion release and the associated bactericidal effectiveness. Thus, an understanding of the glass structure is important in interpreting the in vitro data and also has important clinical implications for the potential use of the phosphate-based glasses in orthopedic applications to deliver silver ions to combat S. aureus biofilm infections.
Staphylococcus aureus, a leading cause of nosocomial infections worldwide, is the etiological agent of a wide range of diseases, from relatively benign skin infections to potentially fatal systemic disorders (41). Many of these diseases, including endocarditis, osteomyelitis, and foreign body-related infections, appear to be caused by biofilm-associated S. aureus (14, 18, 27, 38). Biofilms are sessile communities characterized by cells that are attached to a substratum or interface or to each other, embedded in a matrix of extracellular polymeric substances that they have produced, and exhibit an altered phenotype with respect to growth rate and gene transcription (14). Biofilm formation occurs as a result of a sequence of events: microbial surface attachment, cell proliferation, matrix production, and detachment (34). Biofilm-associated bacteria show decreased susceptibilities to antibiotics (10), disinfectants (31), and clearance by host defenses (14, 37). Work by Mulligan et al. (29, 30) showed that the inclusion of copper or silver ions in phosphate-based glasses was useful in treating biofilms of Streptococcus sanguis. Silver cations exhibit broad antimicrobial action at low concentrations, and they are already being used for the treatment of burn wounds (32) and traumatic injuries (5, 15). Feng et al. (15) studied the antibacterial effects of silver ions on Escherichia coli and S. aureus and suggested that the antibacterial mechanism was due to DNA not being able to replicate and proteins becoming inactivated after contact with silver ions.
Phosphate-based glasses are soluble materials that can act as a unique system for the delivery of silver ions in a controlled way (25). The ions are incorporated into the glass structure and are not a separate phase; thus, their rate of release is defined by the overall rate of degradation of the glass. Phosphate-based glasses have already been used to deliver silver ions to help control urinary tract infections in patients needing long-term indwelling catheters (9, 17, 40) and also in wound dressings to prevent infections (9). However, in recent work, anomalies have been reported whereby the antimicrobial effect does not follow an expected relationship with the silver content (2). This is thought to be due to the oxidation state of silver, the local coordination environment around the silver in the glass, and, more generally, the changes in the glass structure. Therefore, the aims of this study were (i) to produce a range of silver-doped phosphate-based glasses (glasses with 0, 10, 15, and 20 mol% silver [referred to here as Ag-negative, Ag10, Ag15, and Ag20 glasses or discs, respectively), (ii) to measure the local coordination environment around the silver, and (iii) to probe the glass structure and relate this to the results from S. aureus biofilm growth studies. The findings from this study may lead to the use of the phosphate-based glasses to deliver silver ions to combat S. aureus biofilm infections.
MATERIALS AND METHODS
Bacterial strain and growth.
Staphylococcus aureus NCTC 6571 was routinely propagated on nutrient agar (Oxoid, Basingstoke, United Kingdom) at 37°C. Nutrient broth (Oxoid) was used as the medium for the constant-depth film fermentor (CDFF) studies.
Preparation of silver-doped phosphate-based glasses.
Phosphate-based glasses were produced with NaH2PO4 (BDH), P2O5 (Sigma), and CaCO3 (BDH). For the production of silver-containing phosphate-based glasses, Ag2SO4 (BDH) was also used, as shown in Table 1. The amount of chemicals required for a particular composition were weighed and placed into a Pt-10% Rh crucible (Johnson Matthey, Royston, United Kingdom) when non-silver-containing glasses were produced, while a vitreous silica crucible (Saint-Gobain Quartz, Tyne & Wear, United Kingdom) was used when silver-containing glasses were produced (this was done to avoid the development of silver-forming alloys with platinum). The crucible was then placed in a preheated furnace at 1,100°C for 1 h. The molten glass was then poured into graphite molds which had been preheated to 370°C. The glass samples were allowed to cool to room temperature, and the resulting glass rods were cut into discs (diameter, 5 mm; thickness, 2 mm) by using a rotary diamond saw (Testbourne Ltd., Basingstoke, United Kingdom).
TABLE 1.
Compositions of phosphate-based glasses used in this study
| Glass codea | Glass Ag content | Glass composition (mol%)
|
|||
|---|---|---|---|---|---|
| Calcium oxide | Sodium oxide | Phosphorous pentoxide | Silver | ||
| Ca30Na20P50 | Ag negative | 30 | 20 | 50 | 0 |
| Ca30Na10P50Ag10 | Ag10 | 30 | 10 | 50 | 10 |
| Ca30Na5P50Ag15 | Ag15 | 30 | 5 | 50 | 15 |
| Ca30Na0P50Ag20 | Ag20 | 30 | 0 | 50 | 20 |
The subscript numbers indicate the mol% contents of the oxides.
Biofilm production.
A CDFF (University College Cardiff, Cardiff, United Kingdom), described previously by Mulligan et al. (30), was used for the production of biofilms. The CDFF, which contains a stainless steel turntable, can hold up to 15 polytetrafluoroethylene (PTFE) pans; each PTFE pan can hold 5 PTFE plugs. Discs 5 mm in diameter were placed on each plug and recessed to a depth of 300 μm. The PTFE pans were then inserted so that they were flush with the turntable. A cylindrical glass vessel and two stainless steel end plates encased the turntable. The top plate contained an air inlet port to which two 0.2-μm HEPA filter air vents (Fisher Scientific, Leicestershire, United Kingdom) were attached. It also contained three medium inlet ports. Incoming medium (in this case nutrient broth) dripped onto the rotating turntable and was distributed over the PTFE pans by two scraper blades. The scraper blades also served to maintain the biofilms on the discs at the required depth, equal to the depth of the recess. The bottom plate contained a medium outlet port. The CDFF was sterilized in a hot air oven at a temperature of 160°C for 1 h. During all experiments, the CDFF was incubated at 37°C. The turntable rotated at a speed of 3 rpm.
Viable counts.
At various time intervals, the pans were removed aseptically from the CDFF. Each pan was washed with 10 ml of phosphate-buffered saline (PBS; Oxoid). Discs containing biofilms were placed in 1 ml of PBS and were vortexed for 1 min to remove the attached biofilms and to disperse them into the suspension. Serial dilutions of the suspensions were carried out in PBS. Volumes of 25 μl of the suspension and each dilution were spread onto nutrient agar (Oxoid) plates. The plates were then incubated aerobically at 37°C for 48 h. For each type of disc, viable counts (the numbers of CFU) were determined in triplicate.
Scanning electron microscopy (SEM).
Aseptically removed discs were placed in 3% glutaraldehyde in 0.1 M sodium cacodylate buffer to fix the cells and were stored at 4°C overnight. Specimens were then prepared for the scanning electron microscope by first dehydrating them in a graded series of alcohol (20%, 50%, 70%, and 90%). The specimens were left in each alcohol concentration for 15 min, before they were rinsed three times in 100% alcohol (10 min each time). Each specimen was then transferred into hexadimethylsilane for 2 min before it was placed in a desiccator. Once they were dry, the specimens were mounted onto aluminum stubs by using araldite and were sputter coated with gold-palladium in a Polaron E5000 sputter coater. The specimens were then viewed with a Cambridge 90B scanning electron microscope operating at 15 kV.
CLSM.
For confocal laser scanning microscopy (CLSM), a viewing solution containing 8 ml of PBS together with 2 μl each of components A (molecular mass, 550 to 750 Da) and B (molecular mass, 668.4 Da) of BacLight LIVE/DEAD stain (Invitrogen, United Kingdom) was first prepared. The biofilm-containing discs were placed into a small cell-culture dish (Bibby Sterilin Ltd, Stone, United Kingdom) and covered with the viewing solution, and the stains were allowed to develop in the dark for 10 min. The biofilms were then examined with an Olympus BX51 microscope onto which was incorporated a Bio-Rad Radiance 2100 laser scanning system and a LUMPlanFI ×40 water lens. Two-channel (viable “Live” and nonviable “Dead”) confocal image stacks were collected in eight-bit color depth at a resolution of 1,024 by 1,024 pixels. The z-axis step size was typically 0.6 μm; however, this was optimized for each image stack, depending upon the total depth of the sample.
Image analysis.
The initial image analysis and three-dimensional structure construction were performed by using Bio-Rad LaserVox image analysis software, while the structure and distribution of cell vitality (19, 22) were elucidated with ImageJ software (version 1.33 u; National Institutes of Health). Projection images (plan view) were constructed to return the sum of pixel brightness values through the entire image stack, effectively merging all the individual sections into one grey-scale image. The depth-related trends of the viable and nonviable stains through the biofilms were determined by constructing fluorescence profiles. These profiles were created by plotting the total image brightness for each channel against the depth into the image stack. These data were then normalized against the maximum brightness value within the channel and converted into depth-related viability profiles by plotting the normalized viable fluorescence minus the normalized nonviable fluorescence values against the depth into the biofilms (19, 20).
Statistical analysis.
One-way analysis of variance was used to compare mean viable counts, following arcsinh transformation of the data. When a significant difference was detected, a Tukey test (GraphPad Software, San Diego, CA) was conducted to find which values were different.
Glass degradation and ion release. (i) Degradation study.
Silver-doped phosphate-based glass rods (diameter, 5 mm; thickness, 2 mm) with different silver ion contents were placed in plastic containers, which were filled with 50 ml of deionized water (pH 7 ± 0.5) and placed in an incubator at 37°C. At various time points (6, 24, 48, 120, and 144 h) the three discs were taken out of their respective containers and excess moisture was removed by blotting the samples dry with tissue before they were weighed. All the discs were placed into a fresh solution of deionized water and placed back into the 37°C incubator. To obtain the rate of weight loss, the initial weight (M0) of each sample was measured, as was the weight at time t (Mt), to give a weight loss per unit area; thus, weight loss = (M0 − Mt)/A, where A is the surface area (mm2). The measurements were carried out in triplicate. The data were plotted as weight loss per unit area against time. The slope of this graph gave a dissolution rate value in terms of mg·mm−2 h−1, which was determined by fitting a straight line of the form y = mx through the origin.
(ii) Ion release study.
Ion release studies were simultaneously conducted, and the medium was analyzed for cation (Na+ and Ca2+) and anion (PO43−, P2O74−, P3O93−, and P3O105−) release by ion chromatography (Dionex, United Kingdom). Silver ion release was measured by using a commercially available silver test kit (1.14831.0001; Merck, United Kingdom). The test works on the principle that in a weakly acidic solution, silver ions react with phenanthroline and eosin to form a red complex, the concentration of which is determined photometrically (at 552 nm). A silver standard solution, 1,000 mg/liter Ag, provided by the supplier, was used to prepare the calibration curve. In the event that silver concentrations exceeded 5 mg/liter, the samples were diluted before measurement. For all samples tested, high-purity water was used as a reference.
Structural analysis of the silver-doped phosphate-based glasses. (i) 31P MAS NMR.
All magic angle spinning (MAS) 31P nuclear magnetic resonance (NMR) experiments were performed with a Varian-Chemagnetics CMX 360-MHz Infinity spectrometer equipped with an 8.45-T magnet operating at a frequency of 145.85 MHz. A Varian 4-mm probe was used, and the samples were spun at ∼12 kHz. A standard one-pulse experimental procedure was used. A single pulse of 1.4 μs (corresponding to a tip angle of 30°) and a recycle delay of 450 s were used due to the extremely long T1 (spin-lattice relaxation time) of ∼360 s. The spectra were referenced against a secondary reference of NH4H2PO4 at a shift of +0.9 ppm (relative to that of 85% H3PO4).
(ii) HEXRD.
The high-energy X-ray diffraction (HEXRD) data were collected on Station 9.1 at the Synchrotron Radiation Source, Daresbury Laboratory, United Kingdom. The finely powdered samples were enclosed inside a 0.5-mm-thick circular metal annulus by kapton windows and mounted onto a flat-plate instrumental setup. The wavelength (λ) was set at 0.5092 Å and was calibrated by using the K edge of a Pd foil; this value was low enough to provide data to a high value of momentum transfer (Qmax, where Qmax = 4πsinθ/λ, which is ∼22 Å−1). The data were corrected by using a collection of programs written in-house.
The initial stage of analysis of the X-ray diffraction data from an amorphous material involves the removal of background scattering, normalization, correction for absorption, and subtraction of the self-scattering term (13). The resultant scattered intensity, i(Q), can reveal structural information by Fourier transformation to obtain the pair distribution function, T(r):
 |
where T0(r) = 2π2rρo (where r is the atomic separation between atoms, and ρo is the macroscopic number density) and Q = 4πsine(θ)/λ.
Ag K-edge XANES measurements.
Ag K-edge X-ray absorption near edge spectroscopy (XANES) measurements were made at a temperature of approximately 77 K on Station 16.5 at the Synchrotron Radiation Source. The spectra were recorded in transmission mode by using a double-crystal Si(220) monochromator and ionization chambers to detect the incident and transmitted beam intensities, Ii and It, respectively. A silver foil and a third ionization chamber were placed after the sample's transmission ionization chamber to allow an absorption spectrum of the foil to be collected simultaneously for the purpose of calibration of the energy scale. The energy scale was defined by assigning the maximum of the derivative of the Ag foil spectrum to 25521.0 eV.
The data processing comprised conversion of the data to absorption versus energy, calibration of the energy scale, removal of the pre-edge absorption by straight-line fitting to log10(Ii/It), and removal of the post-edge atomic absorption profile by fitting with a second-order polynomial. All the spectra were normalized to have an edge step of unity. Spectra were also collected from the reference materials AgO (Aldrich) and Ag2SO4 (≥99.99%; Aldrich).
RESULTS
SEM analysis of the attachment of S. aureus to silver-doped phosphate-based glasses.
SEM analysis of S. aureus biofilms on hydroxyapatite (HA), Ag-negative, Ag10, Ag15, and Ag20 discs showed a reduction in S. aureus attachment on the Ag10, Ag15, and Ag20 discs, with that on Ag20 discs being the least compared to that on Ag-negative and HA discs (data not shown).
Effect of increasing silver ion concentration on the viable counts of S. aureus in biofilms for 48 h.
Initial viable count experiments were conducted on Ag10, Ag15, and Ag20 discs (Table 1). Both Ag-negative and HA discs were used as controls (Fig. 1). Each point represents the log10 of the mean number of viable counts of three biofilms from one representative CDFF run. Error bars represent standard deviations. It should be noted that at least three runs for each experiment were performed to confirm the results found. The data were not pooled because slight differences in the inoculation produced differences in the absolute CFU numbers obtained. However, the relative differences found were very repeatable.
FIG. 1.
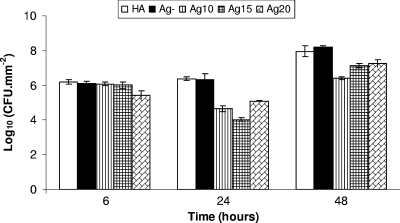
Log10 CFU/mm2 of S. aureus in biofilms formed on HA, Ag-negative (Ag-), Ag10, Ag15, and Ag20 discs.
(i) Ag10 glasses.
The Ag10 glasses showed no significant difference in the log10 of the mean number of viable cells (6.08 ± 0.11) compared to those for both the Ag-negative discs (6.11 ± 0.13; P = 0.77) and the HA discs (6.19 ± 0.12; P = 0.11) at 6 h (Fig. 1). However, at 24 h the Ag10 discs displayed a statistically significant (P ≤0.001) difference in the log10 of the mean number of viable cells (4.65 ± 0.17) compared to those for both the controls, the Ag-negative discs (6.32 ± 0.32) and the HA discs (6.37 ± 0.11). The log10 of the mean number of viable cells at 48 h on Ag10 discs (6.42 ± 0.08) started to recover from the previous low at 24 h, but it was still less than the values for both of the controls, the Ag-negative discs (8.21 ± 0.06; P = 0.0001) and the HA discs (7.96 ± 0.33; P = 0.001). There was an approximately 1.2-log10 reduction in the numbers of CFU for the Ag10 glasses compared to those for the control glasses that were maintained for the first 48 h.
(ii) Ag15 glasses.
Similar to the findings for the Ag10 glasses, the Ag15 glasses also showed no significant difference in the log10 of the mean number of viable cells (6.02 ± 0.20) compared to the values for both the Ag-negative discs (6.12 ± 0.13; P = 0.51) and the HA discs (6.19 ± 0.13; P = 0.28) at 6 h (Fig. 1). By 24 h, the Ag15 discs displayed a statistically significant (P ≤ 0.0003) difference in the log10 of the mean number of viable cells (4.03 ± 0.11) compared to the values for both of the controls, the Ag-negative discs (6.33 ± 0.32) and the HA discs (6.37 ± 0.11). Similar to the Ag10 glasses, the log10 of the mean number of viable cells at 48 h on Ag15 discs (7.14 ± 0.13) started to recover from the previous low at 24 h, but the value was still less than those for both of the controls, the Ag-negative discs (8.21 ± 0.06; P = 0.0002) and the HA discs (7.96 ± 0.33; P = 0.002). There was an approximately 1.5-log10 reduction in the numbers of CFU maintained for the first 48 h by Ag15 glasses compared to the values for the controls.
(iii) Ag20 glasses.
Only the Ag20 glasses showed a statistically significant difference in the log10 of the mean number of viable cells (5.44 ± 0.24) compared to the values for both the Ag-negative discs (6.11 ± 0.13; P = 0.015) and the HA discs (6.19 ± 0.13; P = 0.01) at 6 h (Fig. 1). As with the other glasses, the log10 of the mean number of viable cells at 24 h on the Ag20 discs (5.10 ± 0.04) started to recover from the previous low at 6 h but showed a statistically significant difference from the values for both of the controls, the Ag-negative discs (6.33 ± 0.32; P = 0.003) and the HA discs (6.37 ± 0.11; P = 0.0001). After 48 h, the Ag20 discs displayed a significant difference in the numbers of CFU (7.26 ± 0.21) compared to the values for the controls, the Ag-negative discs (8.21 ± 0.06; P = 0.002) and the HA discs (7.96 ± 0.33; P = 0.036). There was an approximately 1-log10 reduction in the numbers of CFU that was maintained for the first 48 h by the Ag20 glasses compared to the values for the controls.
Due to the early onset of a bactericidal effect (from 6 h of biofilm growth) by the Ag20 glasses, the Ag20 glasses were chosen along with Ag15 glasses (which displayed a maximum bactericidal effect at 24 h of biofilm growth compared to the times for the other glasses) for the second set of CDFF studies with time points up to 144 h.
Effect of Ag15 glasses on viable counts of S. aureus biofilms up to 144 h.
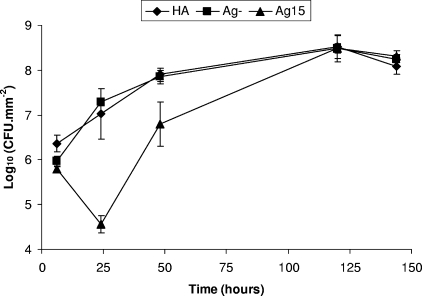
In the second set of experiments, the Ag15 glasses showed no significant difference in the log10 of the mean number of viable cells (5.79 ± 0.08) compared to the values for the Ag-negative discs (5.97 ± 0.11; P = 0.084) but did show a statistically significant difference from the values for the HA discs (6.36 ± 0.19; P = 0.009) at 6 h (Fig. 2). The difference in CFU became more apparent at 24 h, as the Ag15 disc (4.56 ± 0.2) displayed a statistically significant (P ≤ 0.002) difference in the log10 of the mean number of viable cells compared to the values for both of the controls, the Ag-negative discs (7.29 ± 0.09) and the HA discs (7.02 ± 0. 0.57). After 48 h, the log10 of the mean number of viable cells on the Ag15 discs (6.80 ± 0.49) started to recover from the previous low at 24 h, but it was still less than the values for both of the controls, the Ag-negative discs (7.85 ± 0.15; P = 0.024) and the HA discs (7.9 ± 0.15; P = 0.021). However, at time points >48 h, the Ag15 glasses showed a sharp increase in the numbers of CFU compared to those for the controls, and the log10 CFU for all samples reached values similar to those for the controls by 120 h and remained similar, at approximately 8.3 log10 CFU, until 144 h (Fig. 2).
FIG. 2.
Log10 CFU/mm2 of S. aureus in biofilms formed on HA, Ag-negative (Ag-), and Ag15 discs.
Effect of Ag20 glasses on viable counts of S. aureus biofilms up to 144 h.
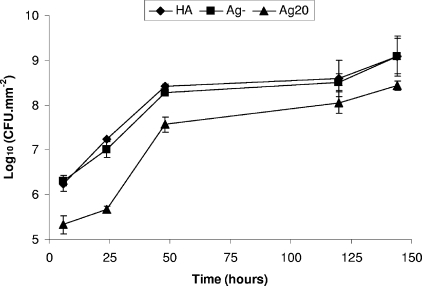
The Ag20 glasses showed the greatest difference in the log10 of the mean number of viable cells (5.33 ± 0.20) compared to the values for both the Ag-negative discs (6.31 ± 0.11; P = 0.002) and the HA discs (6.23 ± 0.16; P = 0.004) at 6 h (Fig. 3). As in the first set of CDFF runs, the log10 of the mean number of viable cells at 24 h on the Ag20 discs (5.66 ± 0.07) started to recover from the previous low at 6 h but showed a significant difference from the values for both of the controls, the Ag-negative discs (7.0 ± 0.18; P = 0.0003) and the HA discs (7.23 ± 0.03; P = 0.0001). This effect continued at 48 h with the Ag20 discs, with the values for the Ag20 discs (7.57 ± 0.16) displaying a significant difference from those for both of the controls, the Ag-negative discs (8.27 ± 0.03; P = 0.002) and the HA discs (8.42 ± 0.05; P = 0.0009). Compared to the Ag15 glasses, at 120 h, the log10 CFU on the Ag20 glasses stayed at a reduced level (8.05 ± 0.24) compared to the value for the Ag-negative discs (8.51 ± 0.19; P = 0.03) but did not exhibit any statistically significant difference from the value for the HA discs (8.59 ± 0.40; P = 0.096). More importantly, at longer time points, the log10 CFU stayed at a reduced level, approximately 0.6-log10 CFU reductions, compared to the value for both of the controls (P ≤ 0.005) even until 144 h (Fig. 3).
FIG. 3.
Log10 CFU/mm2 of S. aureus in biofilms formed on HA, Ag-negative (Ag-), and Ag20 discs.
Identification of dead bacterial layers by CLSM.
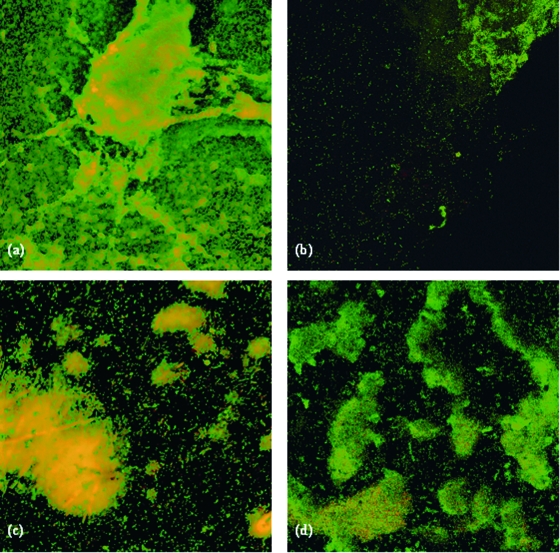
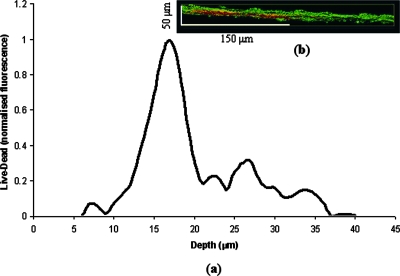
The use of water immersion lenses and a liquid viewing medium (PBS) in the present study enabled the observation of biofilms in their natural hydrated state (Fig. 4). Viability mapping, as described by Hope and Wilson (20), which encompasses viability changes in the z axis, was performed (Fig. 5). As seen in normal views of BacLight LIVE/DEAD-stained images, in the present study, the viable cells fluoresce green and the nonviable cells fluoresce red (Fig. 4). The biofilms were submerged in the stains (at a relatively high concentration) for at least 15 min before the CLSM scan. The molecular masses of the BacLight LIVE/DEAD stain components are similar and have a net positive charge. It is therefore unlikely that there is any significant difference in the characteristics of their diffusion into biofilms. The viability distributions in the biofilms were observed in this study by CLSM image analysis. Regions of biofilms composed of viable bacteria with a layer of nonviable bacteria at the interface with the antimicrobial agent-releasing materials were analyzed further (Fig. 5).
FIG. 4.
CLSM images after 48 h of growth of S. aureus biofilms on (a) Ag-negative, (b) Ag10, (c) Ag15, and (d) Ag20 discs. Viable (green) and nonviable (red) bacteria are shown.
FIG. 5.
(a) Viability profile through 2-day-old biofilms grown on Ag20 discs. The y axis is the normalized viable values minus the nonviable fluorescence values of three separate viability profiles. These data were further normalized to a range of 0 to 1. (b) Cross-sectional view of the biofilms part used for viability profiling.
Viability mapping.
Depth-related viability profiles (Fig. 5) through the 2-day-old biofilms returned positive (i.e., increasing) values in the upper ∼20 μm of the confocal image stack. This indicated that the proportion of viable fluorescence compared to the proportion of nonviable fluorescence increased with depth (i.e., the vertical distance into the biofilm from its highest point) in this region. Between depths of ∼20 and ∼40 μm, the viability profile values decreased, suggesting that the proportion of viable fluorescence decreased. Moreover, at these depths the viability profiles values fluctuated from low to high. This may be because of the confocal laser/fluorophore emissions becoming absorbed by the biofilm, which caused a corresponding reduction in the brightness of the optical sections.
Degradation and ion release of silver-doped phosphate-based glasses.
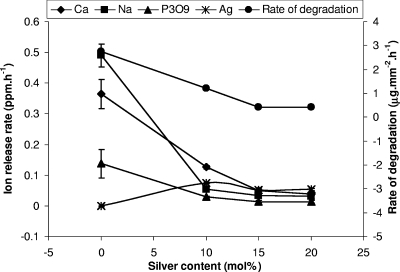
The degradation rates obtained by applying a line of best fit through the weight loss per unit area of each of the glasses against time (data not shown) were 1.22, 0.41, and 0.42 μg·mm−2·h−1 for the Ag10, Ag15, and Ag20 glasses, respectively (Fig. 6). Both the Ag15 and the Ag20 glasses showed no perceptible differences in their degradation rate profiles (Fig. 6). However, the profile of the Ag10 glasses did exhibit an increased degradation rate compared to those for the Ag15 and Ag20 glasses. The result showed that the rate of silver ion release is correlated to the rate of degradation, with a statistically significant (P ≤ 0.005) difference between the Ag10 glasses and the Ag15 and Ag20 glasses but no significant difference (P ≥ 0.692) between the Ag15 and the Ag20 glasses (Fig. 6). The rates of release of other cations, such as Na+, displayed statistically significant (P ≤ 0.016) differences between the Ag10 glasses and the Ag15 and Ag20 glasses but no statistically significant difference (P ≥ 0.666) between the Ag15 and the Ag20 glasses (Fig. 6). Similarly, for the Ca2+ ion, a statistically significant (P ≤ 0.0001) difference was observed only between the Ag10 glasses and the Ag15 and Ag20 glasses but not between the Ag15 and the Ag20 glasses (P ≥ 0.167). Among the anions (PO43−, P2O74−, P3O93−, and P3O105−), P3O93− was the anion released to the greatest extent, and its rate of release was also found to correlate strongly with the rate of degradation of the glasses (Fig. 6). As in the case of the cations, the rate of P3O93− ion release showed a statistically significant (P ≤ 0.016) difference between the Ag10 glasses and the Ag15 and Ag20 glasses but no significant difference (P ≥ 0.666) between the Ag15 and the Ag20 glasses.
FIG. 6.
Relationship between cation and anion release rates and rate of degradation of silver-doped phosphate glasses as a function of silver content.
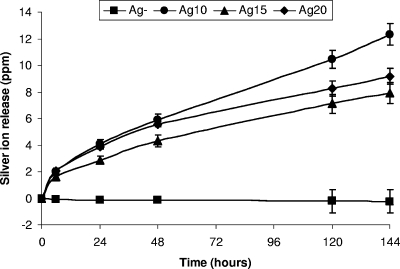
Due to the importance of silver release in this study, the actual amount of silver ion released at each time point is highlighted in Fig. 7. As expected, no silver was detected from the Ag-negative glasses throughout the silver release study. At 6 h, there were no significant differences (P ≥ 0.066) in silver ion release among the Ag10, Ag15, and Ag20 glasses (Fig. 7); and this continued up to 48 h between the Ag10 and the Ag20 glasses (P ≥ 0.078). The Ag20 glasses released larger amounts of silver at 24 and 48 h compared to the amount released by the Ag15 glasses, but there were no significant differences in silver ion release at 120 and 144 h between the Ag15 and the Ag20 glasses (P ≥ 0.09). However, from 48 h onwards the Ag10 glasses released the largest amount of silver ions compared to the amounts released by both the Ag15 and the Ag20 glasses (Fig. 7).
FIG. 7.
Cumulative silver ion release versus time for the Ag-negative (Ag-), Ag10, Ag15, and Ag20 glass compositions investigated.
Structural analysis of the silver-doped phosphate-based glasses.
By examining the results in Fig. 1 for the bactericidal effectiveness of the silver-doped phosphate-based glasses on S. aureus biofilms after 48 h, an excellent correlation with the silver release curve shown in Fig. 6 was found: with silver at amounts above 10 mol%, there was a reduction in both the bactericidal activity and silver ion release. The reduction in silver ion release also correlated with a flattening of the rate of degradation curve in Fig. 6, where the expected reduction (on the basis of the relative solubilities of sodium and silver salts) in the dissolution rate with increasing substitution of silver ions for sodium ions did not continue above 15 mol%. In order to understand the variation of the properties of the glass with silver content, the structure of the glass was examined by 31P MAS NMR, HEXRD, and Ag K-edge XANES.
The structure of phosphate glasses is known to consist of PO43− tetrahedra connected together by between one and three bridging oxygen atoms (BOs) to form a network (8). The connectivity of this phosphate network is commonly described by the notation Qn, where n refers to the number of BOs in the PO43− group. Thus, a Q3 PO43− unit has three BOs to other PO43− units and one nonbridging oxygen (NBO), whereas a Q0 PO43− unit has four NBOs and is unconnected to other PO43− groups. This connectivity is affected by the glass composition. Vitreous P2O5 has a structure composed entirely of Q3 units, whereas addition of metal oxides to phosphate glasses reduces this connectivity and introduces Q1 and Q2 groups into the structure.
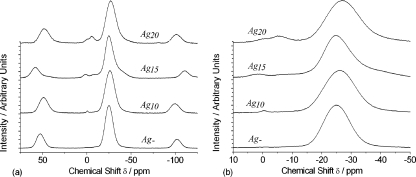
In the 31P MAS NMR spectra for the silver-doped phosphate-based glasses, shown in Fig. 8, the single most prominent peak observed occurs at a chemical shift of −27 ppm and is assigned to Q2 groups (26). Two weaker resonances are also observed at −6 and −37 ppm; the latter manifests itself as a broad tail on the low-chemical-shift side of the main peak. They are assigned to the presence of phosphorus in Q1 and Q3 environments, respectively The presence of Q1 and Q3 environments in samples containing ≥10 mol% silver is indicative of the disproportionation of Q2 units according to the equation, 2Q2 → Q1 + Q3. In other words, Q2 groups, which are the structural units that make up phosphate chains and rings, are converting to Q1 units, which represent P2O7 dimers and chain-terminating phosphate groups, and Q3 groups, which represent cross-linking between the phosphate chains. By examining Fig. 8, it can be seen that the intensities of the Q1 and Q3 features increase with the silver content, suggesting a structural change in the glass that occurs as a function of the silver content. The 31P NMR results therefore show that as the silver content of these glasses increases, there is a structural change from phosphate rings and polymeric chains to shorter, more cross-linked chains.
FIG. 8.
(a) 31P MAS NMR spectra of the Ag-negative (Ag-), Ag10, Ag15, and Ag20 glasses; (b) highlights of the prominent peaks.
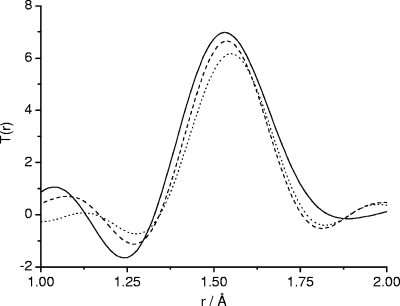
The HEXRD pair-distribution functions shown in Fig. 9 give information on the average P—O bonding in the glasses. The peak centered at ∼1.55 Å in these functions is composed of two components: a shorter distance of ∼1.49 Å due to P—NBO bonds and a longer distance of ∼1.60-Å P—BO bonding (8). It can be seen from Fig. 9 that the shape of the P—O peak in the samples studied here changes as the silver content increases (10 to 20 mol%). This change reflects a change in the distribution of BOs and NBOs between phosphorus atoms as a function of silver content, consistent with Q2 groups disproportionating into Q1 and Q3 groups. In agreement with the 31P NMR data, this result suggests a change in the connectivity of the phosphate network with higher silver loadings.
FIG. 9.
HEXRD pair-distribution functions of phosphate-based glasses Ag10 (solid line), Ag15 (dashed line), and Ag20 (dotted line) showing the peak due to P—O bonding.
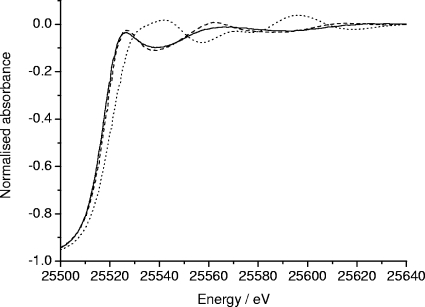
The Ag K-edge XANES measurements yield information on the oxidation state of silver and its local structural environment. The XANES spectra from the three silver-doped phosphate glasses studied here were identical, demonstrating that the oxidation state and the local environment of silver is the same in each glass. For this reason only the spectrum from the Ag10 glass is shown in Fig. 10. The Ag K-edge XANES spectra from the reference compounds are also shown in Fig. 10. The position of the X-ray absorption edge in each spectrum contains information on the oxidation state of the silver present. The edge position of AgO, which contains a mixture of AgI and AgIII ions (28), appears at the highest energy since it requires more energy to remove electrons from the higher-valence ions. The absorption edges of AgI compounds appear at a lower energy. The edge positions of the silver-doped phosphate glasses all overlay the edge position of Ag2SO4. Given that Ag2SO4 is an AgI compound, this result suggests that the silver in the glasses is present as AgI. The similarity in the shape of the XANES spectra from the phosphate glasses and that from Ag2SO4 suggests that the structural environment of the silver in the glasses is similar to that in the sulfate. Since Ag2SO4 contains silver ions surrounded by a distorted octahedron of oxygen atoms (16), it follows that the silver ions in the phosphate-based glasses reside in a very similar environment.
FIG. 10.
Ag K-edge XANES spectra: Ag10 glass (solid line), Ag2SO4 (dashed line), and AgO (dotted line).
DISCUSSION
Previous work suggests that silver-doped phosphate-based glasses, with a fixed phosphate content of 50 mol% and a fixed calcium oxide content of 30 mol%, are capable of broad-spectrum bactericidal activity against planktonic bacteria, including S. aureus (2). However, in a biofilm environment, microbes exhibit reduced susceptibilities to antimicrobial agents. Silver has been shown to be bactericidal against Streptococcus sanguis biofilms when phosphate-based glasses were used as a means of delivering the ions in a controlled manner (30). The results of the present study show that the release of an optimal amount of silver ions from the silver-doped phosphate-based glasses that can cause a significant reduction of S. aureus biofilm growth occurs in 24 h. From this point onwards, the silver ions released from the glasses did not prevent the reemergence of viable bacteria from the biofilms (Fig. 1). Moreover, the CLSM analysis confirmed the production of a dead bacterial layer at the interface between the biofilm and the silver-releasing phosphate-based glasses (Fig. 5b).
Chaw et al. (11) reported that low concentrations of silver ions are unsuitable for the treatment of biofilm infections. Although higher silver concentrations have increased effectiveness against sessile cells (3, 30), they nevertheless face the challenge of maintaining their ionic form in applications containing large amounts of halides and other ions (e.g., Cl−, HCO3−, and CO3−) and proteins (24, 35) due to the production of the insoluble silver salts, which results in silver ion inactivity. As silver ions are highly reactive and bind strongly to the electron donor groups containing oxygen or nitrogen (36) in the extracellular matrix, we suggest that they must be able to bind to molecules such as proteins and polysaccharides within the extracellular matrix. Therefore, it is plausible that the formation of a dead bacterial layer (Fig. 5b) at the interface with the silver-releasing phosphate-based glasses resulted in the reemergence of viable bacteria after 24 h growth of S. aureus in the present study. Other factors, such as the limitation of diffusion of silver ions from the phosphate-based glasses or the switching on and off of the quorum-sensing signals that trigger the efflux pump, which protected S. aureus from the toxic silver ions, need to be addressed.
Viability mapping can be used to examine the penetration of the bactericidal effects of antimicrobial compounds into biofilms. While it is obviously useful to make direct measurements of the penetration of the antimicrobial compound itself (usually by the use of microelectrodes) into the biofilm, it is the penetration of the antimicrobial effect that is of greater importance with regard to the remediation of the most recalcitrant microbial biofilms (22). The fidelity of the BacLight LIVE/DEAD stain does not allow one to categorically state that an individual cell which has taken up the nonviable stain (propidium iodide) is unable to reproduce in culture (4). However, it is sufficient to allow us to visualize gradients in the spatial distribution of these stains and interpret these motifs as indicators of gradients in cell vitality. In a recent study, Beyenal et al. (7) used an optical microsensor to probe biofilms of S. aureus which were labeled with a yellow fluorescent protein. The microsensor measured the fluorescence in the biofilms directly and reported depth-related profiles similar to the bell curves obtained by CLSM (21). This suggested that metabolic activity (vitality) increases with depth in the outer layers of a biofilm before it decreases in the deeper regions.
Although high concentrations of free silver ions are needed for bactericidal action against biofilms, it is very important not to sacrifice any cyto/biocompatibility aspects of the material while maintaining an effective antimicrobial effect. The amount of silver released from the silver-doped glasses investigated in this study is well below the levels that are cytotoxic for human cells (33). The report suggested that the minimum bactericidal concentration of silver is 0.1 ppm and that the cytotoxic concentration is 1.6 ppm for human cells (33). The actual amounts quantified from the profiles observed in Fig. 7 were 0.083, 0.055, and 0.064 ppm·h−1 for the Ag10, Ag15, and Ag20 glasses, respectively. All of these values are within the limits specified above. However, it must be noted that it was unclear if the levels of 0.1 ppm and 1.6 ppm stated by Saravanapavan et al. (33) were total values or whether they were rates in hours, days, etc.
The structural analysis by 31P NMR revealed that Q2 species are the dominant structural unit in the glasses investigated. This agrees with the predicted model for metaphosphate glasses (i.e., 50 mol% P2O5), in which the network should be based exclusively on Q2 tetrahedra that form chains and/or rings (1, 8). Recently, it was found that the phosphate network was unaltered by exchanging sodium with silver for up to one-quarter of the initial sodium content (2a). This result also correlated well with the results of X-ray diffraction studies in which the crystalline phase identified after annealing of the glass at the crystallization temperature of glass was a cyclic Q2 species (namely, P3O9).
As can be observed from the dissolution profiles in Fig. 6, for silver-doping levels above 10 mol%, the rate of release of silver ions decreases and the overall degradation of the glass stabilizes. This change can be correlated with a structural change that can be observed in the 31P NMR and HEXRD results. This change is related to a rearrangement of the phosphate network from Q2 chains and rings to shorter, more branched chains, as indicated by the presence of increasing amounts of Q1 and Q2 species with increasing silver content. The Ag K-edge XANES spectra from the Ag10, Ag15, and Ag20 glasses are all identical, confirming that there is no change in the silver oxidation state or local environment as a function of silver content. Given this, we can conclude that it is the structural rearrangement of the phosphate network that is responsible for the variation in silver ion release and the associated bactericidal effectiveness. The literature shows that silver in its +1 oxidation state is highly effective against planktonic bacteria (6, 15, 23). The Ag K-edge XANES spectra from the glasses studied here confirm that the silver is present as AgI in all three compositions.
Apart from the current applications, such as coating of a catheter with silver ions to avoid bloodstream infections (12, 39), a strategy of using the silver ions' bactericidal effect on biofilms in combination with other antimicrobial ions, such as copper, zinc, or gallium, can be explored for the future testing of antimicrobial effectiveness. This synergistic approach may work well, with the silver ions destabilizing the biofilm matrix and other antimicrobial ions and subsequently killing the bacteria.
Acknowledgments
We thank the following people from UCL Eastman Dental Institute, United Kingdom, for their help on various aspects of the work; Farah Dalwai (CDFF), Will Koning and Ensanya Abou Neel (CLSM), and Nicky Morden (SEM). We also thank B. Bilsborrow and M. A. Roberts of the CCLRC Daresbury Laboratory for their assistance with the use of instruments 16.5 and 9.1, respectively.
This work was supported by the EPSRC, United Kingdom (grants GR/T21080/01, EP/C000714/1, and EP/C000633/1).
Footnotes
Published ahead of print on 1 October 2007.
REFERENCES
- 1.Ahmed, I., M. P. Lewis, I. Olsen, and J. C. Knowles. 2004. Phosphate glasses for tissue engineering. Part 1. Processing and characterisation of a ternary based P2O5-CaO-Na2O glass system. Biomaterials 25:491-499. [DOI] [PubMed] [Google Scholar]
- 2.Ahmed, I., D. Ready, M. Wilson, and J. C. Knowles. 2006. Antimicrobial effect of silver-doped phosphate-based glasses. J. Biomed. Mater. Res. A 79:618-626. [DOI] [PubMed] [Google Scholar]
- 2a.Ahmed, I., E. A. Abou Neel, S. P. Valappil, S. N. Nazhat, D. M. Pickup, D. Carta, D. L. Carroll, R. J. Newport, M. E. Smith, and J. C. Knowles. 2007. The structure and properties of silver-doped phosphate-based glasses. J. Biomat. Sci. 42:9827-9835. [Google Scholar]
- 3.Akiyama, H., O. Yamasaki, H. Kanzaki, J. Tada, and J. Arata. 1998. Effects of sucrose and silver on Staphylococcus aureus biofilms. J. Antimicrob. Chemother. 42:629-634. [DOI] [PubMed] [Google Scholar]
- 4.Amor, K. B., P. Breeuwer, P. Verbaarschot, F. M. Rombouts, A. D. Akkermans, W. M. De Vos, and T. Abee. 2002. Multiparametric flow cytometry and cell sorting for the assessment of viable, injured, and dead Bifidobacterium cells during bile salt stress. Appl. Environ. Microbiol. 68:5209-5216. [DOI] [PMC free article] [PubMed] [Google Scholar]
- 5.Becker, R. O. 1999. Silver ions in the treatment of local infections. Metal-Based Drugs 6:311-314. [DOI] [PMC free article] [PubMed] [Google Scholar]
- 6.Bellantone, M., H. D. Williams, and L. L. Hench. 2002. Broad-spectrum bactericidal activity of Ag2O-doped bioactive glass. Antimicrob. Agents Chemother. 46:1940-1945. [DOI] [PMC free article] [PubMed] [Google Scholar]
- 7.Beyenal, H., C. Yakymyshyn, J. Hyungnak, C. C. Davis, and Z. Lewandowski. 2004. An optical microsensor to measure fluorescent light intensity in biofilms. J. Microbiol. Methods 58:367-374. [DOI] [PubMed] [Google Scholar]
- 8.Brow, R. K. 2000. The structure of simple phosphate glasses. J. Non-Crystal. Solids 263:1-28. [Google Scholar]
- 9.Cartmell, S. H., P. J. Doherty, N. P. Rhodes, J. A. Hunt, D. M. Healy, and T. Gilchrist. 1998. Haemocompatiblity of controlled release glass. J. Mater. Sci. Mater. Med. 9:1-7. [DOI] [PubMed] [Google Scholar]
- 10.Ceri, H. M., E. Olson, C. Stremick, R. R. Read, D. Morck, and A. Buret. 1999. The Calgary biofilm device: new technology for rapid determination of antibiotic susceptibilities of bacterial biofilms. J. Clin. Microbiol. 37:1771-1776. [DOI] [PMC free article] [PubMed] [Google Scholar]
- 11.Chaw, K. C., M. Manimaran, and F. E. H. Tay. 2005. Role of silver ions in destabilization of intermolecular adhesion forces measured by atomic force microscopy in Staphylococcus epidermidis biofilms. Antimicrob. Agents Chemother. 49:4853-4859. [DOI] [PMC free article] [PubMed] [Google Scholar]
- 12.Cicco, M. D., C. Campisi, and M. Matovic. 2003. Central venous catheter-related bloodstream infections: pathogenesis factors, new perspectives in prevention and early diagnosis. J. Vasc. Access 4:83-91. [PubMed] [Google Scholar]
- 13.Cole, J. M., E. R. H. van Eck, G. Mountjoy, R. Anderson, T. Brennan, G. Bushnell-Wye, R. J. Newport, and G. A. Saunders. 2001. An X-ray diffraction and 31P MAS NMR study of rare-earth phosphate glasses, (R2O3)x(P2O5)1 − x, x = 0.175 − 0.263, R = La, Ce, Pr, Nd, Sm, Eu, Gd, Tb, Dy, Ho, Er. J. Phys. Condes. Matter 13:4105-4122. [Google Scholar]
- 14.Donlan, R. M., and J. W. Costerton. 2002. Biofilms: survival mechanisms of clinically relevant microorganisms. Clin. Microbiol. Rev. 15:167-193. [DOI] [PMC free article] [PubMed] [Google Scholar]
- 15.Feng, Q. L., J. Wu, G. Q. Chen, F. Z. Cui, T. N. Kim, and J. O. Kim. 2000. A mechanistic study of the antibacterial effect of silver ions on Escherichia coli and Staphylococcus aureus. J. Biomed. Mater. Res. 52:662-668. [DOI] [PubMed] [Google Scholar]
- 16.Fletcher, D. A., R. F. McMeeking, and D. Parkin. 1996. The United Kingdom chemical database. J. Chem. Infect. Comput. Sci. 36:746. [Google Scholar]
- 17.Gilchrist, T., D. M. Healy, and C. Drake. 1991. Controlled silver-releasing polymers and their potential for urinary-tract infection control. Biomaterials 12:76-78. [DOI] [PubMed] [Google Scholar]
- 18.Gotz, F. 2002. Staphylococcus and biofilms. Mol. Microbiol. 43:1367-1378. [DOI] [PubMed] [Google Scholar]
- 19.Hope, C. K., D. Clements, and M. Wilson. 2002. Determining the spatial distribution of viable and nonviable bacteria in hydrated microcosm dental plaques by viability profiling. J. Appl. Microbiol. 93:448-455. [DOI] [PubMed] [Google Scholar]
- 20.Hope, C. K., and M. Wilson. 2004. Analysis of the effects of chlorhexidine on oral biofilm vitality and structure based on viability profiling and an indicator of membrane integrity. Antimicrob. Agents Chemother. 48:1461-1468. [DOI] [PMC free article] [PubMed] [Google Scholar]
- 21.Hope, C. K., and M. Wilson. 2006. Biofilm structure and cell vitality in a laboratory model of subgingival plaque. J. Microbiol. Methods 66:390-398. [DOI] [PubMed] [Google Scholar]
- 22.Hope, C. K., and M. Wilson. 2003. Measuring the thickness of an outer layer of viable bacteria in an oral biofilm by viability mapping. J. Microbiol. Methods 54:403-410. [DOI] [PubMed] [Google Scholar]
- 23.Kim, T. N., Q. L. Feng, J. O. Kim, J. Wu, H. Wang, G. C. Chen, and F. Z. Cui. 1998. Antimicrobial effects of metal ions (Ag+, Cu2+, Zn2+) in hydroxyapatite. J. Mater. Sci. Mater. Med. 9:129-134. [DOI] [PubMed] [Google Scholar]
- 24.Klasen, H. J. 2000. A historical review of the use of silver in the treatment of burns. II. Renewed interest for silver. Burns 26:131-138. [DOI] [PubMed] [Google Scholar]
- 25.Knowles, J. C. 2003. Phosphate based glasses for biomedical applications. J. Mater. Chem. 13:2395-2401. [Google Scholar]
- 26.Mackenzie, K. J. D., and M. E. Smith. 2002. Multinuclear solid state NMR of inorganic materials. Pergamon Press, Oxford, United Kingdom.
- 27.Mayberry-Carson, K. J., B. Tober-Meyer, J. K. Smith, D. W. Lambe, Jr., and J. W. Costerton. 1984. Bacterial adherence and glycocalyx formation in osteomyelitis experimentally induced with Staphylococcus aureus. Infect. Immun. 43:825-833. [DOI] [PMC free article] [PubMed] [Google Scholar]
- 28.McKeown, D. A., H. Gan, and I. L. Pegg. 2005. Silver valence and local environments in borosilicate and calcium aluminoborate waste glasses as determined from X-ray absorption spectroscopy. J. Non-Crystal. Solids 351:3826-3833. [Google Scholar]
- 29.Mulligan, A. M., M. Wilson, and J. C. Knowles. 2003. The effect of increasing copper content in phosphate-based glasses on biofilms of Streptococcus sanguis. Biomaterials 24:1797-1807. [DOI] [PubMed] [Google Scholar]
- 30.Mulligan, A. M., M. Wilson, and J. C. Knowles. 2003. Effect of increasing silver content in phosphate-based glasses on biofilms of Streptococcus sanguis. J. Biomed. Mater. Res. A 67A:401-412. [DOI] [PubMed] [Google Scholar]
- 31.Oie, S., Y. Huang, A. Kamiya, H. Konishi, and T. T. Nakazawa. 1996. Efficacy of disinfectants against biofilm cells of methicillin-resistant Staphylococcus aureus. Microbios 85:223-230. [PubMed] [Google Scholar]
- 32.Pruitt, B. A., Jr., A. T. McManus, S. H. Kim, and C. W. Goodwin. 1998. Burn wound infections: current status. World J. Surg. 22:135-145. [DOI] [PubMed] [Google Scholar]
- 33.Saravanapavan, P., J. E. Gough, J. R. Jones, and L. L. Hench. 2004. Antimicrobial macroporous gel-glasses: dissolution and cytotoxicity. Key Eng. Mater. 254-256:1087-1090. [Google Scholar]
- 34.Sauer, K., A. K. Camper, G. D. Ehrlich, J. W. Costerton, and D. G. Davies. 2002. Pseudomonas aeruginosa displays multiple phenotypes during development as a biofilm. J. Bacteriol. 184:1140-1154. [DOI] [PMC free article] [PubMed] [Google Scholar]
- 35.Schierholz, J. M., J. Beuth, and G. Pulverer. 1999. Silver-containing polymers. J. Antimicrob. Chemother. 43:2819-2821. [DOI] [PMC free article] [PubMed] [Google Scholar]
- 36.Schierholz, J. M., L. J. Lucas, A. Rump, and G. Pulverer. 1998. Efficacy of silver-coated medical devices. J. Hosp. Infect. 40:257-262. [DOI] [PubMed] [Google Scholar]
- 37.Shiau, A. L., and C. L. Wu. 1998. The inhibitory effect of Staphylococcus epidermidis slime on the phagocytosis of murine peritoneal macrophages is interferon-independent. Microbiol. Immunol. 42:33-40. [DOI] [PubMed] [Google Scholar]
- 38.Shirtliff, M. E., J. T. Mader, and A. K. Camper. 2002. Molecular interactions in biofilms. Chem. Biol. 9:859-871. [DOI] [PubMed] [Google Scholar]
- 39.Sutherland, I. 2001. Biofilm exopolysaccharides: a strong and sticky framework. Microbiology 147:3-9. [DOI] [PubMed] [Google Scholar]
- 40.Uo, M., M. Mizuno, Y. Kuboki, A. Makishima, and F. Watari. 1998. Properties and cytotoxicity of water soluble Na2O-CaO-P2O5 glasses. Biomaterials 19:2277-2284. [DOI] [PubMed] [Google Scholar]
- 41.Yarwood, J. M., D. J. Bartels, E. M. Volper, and E. P. Greenberg. 2004. Quorum sensing in Staphylococcus aureus biofilms. J. Bacteriol. 186:1838-1850. [DOI] [PMC free article] [PubMed] [Google Scholar]


