Abstract
Bacteriophage infection in dairy fermentation constitutes a serious problem worldwide. We have studied bacteriophage infection in Lactococcus lactis by using the flow cytometer. The first effect of the infection of the bacterium is a change from cells in chains toward single cells. We interpret this change as a consequence of a cease in cell growth, while the ongoing cell divisions leave the cells as single cells. Late in the infection cycle, cells with low-density cell walls appear, and these cells can be detected on cytograms of light scatter versus, for instance, fluorescence of stained DNA. We describe a new method for detection of phage infection in Lactococcus lactis dairy cultures. The method is based on flow cytometric detection of cells with low-density cell walls. The method allows fast and early detection of phage-infected bacteria, independently of which phage has infected the culture. The method can be performed in real time and therefore increases the chance of successful intervention in the fermentation process.
Lactic acid bacteria are used extensively in the manufacture of a broad range of fermented dairy products. In many of these applications, infection of the cultures by virulent bacteriophages is a problem leading to either complete loss of the fermentation batch or, if only one out of several strains is affected, an altered flavor (3). Prevention of phage infections has therefore received a lot of attention over the past decades, and several strategies have been employed: pure cultures have been employed, and phage-resistant starter strains have been developed (3, 11). Detailed plans for rotational changes of phage-resistant starter cultures have been worked out (23) to suppress the propagation of phage mutants that have overcome the resistance mechanism of the bacterial strains.
Although these strategies have had success in preventing phage infections, they cannot completely prevent bacteriophage attack and they may limit the number and diversity of dairy starter cultures available for production, which may in turn limit the diversity of cheese flavors (11).
Some work has also been carried out to develop methods that would detect phage infection at a sufficiently early stage for an operator to interfere with the process. The lactococcal phages have recently been separated into 10 species (4). Labrie and Moineau developed a method based on a PCR technique for detection of infection by the three common phage species in dairy plants, the 936, c2, and P335 species, out of the known lactococcal phage species (12). This method is now mainly used for phage identification (4). They used three sets of primers, one for each species, designed on the basis of conserved regions of their genomes, and the detection limits were from 104 to 107 PFU/ml for different members of the three species (12). This method was later improved (4) or refined to detect single species of 936 phages (5). A problem with a PCR-based analysis, however, is that it only detects the phages that are already known. In addition, it takes hours to complete the analysis, and with the fast replication cycle of most bacteriophages, the fermentation batch will be destroyed before the results of the analysis are ready.
Here we describe a new method for monitoring the fermentation process by flow cytometric analysis using Lactococcus lactis. The method allows for fast and early detection of phage-infected bacteria independently of which phage has infected the culture. The flow cytometric analysis can, in contrast to the method of Labrie and Moineau (12), be performed in real time and should allow an operator to interfere with the fermentation process.
MATERIALS AND METHODS
Strains and bacteriophages.
The strains used were the two laboratory strains Lactococcus lactis subsp. cremoris MG1363 (7) and Lactococcus lactis subsp. lactis IL-1403 (2) and the dairy strain Lactococcus lactis subsp. cremoris W34 (9). For growth in skimmed milk-enriched M17, strain CS1353, a derivative of MG1363 with a plasmid from L. lactis CHCC373 (19) that carries a lactose operon, was used.
The bacteriophages were one c2, type c2 (20), seven 936 type P008 (15), jw1, jw9A and jw9B (9), and jw30, jw31, and jw32 (10), and one P335 type, jw16B (9).
Media and growth conditions.
The media used were M17 (24) with 0.5% glucose (GM17) and M17 with 10% skimmed milk. For infection studies in GM17, 5 mM CaCl2 was added. All growth experiments were done at 30°C.
We calculated the specific multiplication rate (μ) for phage multiplication in analogy with the specific growth rate by using the following equation: μ = ln(PFU/PFU0)/t, where PFU0 is the PFU at time zero and t is the time. From this equation the following equation can be derived: latent time = ln(burst size)/μ. This equation was used to calculate the latent time.
Single cells.
To obtain single cells, chains were broken by vigorous shaking in a Bio 101 Savant FastPrep FP 120 bead beater (Savant, Farmingdale, NY) for 45 seconds at speed 6.5. The increase in CFU after shaking was up to 50% dependent on the condition of growth. The settings were optimized for the highest number of CFU. This setting was used for all cultures.
Flow cytometric analysis.
The flow cytometric analysis was performed on a Bryte (Bio-Rad) flow cytometer. The samples were either fixed in 70% ethanol and stained with mitramycin and ethidium bromide, 90 and 20 μg/ml, respectively, in 10 mM Tris pH 7.4 to 7.5 and 10 mM MgCl2 (14) (excited at 395 to 440 nm and read at 590 to 720 nm) or stained in vivo with Hoechst 33342, 0.5 μg/ml, for 1 min directly in the medium (excited at 350 to 425 and read at 450 to 490 nm). Samples from skimmed milk-enriched M17 were cleared with 1 M polyphosphate before flow cytometric analysis.
RESULTS
Flow cytometry of Lactococcus lactis.
Flow cytometry of lactococcal strains is complicated by the fact that these bacteria often grow in chains, which give a very broad distribution as seen in the flow cytogram in Fig. 1a. We found that this could be almost completely overcome by vigorous shaking of the cultures before analysis. The treatment effectively broke the chains, and more than 70% of the cells were present afterwards as single cells (Fig. 1b). Note that the light scatter of the peak in Fig. 1b is close to the low value of the broad distribution in Fig. 1a.
FIG. 1.
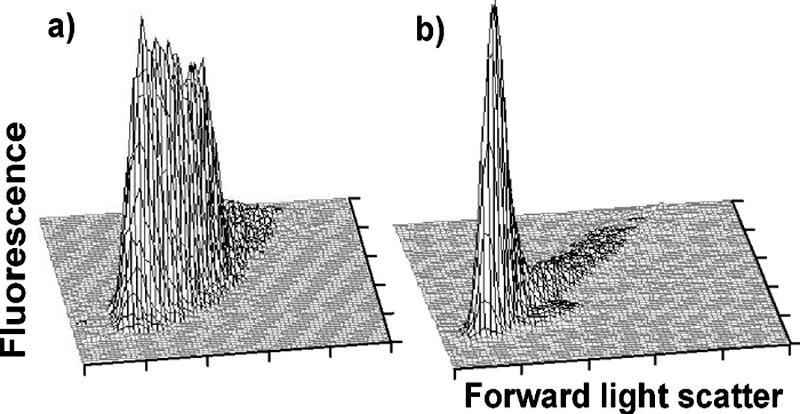
MG1363 cells growing in GM17 were either analyzed directly in the flow cytometer (a) or vigorously shaken in a FastPrep before analysis (b). Fluorescence was used to monitor the DNA content, and light scatter was used to monitor the size of the cells.
Flow cytometry of phage-infected Lactococcus lactis cells.
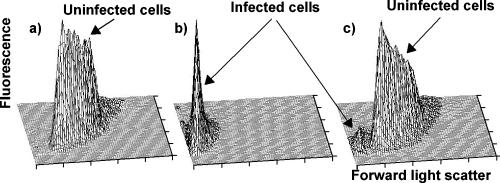
Initially, we studied bacteriophage infection of L. lactis with the flow cytometer by using a culture of exponentially growing L. lactis subsp. cremoris MG1363 cells in GM17 medium at 30°C with a generation time of 33 min (average ± standard deviation, 33 ± 2 min). The culture was infected with 3 × 10³ phage/ml of lactococcal bacteriophage c2 at a multiplicity of infection of 10−4 (Fig. 2). Samples were then withdrawn at various times after infection for PFU determination, optical density (OD) measurement, and flow cytometric analysis without shaking. The specific multiplication rate of the phage was calculated to 0.10 min−1, consistent with a burst size of 20 phage per cell (average, 40 ± 18) and a latent time of 29 min (average, 31 ± 2.6). After infection, exponential growth continued for five generations. After a period of approximately one generation in stationary phase, lysis of the culture was dominant (period of lysis, see Fig. 2 and 3). The samples for flow cytometry were stained for DNA, and fluorescence from the DNA staining and forward light scatter (as a measure of cell size and refractive index) and sideward light scatter (to which internal granularity and surface roughness also contribute [22]) were recorded. Light scatter is thus primarily a measure of mass. Flow cytometry of samples withdrawn before infection showed that these cells mainly were present in short chains. The cytograms with fluorescence versus both forward and sideward light scatter showed a broad area of cells, well separated from the zero values, with a short tail of cells in chains toward higher values of light scatter and fluorescence (Fig. 3a). Flow cytometry of samples from the lysis period (Fig. 2), at which point all cells have been infected, showed that almost all cells were present as single cells (Fig. 3b). Furthermore, both their forward and sideward light scatter were reduced significantly to 30 to 50% of the light scatter of the normal cells (Fig. 3b). When uninfected cells were mixed with cells from the lysis phase and run through the flow cytometer, the infected cells were clearly separated from the uninfected cells (Fig. 3c). Phase-contrast microscopy of normal uninfected cells and cells from the lysis phase showed that the latter cells had lost perceptible amounts of contrast (Fig. 4a and b), which is a measure of the mass of the object. This was more clearly illustrated by the microscopic analysis of a mixture of both types of cells, in which the contrast of infected cells was clearly reduced (Fig. 4c). The light scatter of the flow cytometer and the contrast of the phase-contrast microscope are both primary measures of the mass of the object. So, both the appearance of low-light-scatter cells and the appearance of low-contrast cells are strong indications of loss of mass from the cells. The appearance of low-mass cells suggests that the intracellular replication of the bacteriophage had a visible effect on the cell wall of the cells during infection, because the cell wall constitutes a major part of the mass of gram-positive bacteria and because these low-mass objects still contained DNA, which means that they were not lysed.
FIG. 2.
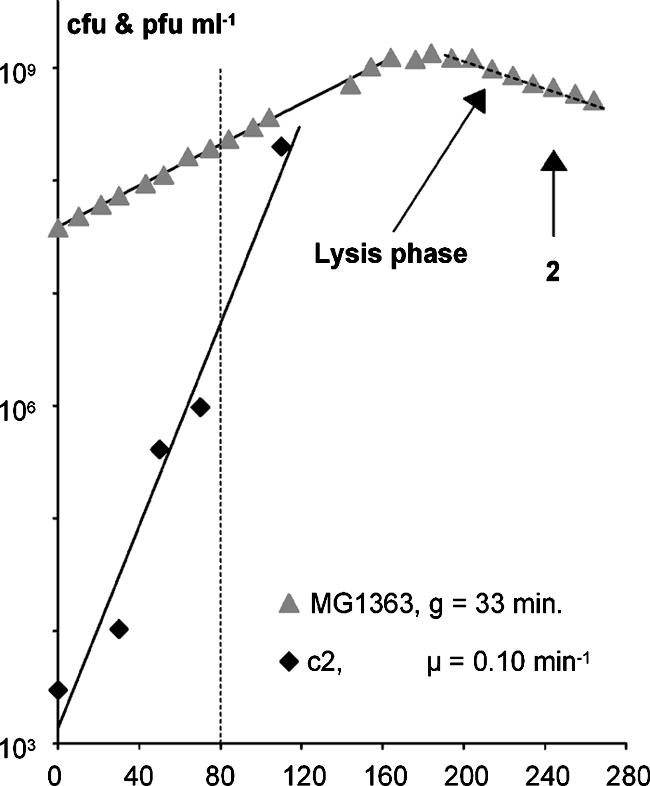
MG1363 growing in GM17 supplemented with 5 mM CaCl2 was infected with 3 × 10³ c2 phage per ml at time zero. Samples were withdrawn at different times for OD measurement, PFU, and flow cytometric analysis. The cells per ml were calculated from the OD measurements, using the factor 4.8 × 10⁸ cells per ml at an OD450 of 1. The vertical dashed line at 80 min indicates the time for the first sign of infection seen in the flow cytometer. The time for sample 2 in Fig. 3, below, is indicated by a “2.”
FIG. 3.
MG1363 was grown in GM17 with 5 mM CaCl2. The culture was infected with 3 × 10³ phage/ml of phage c2 at a multiplicity of infection of 10−4. Samples are from the culture shown in Fig. 2. (a) Sample 1, taken before infection. (b) Sample 2, from the period of lysis of the culture (4 h after addition of phage). (c) A mixture of samples 1 (95%) and 2 (5%).
FIG. 4.
Microscopic photographs of the same samples as in Fig. 3, with the exception that the mixture in panel C was a 1:1 mixture of samples 1 and 2. The lysis phase is indicated in Fig. 2.
Eighty minutes after infection, infected cells were observable in the infected cells' area on the cytogram in Fig. 5. The subpopulation of infected cells was visible in cytograms showing fluorescence versus both forward and sideward light scatter but was clearest in the sideward light scatter plots. This was at 80 min, or more than two generation times before any sign of lysis was visible on the growth curve (Fig. 2).
FIG. 5.
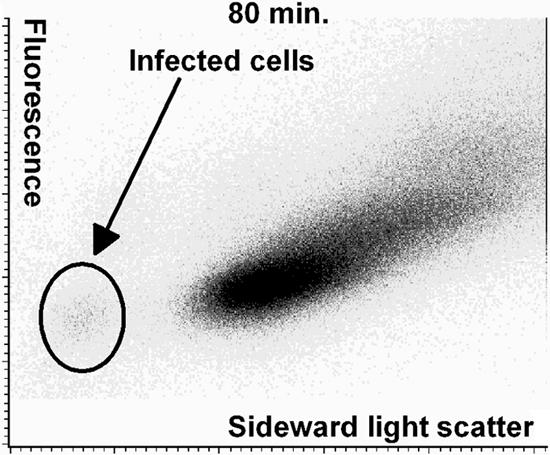
Cytogram of the first sample from the experiment shown in Fig. 2 of MG1363 cells infected with phage c2 and showing signs of infection. This sample was taken 80 min after the beginning of the infection. The cytogram shows fluorescence (DNA stain) versus sideward light scatter (size and roughness).
The subpopulation of infected cells (Fig. 5) constituted 2% of total measured objects. From OD measurements, it can be estimated that the number of cells was 2 × 10⁸ per ml, and from the plaque counts, the number of infectious units can be estimated to be from 5 × 10⁶ to 107 per ml. The range in the estimation of infectious units is to some extent due to the stepwise increase in phage number induced by the infection two to three latent periods earlier. The ratio between infectious units and cells can therefore be estimated to be between 0.025 and 0.05. This indicates that 2.5 to 5% of the cells were infected at 80 min. When compared to the 2% of infected cells found by flow cytometry, it can then be concluded that in this experiment between 40% and 80% of infectious units were spotted as infected cells.
Phage infection in Lactococcus lactis subsp. lactis.
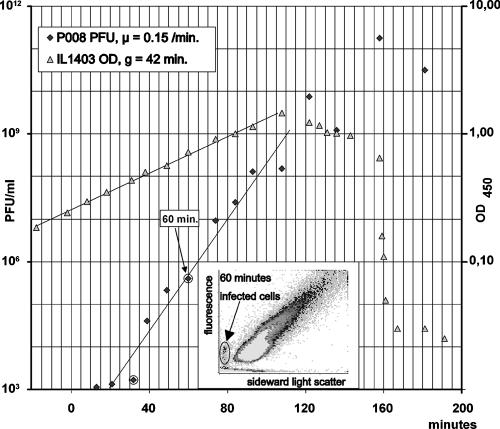
A culture of Lactococcus lactis subsp. lactis IL-1403 (average generation time in GM17 at 30°C, 53 ± 5 min) was infected with 103 P008 phage per ml at a multiplicity of infection of 10−5. Samples were withdrawn at various times for plaque count, OD measurement, and flow cytometric analysis. Plots of the temporal development of the number of phage and the OD at 450 nm (OD450) of the culture are shown in Fig. 6. The multiplication rate of this phage was very fast (0.15 min−1). In Fig. 6, the synchrony in phage development is visible, with the first burst at 36 min and the second around 70 min. From the ratio between the phage counts at 32 and 60 min, the burst size was calculated to be 240 phage per infected bacterium (in other experiments, the burst size of this phage was 53 ± 1) and the latent time was 36 min, in agreement with what is seen in Fig. 6. The first sign of infection was seen in the cytogram of the sample from 60 min, which was late in the second infection cycle (Fig. 6). After shaking of the samples, we determined the CFU per OD450 to be 4.2 × 10⁸ cells/ml. From this, the cell density at 60 min was calculated to be 3.0 × 10⁸ cells/ml. At the same time point, the number of infectious units per ml was 4 × 10⁵, which gave a ratio of infectious units to bacteria of 0.0013 at the time of detection, equal to 0.13% of infected cells to total cells in the culture. Similarly, there were approximately 300 recorded cells in the infected cells' area in the cytogram in Fig. 6 out of a total of 1.5 × 10⁵ recorded particles (cells and chains). This corresponds to 0.2% infected cells, which is close to that found from the PFU count. The difference in the two numbers was probably due to differences in the handling of the samples: the samples for plate counts were shaken before plating, while the samples for flow cytometry were analyzed directly.
FIG. 6.
A culture of IL-1403 was infected with phage P008 at time zero, and samples for OD measurements, PFU, and flow cytometric analysis were withdrawn at different times. The first sign of infection was detected in the sample from 60 min (encircled point on the graph), as seen on the inserted flow cytogram.
Detection of other lactococcal phages.
To test whether the method could also be applied to the detection of other bacteriophages, we tried with a series of phages from the collection of Josephsen et al. (9, 10). The tested phages were jw1, jw9A, jw9B, jw16B, jw30, jw31, and jw32. The experiments were conducted as described above, except that L. lactis subsp. cremoris W34 was used as host and the infecting phages were divided into four portions, which were added to the cultures with 5-minute intervals to better imitate the asynchrony of a normal phage infection. The results with these phages were very similar to those obtained with phages c2 and MG1363 (except for phage jw16B). Figure 7 shows representative results with one of these phages, phage jw1. The two strains were different in that W34 produced longer chains than MG1363 (Fig. 7a). Interestingly, these experiments revealed that the first observable effect of phage infection in the flow cytometer was the occurrence of single cells (Fig. 7c). This effect was seen after the first cells with low light scatter appeared (Fig. 7b), because the small numbers of infected single cells early in the infection were outnumbered by the noninfected cells. Later during infection, the proportion of single cells continued to increase, while the low-contrast cells remained at approximately 4% to 5% of the total number of cells (Fig. 5d). Not until the infection had affected the growth rates was it possible to see an increase in the relative number of cells with low light scatter. This implies that even though low-light-scatter cells were the first discernible sign of infection, these cells were from a late phase of the infection process, where the cells had lost contrast. The change toward single cells may therefore precede the change to low-light-scatter cells.
FIG. 7.

Flow cytograms of infection of strain W34 with phage jw1. (a) Cells before infection; (b) the first sample where the cells with low light scatter could be seen; (c) the sample taken just before the OD curve was affected; (d) a sample from the period where the culture lysed. The cytograms are shown as contour plots. In panels b and c, the sensitivity has been set to display the infected cells, which results in empty space in the high-number areas.
Another interesting observation came from the experiments with phage jw16B, which, unlike the other phages, caused a gradual loss of DNA (Fig. 8), indicating that this phage degraded the host DNA during infection. In Fig. 8 it can be seen that the OD curve from this infection was different from that observed with the other phages (see Fig. 7 for a representative OD curve for infection with other phages). After the curve was affected, the OD increased very slowly for more than 2 h, in contrast to the rapid decrease seen in Fig. 7. The samples from this period showed a gradual loss of fluorescent stain, strongly indicating that these cells were losing DNA. Interestingly, the same shift toward single cells as observed in the other infection was also seen with this phage, while the appearance of cells with low light scatter was hampered by the loss of stainable DNA. Only one other Lactococcal phage, phage c6A (21), has previously been reported to degrade host DNA.
FIG. 8.

Cytograms of samples from infection of strain W34 with phage jw16B. Times after infection are indicated on the panels. (a) Sample of uninfected cells; (b to d) samples of cells from the period where the growth curve was affected, as indicated in the top graph.
Detection of infected cells in skimmed milk samples.
The experiments presented above were all done in standard laboratory media. However, for the method developed here to be useful for phage detection in dairies, it should be applicable to samples withdrawn from milk fermentation. To test this, the lactose-fermenting strain CS1353, a derivative of MG1363, was grown in a mixture of M17 and skimmed milk. The culture was then infected with phage c2, and a sample of uninfected cells was mixed with cells from the lysis period, cleared with polyphosphate, stained, and run through the flow cytometer. The cytogram of sideward scatter versus fluorescence showed that the infected cells were clearly visible and separated from the uninfected cells (Fig. 9).
FIG. 9.
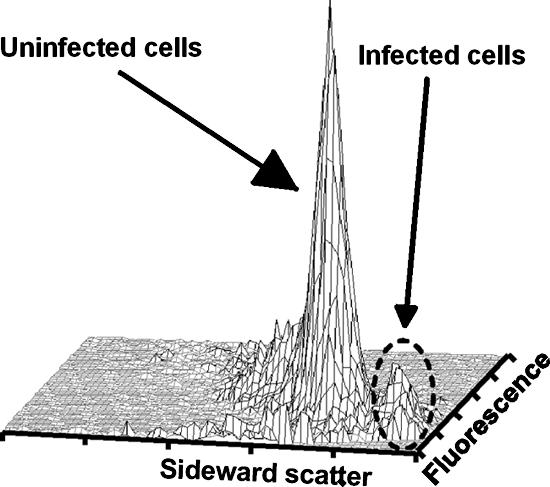
A mixture of cells from a culture of MG1363 in M17 plus 10% skimmed milk and cells from the same culture in the lysis phase after infection with phage c2 (10:1).
DISCUSSION
In the reported infections with phage c2 and phage P008, we have found burst sizes different from what we found previously. For phage c2, the burst size was about half of the average. We cannot explain this difference, but as the purpose of this paper was to report morphological changes during phage infection, we chose to show those experiments that suited that purpose. Burst sizes reported in the literature for c2 are in the range from 50 to 161, depending on which host is used, but also, for the same host differences are found. With MG1614, burst sizes of 75 (18) and 161 (6) have been reported, and with LMO230 burst sizes of 50 (16) and 91 (13) have been reported. Burst sizes may vary with growth condition of the host. Hadas et al. (8) have found latent times from 18 to 37 min and burst sizes from 12 to 152 at 37°C for bacteriophage T4 on E. coli B/r, depending on the growth medium. For phage P008, we also had a discrepancy in burst size in the reported experiment with those found earlier. This time we found an increase from 53 to 240. Müller-Merbach et al. (17) have recently shown that P008 has burst sizes from 7 to 22, depending on the growth condition for host L. lactis subsp. lactis bv. diacetylactis F7/2. It has been reported that phages might change burst size during cultivation (10), most likely due to selection for higher burst size during the cultivation.
In this work, we have analyzed phage infection of L. lactis subsp. cremoris and L. lactis subsp. lactis by using flow cytometry. The flow cytometer was shown to be an excellent instrument for studying phage infection of lactococcal bacteria, and the early signs of infection, which were not observable in other ways, could be clearly seen with the flow cytometer. We found that the first effect of a phage infection on a bacterial culture was the appearance of single cells. Our interpretation here is that the first effect of a phage infection on the bacteria is that cell growth ceases while divisions continue, causing the typical lactococcal chains to be broken up and the cells to end up as single cells. This interpretation is based on the following observations: (i) lactococcal chains are short, with two to four cells, and (ii) the chain lengths change with growth rate, with slow-growing cultures containing single cells and cells that are dividing. We interpret these simple observations to mean that the chains are a result of slow cell separation. Later during infection, it was found that lysin from the phage degraded the cell wall to such an extent that the light scatter of the cells changed dramatically to 30% to 50% of that of normal cells. This reduction in the cell wall density could be similar to an effect reported by Bidnenko et al. (1), who found that fluorescence in situ hybridization (FISH) staining with probes labeled with horseradish peroxidase requires permeabilization of L. lactis, in contrast to probes labeled with the much smaller fluorescein. They also showed that FISH staining with horseradish peroxidase-labeled probes is most effective 10 min before lysis of cultures of IL-1403 infected with phage bIL66 and phage c2 and of cultures of NCDO712 infected with phage μT712. The lysin from phage c2 attacks the glycosidic bonds of peptidoglycan, while the lysin from bIL66 is an amidase that attacks the peptide bonds (1). Both types of lysin were thus effective in degradation of the cell wall, which was necessary for the enhancement of FISH staining.
The fact that cells had either low or high light scatter (Fig. 5) and that we found very few cells with intermediary light scatter indicates that the transition from high- to low-light-scatter cells was very fast. The level of low-light-scatter cells increased gradually until it reached approximately 4% of total cells; this level then remained almost constant until all remaining cells were infected. This result indicates that the phase with low light scatter during infection was relatively short and that these cells lysed shortly after the cell wall had been degraded, which is in good agreement with the finding of Bidnenko et al. (1).
In this study, we also found a phage, jw16B, that degraded host DNA but otherwise behaved similarly to the other phages. The early detection of cells infected with jw16B cannot be done on the basis of low-density cells, but detection would still be possible from the shift in cell morphology. However, out of all the lactococcal phages studied so far, only one phage has previously been reported to degrade the host DNA (phage c6A) (21). Of the sequenced lactococcal phages, none with a DNase gene has turned up (K. Hammer, personal communication), which again indicates that lactococcal phages that degrade host DNA are rare.
In the experiment with phage P008 infection of IL-1403, we detected the first sign of infection 60 min after the phage was added to the culture. At this time, the number of infectious units per ml was 4 × 10⁵, compared to a sensitivity of 104 to 107 infectious units per ml by the method of Labrie and Moineau (12). The sensitivity of the method described here is thus comparable to that of Labrie and Moineau. The sample at 60 min was taken late in the second infection cycle, around the time at which Bidnenko et al. found that the permeability of the cells was suitable for FISH staining with horseradish peroxidase-labeled probes. From the cytogram of the sample from 60 min (Fig. 6), we found 0.2% infected cells, which was in good agreement with the ratio of 0.13% found from direct counting of phage and measurement of the OD450. It is also compatible with the time of sampling being late in the second infection cycle, at which most of the infected bacteria should have partially degraded cell walls. The difference between the two estimates might be ascribed to the fact that the cell number was based on colony counts after the samples had been vigorously shaken, which increased the number of CFU significantly.
The detection of phage-infected bacteria described here might also be possible in mixed cultures, as the detection is independent of phage and strain. With mixed cultures the normal sign of phage infection, reduction in acidification rate, might not be seen, as the nonaffected strains in the culture might take over. The only thing that is needed for detection is the cells with low mass (low contrast, low light scatter) that are found late in the lytic cycle. We have shown that these cells can be detected when they are present as 0.2% of the total cells. Cells with low mass are present at approximately 20% of the lytic cycle; this means that detection is possible when 1 to 2% of the cells are infected, independent of the number of strains in the starter culture.
The difference between the sensitivity found in the experiment with phage P008 infecting IL-1403 and the experiment with phage c2 infecting MG1363 can be ascribed to the less frequent sampling in the latter experiment. If in vivo staining with Hoechst 33342 were combined with frequent sampling, e.g., via an online sampling setup, then the accumulation of low-scatter cells in the cytograms would be detected early in an infection.
We conclude that bacteriophage infection of L. lactis in the dairy industry can be detected fast and efficiently by flow cytometric analysis if particles, such as eukaryotic cells and larger fat particles that would block the flow cytometer, were removed.
Acknowledgments
The present work was supported by the Danish Dairy Research Foundation.
We thank Karin Hammer and Finn Vogensen for valuable discussions.
Footnotes
Published ahead of print on 5 October 2007.
REFERENCES
- 1.Bidnenko, E., C. Mercier, J. Tremblay, P. Tailliez, and S. Kulakauskas. 1998. Estimation of the state of the bacterial cell wall by fluorescent in situ hybridization. Appl. Environ. Microbiol. 64:3059-3062. [DOI] [PMC free article] [PubMed] [Google Scholar]
- 2.Chopin, A., M. C. Chopin, A. Moillo-Batt, and P. Langella. 1984. Two plasmid-determined restriction and modification systems in Streptococcus lactis. Plasmid 11:260-263. [DOI] [PubMed] [Google Scholar]
- 3.Coffey, A., and R. P. Ross. 2002. Bacteriophage-resistance systems in dairy starter strains: molecular analysis to application. Antonie Leeuwenhoek 82:303-321. [PubMed] [Google Scholar]
- 4.Deveau, H., S. J. Labrie, M. C. Chopin, and S. Moineau. 2006. Biodiversity and classification of lactococcal phages. Appl. Environ. Microbiol. 72:4338-4346. [DOI] [PMC free article] [PubMed] [Google Scholar]
- 5.Dupont, K., F. K. Vogensen, and J. Josephsen. 2005. Detection of lactococcal 936-species bacteriophages in whey by magnetic capture hybridization PCR targeting a variable region of receptor-binding protein genes. J. Appl. Microbiol. 98:1001-1009. [DOI] [PubMed] [Google Scholar]
- 6.Garvey, P., C. Hill, and G. F. Fitzgerald. 1996. The lactococcal plasmid pNP40 encodes a third bacteriophage resistance mechanism, one which affects phage DNA penetration. Appl. Environ. Microbiol. 62:676-679. [DOI] [PMC free article] [PubMed] [Google Scholar]
- 7.Gasson, M. J. 1983. Plasmid complements of Streptococcus lactis NCDO 712 and other lactic streptococci after protoplast-induced curing. J. Bacteriol. 154:1-9. [DOI] [PMC free article] [PubMed] [Google Scholar]
- 8.Hadas, H., M. Einav, I. Fishov, and A. Zaritsky. 1997. Bacteriophage T4 development depends on the physiology of its host Escherichia coli. Microbiology 143:179-185. [DOI] [PubMed] [Google Scholar]
- 9.Josephsen, J., N. Andersenn, H. Berndt, E. Brandsborg, G. Christiansen, Hansen. M. B., S. Hansen, E. W. Nielsen, and F. K. Vogensen. 1994. An ecological study of lytic bacteriophages of Lactococcus lactis subsp. cremoris isolated in a cheese plant over a five year period. Int. Dairy J. 4:123-140. [Google Scholar]
- 10.Josephsen, J., A. Petersen, H. Neve, and E. W. Nielsen. 1999. Development of lytic Lactococcus lactis bacteriophages in a cheddar cheese plant. Int. J. Food Microbiol. 50:163-171. [Google Scholar]
- 11.Klaenhammer, T. R., and G. F. Fitzgerald. 1994. Bacteriophages and bacteriophage resistance, p. 106-168. In M. J. Gasson and W. M. de Vos (ed.), Genetics and biotechnology of lactic acid bacteria. Chapman and Hall, London, England.
- 12.Labrie, S., and S. Moineau. 2000. Multiplex PCR for detection and identification of lactococcal bacteriophages. Appl. Environ. Microbiol. 66:987-994. [DOI] [PMC free article] [PubMed] [Google Scholar]
- 13.Laible, N. J., P. L. Rule, S. K. Harlander, and L. L. McKay. 1987. Identification and cloning of plasmid deoxyribonucleic-acid coding for abortive phage infection from Streptococcus lactis ssp. diacetylactis Kr2. J. Dairy Sci. 70:2211-2219. [Google Scholar]
- 14.Lobner-Olesen, A., K. Skarstad, F. G. Hansen, K. von Meyenburg, and E. Boye. 1989. The DnaA protein determines the initiation mass of Escherichia coli K-12. Cell 57:881-889. [DOI] [PubMed] [Google Scholar]
- 15.Loof, M., and M. Teuber. 1986. Heteroduplex analysis of the genomes of Streptococcus lactis subsp. diacetylactis bacteriophages of the P008-type isolated from German cheese factories. Syst. Appl. Microbiol. 8:226-229. [DOI] [PubMed] [Google Scholar]
- 16.McLandsborough, L. A., K. M. Kolaetis, T. Requena, and L. L. McKay. 1995. Cloning and characterization of the abortive infection genetic determinant abiD isolated from pBF61 of Lactococcus lactis subsp. lactis KR5. Appl. Environ. Microbiol. 61:2023-2026. [DOI] [PMC free article] [PubMed] [Google Scholar]
- 17.Müller-Merbach, M., K. Kohler, and J. Hinrichs. 2007. Environmental factors for phage-induced fermentation problems: replication and adsorption of the Lactococcus lactis phage P008 as influenced by temperature and pH. Food Microbiol. 24:695-702. [DOI] [PubMed] [Google Scholar]
- 18.Murphy, M. C., J. L. Steele, C. Daly, and L. L. McKay. 1988. Concomitant conjugal transfer of reduced-bacteriophage-sensitivity mechanisms with lactose- and sucrose-fermenting ability in lactic streptococci. Appl. Environ. Microbiol. 54:1951-1956. [DOI] [PMC free article] [PubMed] [Google Scholar]
- 19.Pedersen, M. B., P. R. Jensen, T. Janzen, and D. Nilsson. 2002. Bacteriophage resistance of a ΔthyA mutant of Lactococcus lactis blocked in DNA replication. Appl. Environ. Microbiol. 68:3010-3023. [DOI] [PMC free article] [PubMed] [Google Scholar]
- 20.Pillidge, C. J., and A. W. Jarvis. 1988. DNA restriction maps and classification of the lactococcal bacteriophages c2 and sk1. N. Z. J. Dairy Sci. Technol. 23:411-416. [Google Scholar]
- 21.Powell, I. B., D. L. Tulloch, A. J. Hillier, and B. E. Davidson. 1992. Phage DNA synthesis and host DNA degradation in the life cycle of Lactococcus lactis bacteriophage c6A. J. Gen. Microbiol. 138:945-950. [DOI] [PubMed] [Google Scholar]
- 22.Shapiro, H. M. 2003. Practical flow cytometry. Wiley-Liss, New York, NY.
- 23.Sing, W. D., and T. R. Klaenhammer. 1993. A strategy for rotation of different bacteriophage defenses in a lactococcal single-strain starter culture system. Appl. Environ. Microbiol. 59:365-372. [DOI] [PMC free article] [PubMed] [Google Scholar]
- 24.Terzaghi, B. E., and W. E. Sandine. 1975. Improved medium for lactic streptococci and their bacteriophages. Appl. Microbiol. 29:807-813. [DOI] [PMC free article] [PubMed] [Google Scholar]


