

Abstract
Very little is known about the ability of the zooplankton grazer Daphnia pulicaria to reduce populations of Giardia lamblia cysts and Cryptosporidium parvum oocysts in surface waters. The potential for D. pulicaria to act as a biological filter of C. parvum and G. lamblia was tested under three grazing pressures (one, two, or four D. pulicaria grazers per 66 ml). (Oo)cysts (1 × 10⁴ per 66 ml) were added to each grazing bottle along with the algal food Selenastrum capricornutum (6.6 × 10⁴ cells per 66 ml) to stimulate normal grazing. Bottles were rotated (2 rpm) to prevent settling of (oo)cysts and algae for 24 h (a light:dark cycle of 16 h:8 h) at 20°C. The impact of D. pulicaria grazing on (oo)cysts was assessed by (i) (oo)cyst clearance rates, (ii) (oo)cyst viability, (iii) (oo)cyst excystation, and (iv) oocyst infectivity in cell culture. Two D. pulicaria grazers significantly decreased the total number of C. parvum oocysts by 52% and G. lamblia cysts by 44%. Furthermore, two D. pulicaria grazers significantly decreased C. parvum excystation and infectivity by 5% and 87%, respectively. Two D. pulicaria grazers significantly decreased the viability of G. lamblia cysts by 52%, but analysis of G. lamblia excystation was confounded by observed mechanical disruption of the cysts after grazing. No mechanical disruption of the C. parvum oocysts was observed, presumably due to their smaller size. The data provide strong evidence that zooplankton grazers have the potential to substantially decrease the population of infectious C. parvum and G. lamblia in freshwater ecosystems.
The obligate enteric protozoan parasites Cryptosporidium parvum and Giardia lamblia pose significant human health risks, with the most severe and potentially lethal cases of cryptosporidosis and giardiasis occurring in infants, the elderly, and the immunocompromised. Although Cryptosporidium was not recognized as a waterborne source of human disease until 1987 (12), cases of what is now known as cryptosporidiosis have been documented since 1976 (5). Cryptosporidiosis is most commonly acquired by fecal-oral transmission through contaminated water and food supplies. The largest outbreak of cryptosporidiosis linked to a municipal drinking water supply occurred in Milwaukee, Wisconsin, in 1993 and affected more than 403,000 people (5). Following parasite exposure, the incidence of cryptosporidiosis in the United States approaches 40% in at-risk populations (15) and an incidence of only 4 to 12% for giardiasis (19). While medical treatment has been previously limited to the alleviation of disease symptoms (i.e., diarrhea and dehydration), antiprotozoal treatments that are successful in ridding the body of Giardia are now available in developed countries (e.g., nitroimidazoles, with the most common being metronidazole) (7); these treatments are less successful for the eradication of Cryptosporidium. The risk of outbreaks and limited treatment options even in developed countries make it important to investigate natural control mechanisms for these parasites.
While the effects of some abiotic ecological determinants on protozoa in surface water systems have been identified (8, 9, 3, 4), very little work has addressed the biotic effects of cohabitating freshwater zooplankton as grazers of these pathogens. Prior studies have shown that protozoa can ingest human bacterial and protozoan pathogens, including Cryptosporidium (1, 16, 18). Stott et al. (16) report the ingestion of Cryptosporidium oocysts by ciliated protozoa, amoebas, and rotifers at concentrations of 186 oocysts in 4 μl. Small invertebrates belonging to the phylum Rotifera, which includes many zooplankton species, have also been shown by gut imaging to ingest G. lamblia cysts (18). However, essentially no information is available on the rate at which zooplankton can clear (oo)cysts from the surrounding water or whether feeding by zooplankton renders the (oo)cysts nonviable. While rotifers have been shown to ingest Cryptosporidium oocysts and Giardia cysts, they are generally selective feeders and not prone to ingesting particles larger than 9 μm (2). The effect of larger invertebrate crustaceans, such as Daphnia pulicaria organisms, which are highly efficient and nonselective filter feeders of particulates in the size range of both C. parvum (4 to 8 μm) and G. lamblia (7 to 14 μm), is unknown. Daphnia organisms are more intensive grazers than rotifers, are widespread and abundant in many surface waters, and have the potential as a community to filter the equivalent of the entire volume of a lake in a given day (6). While these traits imply that Daphnia could be a potentially significant natural control of C. parvum and G. lamblia, its role in the fate and transport of (oo)cysts has never been tested.
This study focuses on the direct effect of a zooplankton grazer on the density, viability, and infectivity of the protozoan pathogens C. parvum and G. lamblia. The potential for D. pulicaria to act as an effective natural biological filter of C. parvum and G. lamblia was tested in laboratory-based grazing experiments by estimating Daphnia clearance rates for the pathogens. Since ingestion alone may or may not destroy the (oo)cysts, pathogen integrity was also assessed here with 4′,6-diamidino-2-phenylindole (DAPI) and propidium iodide (PI) stains for viability, excystation bioassays, and (for Cryptosporidium only) oocyst infectivity in human cell culture.
MATERIALS AND METHODS
Daphnia culturing.
D. pulicaria (from Dutch Springs, Bethlehem, PA; 40°41′04.99"N, 75°21′16.26"W) was maintained in culture at 20°C on a light:dark cycle of 16 h:8 h for at least 3 months prior to these experiments and fed Selenastrum capricornutum (typical green algae used in Daphnia culturing) at a rate of 1,000 cells ml−1 every 2 days (high food density). D. pulicaria cultures were kept in synthetic freshwater (21) which was changed every 5 to 7 days, depending on the population density.
Pathogen maintenance.
C. parvum oocysts derived from mice (Iowa isolate, lot 060518) and G. lamblia cysts derived from gerbils (Human isolate H-3, lot 060328) were acquired live from Waterborne, Inc. (New Orleans, LA). (Oo)cysts were shipped within 48 h of being shed and stored in 1× Hanks balanced salt solution (HBSS), pH 7, at 4°C in the dark for less than 2 weeks prior to use in the grazing experiments.
Gut content analysis.
An (oo)cyst wall-specific antibody (MeriFluor; Meridian Scientific, Cincinnati, OH) was applied to C. parvum and G. lamblia prior to D. pulicaria grazing experiments to visualize grazed (oo)cysts within the D. pulicaria gut. Initial tests were conducted to ensure that the MeriFluor antibody did not cross-react with Selenastrum, and an attempt was made to stain Selenastrum cells directly. No fluorescence of Selenastrum, beyond the natural green coloring of the algal cells, was observed microscopically using a fluorescein isothiocyanate (FITC) filter cube (excitation, 420 to 490 nm; emission, 520 nm).
One drop of MeriFluor detection reagent was added to each 1-ml suspension of 1 × 10⁴ (oo)cysts in 1× HBSS (pH 7.0) and incubated at room temperature in the dark for 30 min. Following incubation, the entire suspension of stained (oo)cysts, along with 1 × 10⁵ Selenastrum cells (to induce grazing), were fed to 10 D. pulicaria organisms in 30 ml of synthetic freshwater. Images were acquired using an Olympus AX-70 Multimode Microscopy System (Center Valley, PA). Ingestion of the pathogens by D. pulicaria was observed by fluorescence microscopy using an FITC filter cube (Fig. 1A). The G. lamblia cyst damage following mechanical digestion by D. pulicaria was observed using phase-contrast microscopy (Fig. 1B).
FIG. 1.

(A) Gut content analysis. MeriFluor-stained C. parvum and G. lamblia observed in the gut tract of D. pulicaria. C. parvum oocysts (yellow circle) and G. lamblia cysts (blue circle) are identified by specific fluorescence. Note that the green appearance of the D. pulicaria body and gut is an artifact of the FITC microscopy and is not a cross-reaction with the MeriFluor antibody. (B) G. lamblia organisms were fed in moderate concentration to D. pulicaria for 2 h. The upper-left cyst is intact following the grazing period; the cyst on the bottom right sustained damage to the upper-left quadrant of the outer wall.
Grazing experiments.
Twelve hours prior to the grazing experiments, adult D. pulicaria organisms were isolated from culture, placed in synthetic freshwater (pH 7.6 to 7.8) in 66-ml Pyrex bottles, and starved to clear their guts. Five replicates of three grazing pressure treatments were established (one, two, or four D. pulicaria grazers per 66-ml bottle). An additional treatment (five replicates) with zero D. pulicaria organisms per bottle (zero-grazer sample) was established as the control. The bottles were stored under normal culture conditions (a light:dark cycle of 16 h:8 h at 20°C) prior to the experiment. C. parvum and G. lamblia were tested independently. At the start of each experiment, C. parvum oocysts or G. lamblia cysts were added to each bottle (seeding methods below) along with Selenastrum cells (1,000 cells ml−1) to stimulate grazing, and the bottles were filled to a total volume of 66 ml with synthetic freshwater. Structural differentiation of Selenastrum, C. parvum, and G. lamblia was observed using differential interference contrast ([DIC] Nomarski contrast) microscopy (Fig. 2).
FIG. 2.

DIC (Nomarski contrast) microscopy was used to observe the structural differentiation of the three food items used in this study: Selenastrum, C. parvum, and G. lamblia (clockwise from left). The similar sizes of C. parvum and Selenastrum should be noted, while G. lamblia is distinctly larger. (Image courtesy of M. Duley [Miami University], reproduced with permission.)
(Oo)cysts were obtained as commercial stock solutions (Waterborne, Inc., New Orleans, LA) of 1 × 10⁷ (oo)cysts in 8 ml. A working solution of 2 × 10⁵ (oo)cysts was made by diluting 160 μl of each thoroughly mixed stock solution to 10 ml (1× HBSS; pH 7.0). This concentration was confirmed by hemacytometry [three replicate counts of the working dilution were within 5% of the calculated 2 × 10⁵ (oo)cysts in 10 ml]. The grazing bottles were seeded with 500 μl of this working stock, yielding 1 × 10⁴ (oo)cysts per grazing bottle (66-ml total volume) or 151 (oo)cysts ml−1. Laboratory controls of C. parvum and G. lamblia working stocks were maintained at 4°C and compared to the D. pulicaria zero-grazer treatment to identify any confounding effects of (oo)cyst handling in the experimental setup.
Grazing bottles were placed on a rotating wheel (2 rpm) for 24 h at 20°C on a light:dark cycle of 16 h:8 h. Immediately following the 24-h grazing period, the D. pulicaria organisms were removed using a transfer pipette (minimizing liquid withdrawal), and the remaining suspension was concentrated by centrifugation (1,500 × g for 10 min) to 1 ml for analysis. Aliquots of each treatment suspension were taken from the 1-ml concentrate for (i) calculation of clearance rates (Table 1) and (ii) excystation, viability, and infectivity analyses (Table 2).
TABLE 1.
Calculation of clearance rates of C. parvum oocysts, G. lamblia cysts, and Selenastrum cells following a 24-h grazing period by D. pulicaria, including average recovered (oo)cysts and algae per grazing treatmenta
| Food | No. of D. pulicaria grazers | Food density (avg no. of cells ml−1)
|
Avg clearance rate (ml grazer−1 day−1) | |
|---|---|---|---|---|
| Control | Experimental | |||
| C. parvum | 2 | 107 | 51 | 24 |
| 4 | 107 | 29 | 22 | |
| G. lamblia | 2 | 189 | 106 | 19 |
| 4 | 189 | 76 | 15 | |
| Selenastrum | 2 | 1,159 | 646 | 19 |
| (with C. parvum) | 4 | 1,159 | 126 | 37 |
| Selenastrum | 2 | 1,701 | 1,162 | 13 |
| (with G. lamblia) | 4 | 1,701 | 855 | 11 |
Average clearance rates (ml grazer−1 day−1) for all food particles (C. parvum, G. lamblia, Selenastrum with C. parvum, and Selenastrum with G. lamblia) in these grazing experiments are based on the clearance rate formula. Calculations are based on a 24-h experimental duration in a 66-ml grazing volume. Control [zero-grazer to account for recoverable (oo)cysts] and experimental food densities are average number of cells ml−1 (in 66 ml) in a given grazing treatment (n = 5).
TABLE 2.
Viability, excystation, and infectivity counts of C. parvum oocysts and G. lamblia cysts following a 24-h grazing period by D. pulicaria organisms
| No. of D. publicaria grazer(s) |
C. parvum viability
|
G. lamblia viability
|
C. parvum excystation
|
G. lamblia excystation
|
C. parvum infectivity (%)e | ||||
|---|---|---|---|---|---|---|---|---|---|
| % Viable oocystsa | No. of oocysts countedb | % Viable cystsa | No. of cysts countedb | % Excysted oocystsc | No. of oocysts countedd | % Excysted cystsc | No. of cysts countedd | ||
| 0 | 97 (83-100) | 2-6 (3 ± 0.8) | 84 (80-87) | 92-102 (97 ± 1.8) | 100 (99-100) | 99-102 (100 ± 0.3) | 74 (68-79) | 112-136 (120 ± 4.2) | 15 ± 1.8 (9-20) |
| 2 | 100 (100) | 2-4 (3 ± 0.4) | 40 (30-47) | 84-119 (96 ± 4.3) | 95 (94-98) | 99-101 (100 ± 0.2) | 89 (80-95) | 108-121 (114 ± 2.6) | 2 ± 0.5 (0-3) |
| 4 | 92 (67-100) | 1-4 (2 ± 0.6) | 49 (44-59) | 78-98 (88 ± 2.7) | 87 (85-89) | 99-102 (100 ± 0.2) | 95 (89-98) | 88-132 (110 ± 7.1) | 2 ± 0.5 (0-3) |
| Laboratory control | 100 (100) | 18 (18 ± 0.0) | 86 (84-87) | 100-102 (101 ± 0.3) | 100 (100) | 100-102 (101 ± 0.5) | 78 (76-80) | 100-116 (107 ± 3.3) | 28 ± 11.0 (2-61) |
Percent viable (oo)cysts are expressed as the mean (n = 5) and the range (minimum to maximum).
Data are expressed as the range of total (oo)cysts counted and the mean number of (oo)cysts counted ± experimental standard error in the DAPI-PI procedure. Due to the low numbers of C. parvum oocysts counted in the DAPI-PI viability assay (presumably due to oocyst losses during staining and rinsing of the slides), these data are not statistically significant but are presented for completion of the data set.
Percent excysted (oo)cysts are expressed as the mean (n = 5) and the range (minimum to maximum).
Data are expressed as the range of total (oo)cysts counted and the mean number of (oo)cysts counted ± experimental standard error in the excystation procedure.
Counts of infectivity are per 100 intact oocysts and are reported as the mean percent infectivity ± experimental standard error (n = 5) and as the range of total infection foci.
Calculation of densities and clearance rates.
Selenastrum, C. parvum, and G. lamblia organisms were counted in the zero-grazer treatments following the 24-h grazing period; the zero-grazer treatment after the 24-h grazing rotation, centrifugation, and collection of the (oo)cyst pellet accounted for algal and (oo)cyst losses through handling and was a better initial control for this study. Therefore, counts of recoverable (oo)cysts from the zero-grazer treatments were used as the initial seeding densities for the grazing experiments using one, two, and four D. pulicaria organisms. Counts were conducted using a 1-ml Sedgwick-Rafter (SR) cell, which permitted the counting of all (oo)cysts present in an entire 20-μl subsample of the 1-ml concentrate postgrazing (compared to the 0.1-μl volume that would be counted in typical hemacytometry). Two SR cell counts were conducted for each sample, using 20 μl of the postgrazing concentrate for each count diluted to 1 ml (to fill the SR cell). Five replicates of each grazing treatment were statistically analyzed. Final recovered (oo)cyst and algal cell densities for the grazing experiments using one, two, and four D. pulicaria organisms were counted using the same SR cell method for all replicates of each grazing treatment. The recoverable (oo)cysts in the zero-grazer treatment were used to calculate the clearance rates (Table 1).
Clearance rates (F) were calculated according to the formula:
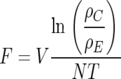 |
where V is grazing volume (0.066 liters), ρC is the density of recoverable food [i.e., Selenastrum cells or (oo)cysts] in the zero-grazer control treatment, ρE is the density of recoverable food [i.e., Selenastrum cells or (oo)cysts] in a given grazing treatment, N is the total number of grazers in a given grazing treatment, and T is the experimental duration (1 day). Clearance rates are reported as milliliters grazer−1 day−1 (per food item) (modified from reference 22) (Table 1).
Determining grazing effects on pathogens.
Three methods for determining the direct grazing effect of D. pulicaria on C. parvum oocysts and G. lamblia cysts were included in the present study. C. parvum viability, excystation, and in vitro infectivity and G. lamblia viability and excystation were assessed. All methods were based on previously published techniques. Viability assesses the permeability of the (oo)cyst wall by the uptake of the vital dyes DAPI and PI. (Oo)cysts that are intact and viable will stain with DAPI but will be impermeable to PI, whereas damaged (oo)cyst walls will permit uptake of PI and subsequent staining of the nucleic acids with both DAPI and PI. Excystation assesses the ability of an oocyst or cyst to excyst, releasing sporozoites or trophozoites, respectively, in the presence of bile acid (taurocholic acid). In vitro infectivity assesses the oocysts' ability to infect a human cell monolayer and develop intracellular life stages. Given these distinctions, it is possible that damage which does not affect the permeability of the outer wall but does render the (oo)cysts unable to excyst or reproduce would yield very different results in these three assays.
Vital dye staining (i.e., viability assay).
Viability was evaluated based on standard DAPI-PI vital dye staining techniques for C. parvum (4) and G. lamblia (20) using two 20-μl subsamples of the 1-ml concentrate postgrazing for each bottle (since five replicate bottles were included for each grazing pressure [one, two, or four D. pulicaria organisms], 10 DAPI-PI counts were analyzed for each grazing pressure). Viability was assessed for all (oo)cysts present in each subsample [up to 100 (oo)cysts], and the average of two counts for each treatment replicate was used for the statistical analysis (Table 2). Percent viability of C. parvum and G. lamblia was calculated as a percent change from the zero-grazer value for each treatment (Fig. 3).
FIG. 3.

Percent change from zero-grazer control of excystation, viability, and infectivity of C. parvum and G. lamblia with two and four D. pulicaria grazers in a 24-h experiment. Error bars represent experimental standard error (n = 5).
Excystation assay.
Excystation of C. parvum (11) and G. lamblia (10) was evaluated by standard protocol. Excystation counts were conducted using two 20-μl subsamples of the 1-ml concentrate postgrazing for each grazing bottle (since five replicate bottles were included for each grazing pressure [one, two, or four D. pulicaria organisms], 10 excystation counts were analyzed for each grazing pressure). Taurocholic acid (50 μl of a 0.75% solution) was added to each 20-μl subsample. The excystation suspension was then diluted to 1 ml and loaded into an SR cell for counting. Up to 100 (oo)cysts in each replicate excystation were classified as intact, partially excysted, or totally excysted, and the average of two counts for each treatment replicate was used for the statistical analysis (Table 2). Percent excystation of G. lamblia cysts and C. parvum oocysts was calculated as the percent change from the zero-grazer value for each treatment (Fig. 3).
Infectivity assay.
Percent infectivity of grazed C. parvum oocysts was calculated by in vitro cell culture infection of human ileocecal adenocarcinoma (HCT-8) cells grown in eight-well chamber slides according to Slifko et al. (13, 14). The oocysts remaining in the 1-ml postgrazing concentrate (after subsamples for density counts, viability staining, and excystation assays were removed) were pretreated with a 10% NaOCl solution, and the concentration of oocysts in the concentrate was determined by hemacytometry. An infection volume containing 100 oocysts from each experimental concentrate was calculated, and three replicate wells with confluent cell monolayers on the chamber slide were seeded with 100 oocysts from the postgrazing concentrate (i.e., 15 replicate wells were seeded for each grazing pressure [one, two, or four D. pulicaria organisms], since five replicate bottles were included for each grazing pressure and three replicate wells were infected per grazing bottle). Two wells on each slide were left uninfected to serve as negative controls. Infected chamber slides were incubated at 37°C and 5% CO2 for 48 h and then stained according to the Sporo-Glo antibody protocol (Waterborne, Inc., New Orleans, LA). Foci of infection were counted using a Nikon 50I upright epifluorescence microscope (Optical Apparatus, Ardmore, PA). Infection foci were counted as positive only if a cluster of three or more distinct life stages were present. The percent infective oocysts was calculated by dividing the number of infection foci by 100 (the total number of oocysts used to infect). The average percent infectivity and standard error were calculated from the five experimental replicates per grazing treatment (Table 2). Percent change in infectivity of HCT-8 cells in vitro by C. parvum oocysts was compared to the zero-grazer control to limit the confounding effects of oocyst handling and recovery (Fig. 3). Oocyst lab controls were tested simultaneously for infectivity.
Statistical analyses.
For all pathogen analyses following grazing, the recoverable (oo)cysts and Selenastrum from the D. pulicaria zero-grazer treatment were used as the controls (to eliminate any effect of handling and processing on pathogen health). The grazing data of one D. pulicaria on C. parvum oocysts and G. lamblia cysts are not presented due to extremely high variability among replicates; therefore, these analyses address the impact of high-intensity grazing in a 24-h period by two and four D. pulicaria grazers. Statistical analyses were conducted in SPSS (SPSS Release 13.0, SPSS Inc., Chicago, IL) using univariate general linear models fit to a binomial distribution (α = 0.05).
RESULTS
C. parvum oocysts and G. lamblia cysts were observed for mechanical disruption of the outer wall. High mechanical disruption of the G. lamblia cysts was noted (Fig. 1B), whereas little or no outer wall disruption of the C. parvum oocysts was observed in any of the grazing treatments.
In the control (zero-grazer) treatment, recoverable C. parvum and G. lamblia (oo)cyst counts were 97 to 122 (mean ± experimental standard error, 107 ± 2.7) ml−1 and 113 to 265 (189 ± 23.9) ml−1, respectively, in 66 ml. Selenastrum cell counts in the zero-grazer treatment with C. parvum and G. lamblia were 1,114 to 1,230 (1,159 ± 12.3) ml−1 and 1,628 to 1,796 (1,701 ± 28.4) ml−1, respectively, in 66 ml. For comparison, final recoverable C. parvum oocysts and G. lamblia cysts in the two-grazer treatment ranged from 38 to 62 (51 ± 2.5) ml−1 and 76 to 189 (106 ± 22.1) ml−1, respectively, and counts of Selenastrum cells with C. parvum and Selenastrum cells with G. lamblia were 632 to 662 (646 ± 3.5) ml−1 and 1,114 to 1,220 (1,162 ± 19.4) ml−1, respectively, in 66 ml. Final recoverable C. parvum oocysts and G. lamblia cysts in the four-grazer treatment ranged from 10 to 58 (29 ± 5.1) ml−1 and 38 to 114 (76 ± 11.9) ml−1, respectively, and Selenastrum with C. parvum and Selenastrum with G. lamblia counts were 81 to 160 (126 ± 6.7) ml−1 and 796 to 939 (855 ± 28.3) ml−1, respectively, in 66 ml (Table 1).
Clearance rates of two D. pulicaria grazers on G. lamblia alone, Selenastrum in the presence of G. lamblia, and C. parvum alone were 19, 13, and 24 ml grazer−1 day−1, respectively (not significantly different from the clearance rates of four D. pulicaria grazers at 15, 11, and 22 ml grazer−1 day−1, with P values of 0.441, 0.133, and 0.827, respectively) (Table 1). There was a significant increase in the clearance of Selenastrum in the presence of C. parvum from two to four D. pulicaria grazers (19 ml grazer−1 day−1 to 37 ml grazer−1 day−1; P < 0.001) (Table 1).
Mean percent infectivity (± standard error) of six working stock controls based on 100 intact C. parvum oocysts from the same lot used in the grazing experiment was 28% ± 11% (Table 2). The zero-grazer treatment mean percent infectivity of 100 intact C. parvum oocysts was 15% ± 1.8% (Table 2), demonstrating a 46% mean decrease in infectivity with handling during this experiment.
Two D. pulicaria grazers significantly decreased C. parvum mean excystation and mean infectivity by 5% (P = 0.001) and 87% (P < 0.001), respectively (Table 2 and Fig. 3), compared to the zero-grazer control. Four D. pulicaria grazers significantly decreased C. parvum mean excystation and infectivity by 13% (P < 0.001) and 87% (P < 0.001), respectively (Table 2 and Fig. 3), compared to the zero-grazer control. Given the extremely low numbers of oocysts counted after vital dye staining (presumably due to oocyst losses during staining and rinsing of the slides), oocyst viability data were inconclusive.
Two D. pulicaria grazers significantly decreased G. lamblia mean viability by 52% (P < 0.001) but significantly increased mean excystation by 20% (P < 0.001) following grazing (Fig. 3). Four D. pulicaria grazers significantly decreased G. lamblia mean viability by 42% (P < 0.001) but significantly increased mean excystation by 28% (P < 0.001) (Table 2 and Fig. 3).
DISCUSSION
This is the first quantitative demonstration of the potential for zooplankton grazers to reduce C. parvum and G. lamblia in freshwater systems. The actual reduction of human pathogens by zooplankton in surface waters will depend on many factors including the species, density, and depth distribution of the grazers and the pathogens. In nature, D. pulicaria and other species of Daphnia can reach maximum densities approaching 100 organisms liter−1, although average densities in lakes are more often on the order of 10 to 20 organisms liter−1 or less, depending on lake or reservoir productivity. At clearance rates even as low as 11 ml grazer−1 day−1 (the minimum clearance rate observed in the current study), high densities of Daphnia organisms have the potential to clear the entire population of human pathogens from the water in a single day under favorable conditions. Variations in the vertical distribution of pathogens and grazers and other environmental factors are likely to substantially reduce the impact, but these data do indicate the potential for zooplankton to act as a significant natural biological filter of human protozoan pathogens.
Grazing by D. pulicaria significantly decreased the total numbers of intact pathogens following a 24-h grazing period in the presence of an alternate food source, Selenastrum. Both C. parvum and G. lamblia were cleared from the water by D. pulicaria at rates that are similar to or greater than the culture food, Selenastrum. The similarity in size of the Selenastrum, C. parvum, and G. lamblia (Fig. 2) is believed to contribute to the insignificant differences in clearance rates in this study. The one significantly different clearance rate between two and four grazers (Selenastrum in the presence of C. parvum) may have occurred because of clumping of the Selenastrum cells or of the cells with the oocysts or simply because of the increased number of grazers and the potential for repeated filtering of food particles.
The grazing methods used herein do not permit distinction between (oo)cysts that were never ingested by D. pulicaria and those that were ingested multiple times during the 24-h period. Given the relatively small grazing volume (66 ml), the high densities of both pathogens and Daphnia, and the clearance rates per grazer (Table 1), potential repeated ingestion rates can be calculated. We estimate that two grazers will filter 26 to 48 ml of water every 24 h, or 39 to 73% of the grazing vessel volume (based on the range of calculated clearance rates of 13 to 24 ml grazer−1 day−1 food item−1). We estimate that four grazers will filter 44 to 148 ml, or 67 to 224% of the grazing vessel volume, every 24 h (based on the range of calculated clearance rates of 11 to 37 ml grazer−1 day−1 food item−1). Although this experimental design does not allow confirmation of the repeated ingestion of the (oo)cysts, the clearance rates of this experimental design (26 to 59 ml grazer−1 day−1 of a pathogen and algae) suggest that one grazer could pass all food items in the grazing vessel in a 27- to 61-h period (Table 1).
The high likelihood for repeated ingestion in this study may cause mechanical damage to the (oo)cyst walls, resulting in decreased viability (due to PI penetration through the damaged wall), decreased infectivity, but potentially increased excystation counts [as the release of sporozoites or trophozoites due to excystation conditions may be difficult to differentiate from their release due to mechanical damage to the (oo)cyst wall]. Upon visual observation of the (oo)cysts following grazing, C. parvum showed, in most cases, no outer wall damage of the oocysts that would be attributed to mechanical disruption in the grazing treatments. In contrast, the outer wall of many G. lamblia cysts appeared to be mechanically disrupted after their ingestion and excretion by D. pulicaria (Fig. 1B). This observation supports our findings that G. lamblia excystation counts increased, but viability decreased, with increased grazing (Table 2 and Fig. 3).
Reduced C. parvum oocyst excystation with increased numbers of grazers suggests some influence of the D. pulicaria on the ability of the oocysts to initiate the life cycle and develop intracellular life stages. These data were supported by the significant reduction in infectivity of C. parvum by in vitro cell culture following D. pulicaria grazing. This marked decrease in infectivity following a 24-h grazing period by even two grazers strongly supports the biotic control of infectious human pathogens by zooplankton.
In the absence of an established in vitro cell culture assay for G. lamblia, viability and excystation were used here as infection proxies. D. pulicaria grazing significantly decreased the percent viability of intact G. lamblia cysts. This decreased viability of G. lamblia following grazing supports the theory that mechanical digestion by the D. pulicaria, likely with repeated ingestion and excretion in a 24-h period, disrupts the outer wall. This outer wall disruption made it appear that excystation was increasing although, in reality, it is likely that many of the cysts that appeared to have excysted were actually damaged by mechanical digestion. Although viability staining may overestimate the percentage of infectious cysts in the population (17), we predict a significant decrease in the infectivity of G. lamblia cysts following grazing by D. pulicaria based on the striking decrease in viability observed here. Future studies that utilize an animal model to determine infectivity of G. lamblia following grazing should include an analysis of both excystation and viability to confirm mechanical interference with the outer wall as a mechanism for reduced survival of the cysts (as opposed to any intrinsic difference in the outer wall construction of G. lamblia versus C. parvum that might be impacted by pH or other abiotic influences of the Daphnia gut).
Multiple factors may influence the impact of zooplankton grazers on the presence and infectivity of human pathogens in natural systems, and interactions of abiotic and biotic factors may play a significant role in pathogen control. Zooplankton grazers are often present in freshwater systems that contain pathogens (lakes and reservoirs, for example) and can have a significant impact on these waterborne pathogen populations. The data presented in this study provide strong evidence that under conditions in which zooplankton grazers flourish and where settling rates of the oo(cysts) are low, D. pulicaria grazers can significantly decrease the numbers of infectious pathogens in freshwater systems.
Acknowledgments
S.J.C. and C.E.W. thank the Zoology Department (Miami University) for graduate research support to S.J.C. This work was partially supported by CAREER Award 0545687 from the National Science Foundation to K.L.J.
S.J.C. thanks M. Duley (Miami University) for DIC imaging and microscopy support on this project.
Footnotes
Published ahead of print on 14 September 2007.
REFERENCES
- 1.Agasild, H., and T. Nõges. 2005. Cladoceran and rotifer grazing on bacteria and phytoplankton in two shallow eutrophic lakes: in situ measurement with fluorescent microspheres. J. Plank. Res. 27:1155-1174. [Google Scholar]
- 2.Armengol, X., L. Boronat, A. Camacho, and W. A. Wurtsbaugh. 2001. Grazing by a dominant rotifer Conochilus unicornis Rousselet in a mountain lake: in situ measurements with synthetic microspheres. Hydrobiologia 446/447:107-114. [Google Scholar]
- 3.Brookes, J. D., J. Antenucci, M. Hipsey, M. D. Burch, N. J. Ashbolt, and C. Ferguson. 2004. Fate and transport of pathogens in lakes and reservoirs. Environ. Int. 30:741-759. [DOI] [PubMed] [Google Scholar]
- 4.Campbell, A. T., L. J. Robertson, and H. V. Smith. 2002. Viability of Cryptosporidium parvum oocysts: correlation of in vitro excystation with inclusion or exclusion of fluorogenic vital dyes. Appl. Environ. Microbiol. 58:3488-3493. [DOI] [PMC free article] [PubMed] [Google Scholar]
- 5.Centers for Disease Control and Prevention. 7 December 2005, posting date. DPDx: laboratory identification of parasites of public health concern. Parasites and health: cryptosporidiosis. http://www.dpd.cdc.gov/dpdx/.
- 6.Cyr, H., and M. L. Pace. 1992. Grazing by zooplankton and its relationship to community structure. Can. J. Fish Aquat. Sci. 49:1455-1465. [Google Scholar]
- 7.Gardner, T. B., and D. R. Hill. 2001. Treatment of giardiasis. Clin. Microbiol. Rev. 14:114-128. [DOI] [PMC free article] [PubMed] [Google Scholar]
- 8.Hsu, B. M., and H. H. Yeh. 2003. Removal of Giardia and Cryptosporidium in drinking water treatment: a pilot-scale study. Water Res. 37:1111-1117. [DOI] [PubMed] [Google Scholar]
- 9.Pokorny, N. J., S. C. Weir, R. A. Carreno, J. T. Trevors, and H. Lee. 2002. Influence of temperature on Cryptosporidium parvum oocyst infectivity in river water samples as detected by tissue culture assay. J. Parasitol. 88:641-643. [DOI] [PubMed] [Google Scholar]
- 10.Rice, E. W., and F. W. Schaefer III. 1981. Improved in vitro excystation procedure for Giardia lamblia cysts. J. Clin. Microbiol. 14:709-710. [DOI] [PMC free article] [PubMed] [Google Scholar]
- 11.Robertson, L. J., A. T. Campbell, and H. V. Smith. 1993. In vitro excystation of Cryptosporidium parvum. Parasitology 106:13-19. [DOI] [PubMed] [Google Scholar]
- 12.Rose, J. 1988. Occurrence and significance of Cryptosporidium in water. J. Am. Water Works Assoc. 2:53-58. [Google Scholar]
- 13.Slifko, T. R., D. Friedman, J. B. Rose, and W. Jakubowski. 1997. An in vitro method for detecting infectious Cryptosporidium oocysts with cell culture. Appl. Environ. Microbiol. 63:3669-3675. [DOI] [PMC free article] [PubMed] [Google Scholar]
- 14.Slifko, T. R., D. E. Huffman, and J. B. Rose. 1999. A most-probable number assay for enumeration of infectious Cryptosporidium parvum oocysts. Appl. Environ. Microbiol. 65:3936-3941. [DOI] [PMC free article] [PubMed] [Google Scholar]
- 15.Smith, H. V., and J. B. Rose. 1990. Waterborne cryptosporidiosis. Parasitol. Today 6:8-12. [DOI] [PubMed] [Google Scholar]
- 16.Stott, R., E. May, E. Ramirez, and A. Warren. 2003. Predation of Cryptosporidium oocysts by protozoa and rotifers: implications for water quality and public health. Water Sci. Technol. 47:77-83. [PubMed] [Google Scholar]
- 17.Thiriat, L., F. Sidaner, and J. Schwartzbrod. 1998. Determination of Giardia cyst viability in environmental and faecal samples by immunofluorescence, fluorogenic dye staining and differential interference contrast microscopy. Lett. Appl. Microbiol. 26:237-242. [DOI] [PubMed] [Google Scholar]
- 18.Trout, J. M., E. J. Walsh, and R. Fayer. 2002. Rotifers ingest Giardia cysts. J. Parasitol. 88:1038-1040. [DOI] [PubMed] [Google Scholar]
- 19.U.S. Environmental Protection Agency. 1998. Giardia: human health criteria document. Office of Water, U.S. Environmental Protection Agency, Washington, DC.
- 20.U.S. Environmental Protection Agency. 2001. Method 1623: Cryptosporidium and Giardia in water by filtration/IMS/FA. EPA 821-R-01-026. Office of Water, U.S. Environmental Protection Agency, Washington, DC.
- 21.U.S. Environmental Protection Agency. 2002. Short-term methods for estimating the chronic toxicity of effluents and receiving waters to freshwater organisms, 4th ed. U.S. Environmental Protection Agency, Washington, DC.
- 22.Williamson, C. E., and J. W. Reid. 2001. Copepoda, p. 915-954. In J. H. Thorp and A. P. Covich (ed.), Ecology and classification of North American freshwater invertebrates, 2nd ed. Academic Press, New York, NY.