

Abstract
A protein sensor with a highly responsive fluorescence resonance energy transfer (FRET) signal for sensing sugars in living Saccharomyces cerevisiae cells was developed by combinatorial engineering of the domain linker and the binding protein moiety. Although FRET sensors based on microbial binding proteins have previously been created for visualizing various sugars in vivo, such sensors are limited due to a weak signal intensity and a narrow dynamic range. In the present study, the length and composition of the linker moiety of a FRET-based sensor consisting of CFP-linker1-maltose-binding protein-linker2-YFP were redesigned, which resulted in a 10-fold-higher signal intensity. Molecular modeling of the composite linker moieties, including the connecting peptide and terminal regions of the flanking proteins, suggested that an ordered helical structure was preferable for tighter coupling of the conformational change of the binding proteins to the FRET response. When the binding site residue Trp62 of the maltose-binding protein was diversified by saturation mutagenesis, the Leu mutant exhibited an increased binding constant (82 μM) accompanied by further improvement in the signal intensity. Finally, the maltose sensor with optimized linkers was redesigned to create a sugar sensor with a new specificity and a wide dynamic range. When the optimized maltose sensors were employed as in vivo sensors, highly responsive FRET images were generated from real-time analysis of maltose uptake of Saccharomyces cerevisiae (baker's yeast).
Fluorescence resonance energy transfer (FRET) is a nonradiative energy transfer between donor and acceptor fluorophores in which the signal intensity changes depending on the proximity and relative angular orientation between the fluorophores (15). As such, FRETs between fluorescent proteins with a spectral overlap have been used to investigate spatial and temporal interactions in living cells when they are conjugated to interacting protein pairs (9, 18, 28). Plus, when a fusion protein consisting of calmodulin and the M13 peptide was flanked by two fluorescent protein variants, the calcium binding to the calmodulin moiety and the consequent affinity to the M13 peptide were found to result in a stronger FRET intensity between the fluorescent proteins (19). Thus, the protein and the improved derivatives have been applied to monitor the calcium concentrations in living cells (1, 13), while various FRET-based sensors have been developed for the detection of cyclic AMP (29), cGMP (11, 24), GTP/GDP (20), inositol 1,4,5-trisphosphate (25, 27), and infectious enteroviruses (12).
The hinge-like twisting and bending motion of bacterial periplasmic binding proteins has also been introduced as an element for FRET-based sensors (7, 8). Here, the substrate is located deep within the cleft between the globular N and C lobes, and in the case of substrate binding, the protein undergoes a hinge-like bending motion, causing a change in distance and/or angular orientation between the fluorescent proteins. Maltose-, glucose-, ribose-, and recently, glutamate-binding proteins have all been used as binding elements for analyzing their own substrates (14, 23).
Despite the development of excellent FRET-based sensors for the quantitative visualization of physiological events in living cells, the weak signal intensity and the dynamic range of such sensors limit their application for in vitro or in vivo sugar analysis. The weak signal intensity originates from the small structural change of the sensing moiety, along with the incomplete transfer of the domain motions to the fluorescent proteins (30). Circular permutation studies of the FRET acceptor have resulted in the increased signal intensity of a calcium sensor (21), demonstrating that the proper reorientation of FRET pairs is critical to achieve highly responsive FRET-based sensors. Furthermore, recent molecular modeling of the linker peptide of a FRET-based sensor for cyclic AMP yielded an improved linker with a doubled FRET efficiency and a substantially improved signal intensity (16). However, while modeling studies offer a rationale for linker design, experimental approaches have achieved even greater signal intensities (4, 10). For example, a linker truncation to enhance the allosteric coupling of the glucose/galactose-binding protein MglB from Escherichia coli and green fluorescent protein (GFP) variants produced sensors with a threefold-improved signal intensity, based on reducing the flexible movement of the chromophore (4).
Accordingly, this study attempted to systematically engineer the linker moiety by inserting and optimizing peptide connectors with different lengths and compositions (Fig. 1B) to achieve a tighter coupling of the molecular motion of the maltose-binding protein (MBP) to the FRET response. The resulting maltose sensor with optimized linkers was then investigated as a template protein for the creation of highly responsive sugar sensors with a wide dynamic range and new specificities.
FIG. 1.

Design and engineering of highly responsive FRET-based sensors with optimized linkers. (A) Primary structures of N- and C-terminal composite linkers consisting of various connecting peptides and flanking domains. The suffixes to the sensor names indicate different types of linkers (see Fig. S3A in the supplemental material). (B) Ratio changes induced by maltose are shown, where solid and dashed bars represent 530/480 emission ratios in the absence and presence, respectively, of 10 mM maltose. Values on top of the bars indicate the levels of increase or reduction in emission intensity ratios. Data are presented as the averages of at least three experiments. (C) Maltose titration curves for maltose sensors with optimized linkers. The solid curve in each case represents the least-squares fit of ratio change to concentration of maltose, as described in Materials and Methods. The inset shows the predicted helical structure of the linker1 moiety, consisting of a connecting peptide LH and flanking regions of CFP and MBP. Color key: main body of CFP (cyan), terminal 310-helix extended from CFP (red), connecting peptide LH (yellow), and MBP (purple).
MATERIALS AND METHODS
DNA manipulations, expression, purification, and molecular simulations.
Detailed methods are available in the supplemental material.
Fluorescence analyses and titration curves.
The spectroscopic analysis was performed at 25°C, using a Cary Eclipse spectrofluorometer (Varian, Inc., Mulgrave, Australia), after the concentration of the sensor proteins was adjusted to 0.2 μM in a phosphate-buffered saline (PBS) buffer (pH 7.4). The fluorescence spectra of the cyan fluorescent protein (CFP) and yellow fluorescent protein (YFP) were then recorded at 480 nm (excitation at 436 nm) and 530 nm (excitation at 514 nm), respectively. The FRET levels were represented as the ratio of the emission intensities at 530 nm and at 480 nm when the sensors were excited at 436 nm. The signal intensity with sugar was defined as the change in the 530/480 ratio. The ratio profiles for a wide range of sugar concentrations were fitted using a four-parameter Hill equation with SIGMAPLOT 8.0 software (Systat Software Inc., Richmond, CA), and the points corresponding to 50% saturation were estimated as the dissociation constants (Kd) for sugar. All the experimental values were derived from the averages of at least three titration experiments.
Analysis of ratio change on microtiter plates.
A rapid analysis of the mutant library was performed with a microtiter plate. First, the colonies were transferred into 0.5 ml of LB medium containing 50 μg ml−1 ampicillin and 0.5 mM isopropyl-β-d-thiogalactopyranoside in a 96-deep-well plate. The plates were shaken for 24 h at 28°C in an HT-MegaGrow incubator (Bioneer Co., Daejeon, Korea). The cells were then harvested, washed in 0.5 ml of PBS buffer, and treated with 250 μl of PBS buffer containing 50% Cellytic B (Sigma-Aldrich Co., St. Louis, MO), lysozyme (5 μg ml−1), and DNase (1 unit) at 37°C for 1 h. After centrifugation for 20 min at 3,500 × g on a 96-well plate centrifuge (Hanil Sci. Ind., Incheon, Korea), 200 μl of the supernatant was moved to 96-well plates, and the ratio change before and after the addition of 10 mM maltose was determined by using a Victor2 multilabel reader (Perkin-Elmer, Inc., Wellesley, MA). A 450/8-nm filter was used for the CFP excitation, and 486/10-nm and 535/25-nm filters were used for the CFP and YFP emissions, respectively.
Live cell imaging.
The haploid Saccharomyces cerevisiae strain 2805 (mataprep4::HIS3 prb1 can1 his3 ura3) (26) was used as the host for the expression of the maltose sensors. The yeast cells were transformed with the YEG-CMY plasmids, in which the CMY genes had been placed under the control of the GAL10 promoter (see Fig. S3B in the supplemental material) and grown for 30 to 40 h in a synthetic defined (SD) medium (26) consisting of a 0.67% Difco yeast nitrogen base without amino acid (BD Biosciences) and 0.077% Ura DO supplement (Clontech) with 1% glucose and 1% galactose as the carbon source and the inducer, respectively. Before imaging, the yeast cells were suspended in a sugar-free SD medium (pH 7.4) to deplete the remaining carbon sources, and then 25 μl of the culture broth was transferred into 5 ml of sugar-free SD medium in a 35-by-10-mm glass-bottom dish (SPL Life Sci., Kyeonggi, Korea), which was fixed to the microscope stage with two-sided tape to avoid disturbing the sedimenting cells during the microscopic observation. The fluorescence images were collected by using a FRET split-imaging system, consisting of a DP30BW charge-coupled-device camera connected to a split primary image camera port (U-SIP) and an IX71 model inverted microscope equipped with a plan apochromat N 60×, by 1.42 numerical aperture objective and an oil-immersion objective (Olympus Co., Hamburg, Germany). After specimens were observed for 2 min, the maltose solutions were carefully added to the edge of the dish to make 10 mM concentrations. Fluorescence imaging was then carried out with XF88-2 FRET filter sets (Omega Optical Inc., Brattleboro, VT) consisting of a 440AF21 excitation filter, a 455DRLP dichroic mirror, and a 480AF30/535AF26 emission filter. Image acquisition and analysis of the multiple fluorescence images were performed using CellP software (Olympus).
RESULTS
Design and characterization of FRET-based sensors with different linker moieties.
FRET-based maltose sensors with various lengths and compositions of linker peptides, CFP-L1 linker-MBP-L2 linker-YFP, were genetically constructed to investigate the effect of linkers on the signal intensity (Fig. 1A). The binding element used was a mature periplasmic MBP of E. coli, while the L1 linker was a dipeptide (Ser-Arg or Ala-Ser), a tetrapeptide (Glu-Ser-Gly-Arg), or a direct fusion between the CFP and MBP. The L2 linker was a dipeptide (Gly-Ser), a long extended peptide (20 or 22 residues consisting mainly of Asn), or a direct fusion between the MBP and YFP. The various combinations of the different L1 and L2 linkers generated 11 hybrid proteins (Fig. 1A), referred to as CMYs, with suffixes indicating different types of linkers.
The proteins were expressed in E. coli JM109(DE3) and purified to homogeneity by sodium dodecyl sulfate-polyacrylamide gel electrophoresis via two sequential chromatographic methods using ion exchange and Ni affinity. In the fluorescence analysis, the proteins with shorter linkers produced relatively higher FRET levels (Fig. 1A and B), except for CMY-B, which showed a lower FRET level in spite of a short linker. When the signal intensity of the maltose sensors was determined, based on the change in the 530/480 emission ratio (see Fig. S1A in the supplemental material), the CMY-BII protein with Ser-Arg as the L1 linker produced the highest signal (≈0.17) at saturating concentrations of maltose. Meanwhile, the CMY-E and CMY-S proteins with longer linkers showed negligible signal intensities.
Although CMY-BIII had the same primary sequence as the CMY-BII protein, except for the L1 moiety, the ratio change for CMY-BII was about six times higher than that for CMY-BIII (Fig. 1B), implying that the linker moiety played a critical role in the ratio change. Thus, the L1 moiety of CMY-BII was subjected to genetic randomization via saturation mutagenesis. From a mutant library consisting of 1.0 × 10⁴ clones, the ratio changes for 4,000 clones were examined in the absence and presence of 10 mM maltose, using a Victor2 multilabel reader, as described in Materials and Methods. Although the signal intensity for most of the L1 variants was found to deteriorate, 5% of the mutants showed a significantly improved signal intensity compared with that of CMY-BII. After the screening step was repeated, CMY-QI and CMY-LH with Gln-Ilu and Leu-His as the respective L1 linkers were finally selected as the proteins with the optimal linkers and were purified to homogeneity by sodium dodecyl sulfate-polyacrylamide gel electrophoresis following the purification steps described in the supplemental material.
Fluorescence analyses of the purified CMY-QI and the CMY-LH proteins determined the 530/480 ratios without maltose as 1.96 and 3.02, respectively (Table 1). When the maltose concentration was changed from 10−3 to 103 μM, the emission ratios for the CMY-QI and CMY-LH proteins increased, following sigmoid curves (Fig. 1C), and the maximum changes in the ratios were calculated as 0.34 and 0.50, respectively, which were seven and ten times higher, respectively, than that for CMY-0 constructed by direct fusion without any linkers. Meanwhile, the half-saturation Kd values for the CMY-QI and CMY-LH proteins were similar to each other at 1.8 μM and 1.6 μM, respectively (Table 1).
TABLE 1.
Properties of FRET-based maltose sensors with different linkers and binding sites
| Maltose sensor | 530/480 fluorescence intensity ratioa
|
Change in ratiob | Kd value ± SD (μM)c | |
|---|---|---|---|---|
| Without maltose | With maltose | |||
| CMY-0 | 1.56 | 1.61 | 0.05 | 2.4 ± 0.2 |
| CMY-B | 1.35 | 1.35 | ||
| CMY-BII | 1.85 | 2.02 | 0.17 | 1.8 ± 0.1 |
| CMY-QI | 1.96 | 2.30 | 0.34 | 1.8 ± 0.1 |
| CMY-LH | 3.02 | 3.52 | 0.50 | 1.6 ± 0.1 |
| CMY-LH/W62H | 2.92 | 3.61 | 0.69 | 40 ± 1 |
| CMY-LH/W62L | 2.66 | 3.66 | 1.00 | 80 ± 1 |
| CMY-LH/W62A | 2.70 | 3.00 | 0.30 | 255 ± 6 |
Intensity ratio between fluorescence emissions at 530 nm and at 480 nm when sensor proteins were excited at 436 nm.
Maximum change of the 530/480 ratio in response to maltose.
The Kd value ± standard deviation of the concentration (μM) of maltose that induces a half-maximal increase in the intensity ratio.
The structural relevance of the linker optimization was investigated by using a molecular simulation of the composite linker moieties, including the linker peptide and six flanking residues of the CFP C terminus plus the six residues of the MBP N terminus (Fig. 1A). While the six CFP residues are known to extend out of the β-barrel main domain (Protein Data Bank [PDB] entry 1QYO) and form a 310-helix, the six MBP residues form a β turn-type structure approximately 27 Å apart from the maltose-binding site (PDB entry 1NMU). A web-based helix/coil transition algorithm (http://www.embl-heidelberg.de/Services/serrano/agadir/agadir-start.html), which considers only short-range interactions, predicted that an optimized linker moiety in CMY-QI or CMY-LH would have a 4- to 5-times-higher helicity than the arbitrary linker moiety of CMY-BII or CMY-BIII. Furthermore, molecular dynamic simulations indicated that an optimized linker moiety with a Leu-His peptide would maintain a globally helical state (Fig. 1C, inset) with a 310-helix region and a β turn-type region stiffly conserved along the simulation time. Therefore, the optimized L1 linker moiety was estimated to have a lower flexibility and a higher helical content than the nonoptimized linkers that exhibited low-ratio changes.
Engineering of a maltose-binding site for a wide dynamic range.
MBP accommodates maltose via hydrogen bonds and stacking interactions, including Trp residues in the maltose-binding site. Thus, replacing Trp residues with Ala has been reported to extend the dynamic range of FRET-based maltose sensors (7), although the signal intensity is significantly compromised. However, in the case of a ribose sensor, certain binding site mutations extend the dynamic range and are accompanied by a higher signal intensity (14).
As structural studies have previously shown that Trp62 from an MBP forms a hydrogen bond between the ring nitrogen and the 3-hydroxyl group of the second glucose unit (5), Trp62 was selected as the target site for saturation mutagenesis to improve both the dynamic range and the signal intensity of the FRET-based maltose sensors. The template protein used was CMY-LH, which was identified as retaining the best L1 moiety. The mutant library was explored with a Victor2 multilabel reader to compare the signal intensities and affinity ranges. As a result, two Trp62 mutants, CMY-LH/W62H and CMY-LH/W62L, were selected and purified to homogeneity. A structural model of the aligned binding site (Fig. 2A) showed that the His residue retained a close architecture with Trp62, while the Leu and Ala mutations exhibited more-significant structural differences.
FIG. 2.

Redesign of maltose-binding site for a wide dynamic range and an enhanced response. (A) Predicted structures of different binding site mutants. Mutated residues are shown with colored sticks: Trp62 to His (green), Leu (blue), and Ala (yellow). Maltose is located in the binding pocket. (B) Maltose titration curves for purified binding site mutants.
Fluorescence analyses of the CMY-LH/W62H and CMY-LH/W62L mutants under maltose-free conditions revealed emission ratios of 2.92 and 2.66, respectively (Table 1), which were slightly lower than the emission ratio for CMY-LH. However, under maltose-saturating concentrations, the ratios were remarkably increased by 0.69 and 1.00, respectively (Fig. 2B), meaning the signal intensities for the W62H and W62L mutants were 14- and 20-fold higher, respectively, than that for CMY-0. Meanwhile, the half-saturation Kd values for the W62H, W62L, and W62A mutants were determined to be 40, 80, and 255 μM, respectively, indicating that the dynamic range also shifted to a higher level when the single amino acid was substituted (Table 1).
Engineering of a maltose-binding site for broad specificity.
Directed evolution and structure-based rational design have already been successfully applied to engineer the substrate specificity of periplasmic binding proteins. For example, a ribose-binding protein was converted into analogs of the glycolytic enzyme triose phosphate isomerase (6), while a sucrose-binding activity was created from an E. coli MBP by evolutionarily engineering the MBP-lactamase switches (10). Thus, the mutations defined in the latter example (Asp14 to Leu, Lys15 to Phe, Trp62 to Tyr, and Glu111 to Tyr) were all introduced into three maltose sensors (CMY-LH, CMY-BII, and CMY-B) with different linker moieties.
The resulting sensors exhibited remarkably low background ratios under ligand-free conditions (Table 2). Furthermore, as anticipated, the sucrose sensors with the optimized linkers produced higher signal intensities, regardless of whether sucrose or maltose was used as the substrate (Fig. 3A and B). In particular, CSY-LH showed a strong ratio change of 0.72, which was 50% higher than that for CMY-LH with the same linkers. Plus, the Kd values for CSY-LH were 163 μM and 640 μM with sucrose and maltose, respectively (Table 2). These affinities were both 25-fold lower than those for the free sucrose-binding protein (10), probably due to the presence of the flanking fluorescent proteins or to differences in the analysis methods. Interestingly, CSY-B showed a decreased emission ratio of −0.11 when it was saturated with sucrose or maltose, whereas the corresponding template CMY-B displayed no significant change.
TABLE 2.
Signal intensity and dynamic range for FRET-based sucrose/maltose sensors with different linkers
| Sensor | 530/480 fluorescence intensity ratioa
|
Change in ratiob | Kd value ± SD (μM)c | |
|---|---|---|---|---|
| Without substrate | With substrate | |||
| CSY-B | ||||
| Sucrose | 1.56 | 1.45 | −0.11 | 286 ± 16 |
| Maltose | 1.55 | 1.45 | −0.10 | 1,132 ± 183 |
| CSY-BII | ||||
| Sucrose | 1.64 | 1.78 | 0.14 | 234 ± 18 |
| Maltose | 1.65 | 1.79 | 0.14 | 773 ± 69 |
| CSY-LH | ||||
| Sucrose | 1.83 | 2.55 | 0.72 | 163 ± 3 |
| Maltose | 1.83 | 2.57 | 0.74 | 640 ± 21 |
Intensity ratio between fluorescence emissions at 530 nm and at 480 nm when sensor proteins were excited at 436 nm.
Maximum change of the 530/480 ratio in response to substrate.
The Kd value ± standard deviation of the concentration (μM) of substrate that induces a half-maximal increase in the intensity ratio.
FIG. 3.
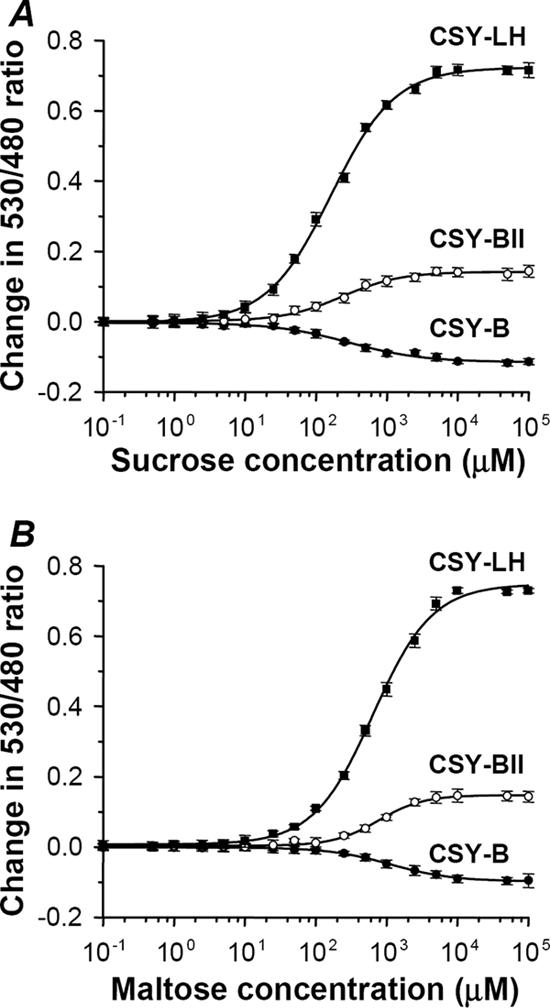
Titration curves for purified sucrose/maltose sensors, redesigned from maltose sensors. Ratio changes with sucrose (A) and with maltose (B). Symbols represent sensor proteins with different linker moieties. The solid curve represents the least-squares fit of ratio change to the concentration of ligand.
Investigation of binding specificity for various sugars.
Since a high specificity toward the target molecules is an essential requirement for the application of molecular sensors in living cells, this study also investigated the substrate specificity of the sugar sensors CMY-LH, CMY-LH/W62H, CMY-LH/W62L, and CSY-LH using 19 available sugars, including mono-, di-, and trisaccharides and sugar alcohols (see Fig. S2 in the supplemental material). The CMY-LH/W62H and CMY-LH/W62L mutants were remarkably specific for maltose and exhibited no recognizable responses to other sugars, yet the high-affinity maltose sensor CMY-LH also responded to d-glucose and d-melezitose at a concentration of 10 mM, which was 4 orders higher than the Kd value for maltose. It is possible that a trace amount of contaminant in the commercial d-glucose and d-melezitose may have caused this unexpected response. Meanwhile, the sucrose sensor CSY-LH revealed very high responses toward both sucrose and maltose, as reported previously (10).
Molecular imaging and analysis of maltose uptake in yeast cells.
Saccharomyces cerevisiae is used in the industrial production of fermented beverages and baker's yeast (22). Thus, the metabolism of maltose in the yeast S. cerevisiae is very important for academic and industrial research, as it produces about 55% of the fermentable sugars in traditional malt worts for the brewing and distilling industry (2). While molecular genetic tools have resulted in many important discoveries about the transport, metabolism, and regulation of maltose uptake in yeast cells, a highly sensitive maltose sensor with different Kd levels is needed to determine the cytosolic maltose concentrations for an equilibrium of uptake and degradation. Therefore, the two high-affinity maltose sensors CMY-BII and CMY-LH and the low-affinity CMY-LH/W62L mutant (Table 1) were expressed in the cytoplasm of S. cerevisiae for imaging and analysis of the maltose uptake in living yeast cells. CMY-B was used as the negative control for the ratio imaging experiments, as it produced no recognizable response with maltose or any other sugars (Table 1).
Two minutes after the initial image was obtained, maltose concentrations of up to 10 mM were added to the yeast cells expressing CMY-B, CMY-BII, CMY-LH, or the CMY-LH/W62L mutant, and images were taken every 30 s for 10 min. As a result, the ratio images exhibited a time-dependent increase in the red-colored regions of cytoplasm in the yeast cells, indicating the transport of maltose across the plasma membrane (Fig. 4A). However, cells with the CMY-B protein exhibited no significant change in the images throughout the experiment, demonstrating that only the maltose sensors with the proper composite linkers responded to the uptake of maltose in the yeast cells.
FIG. 4.
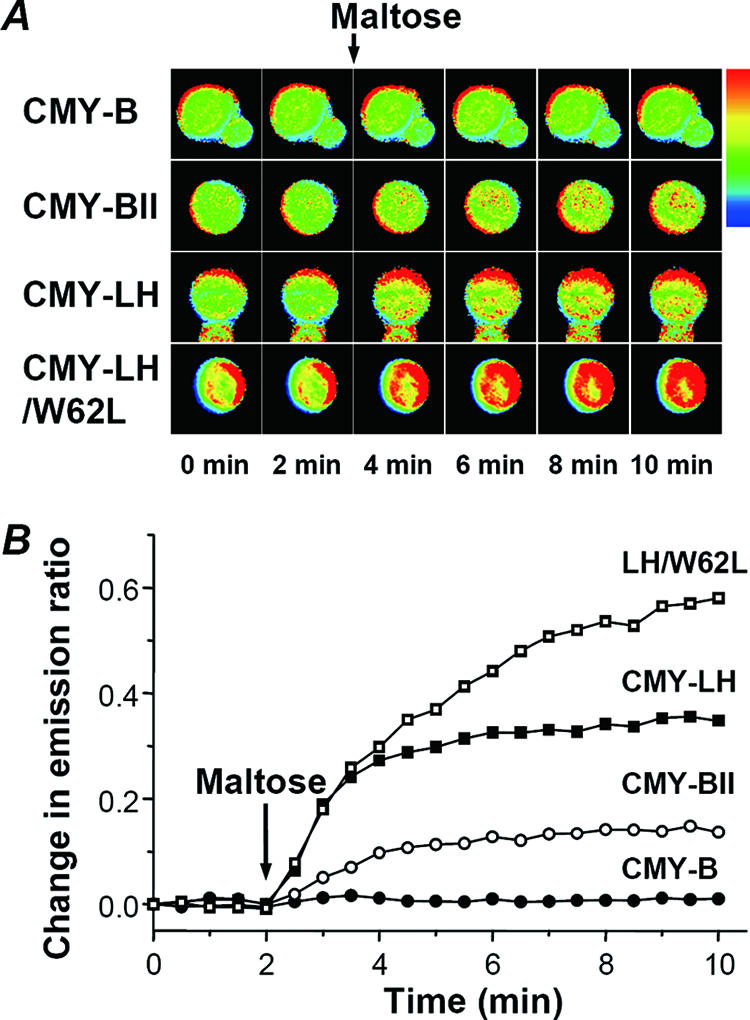
Comparative measurements of maltose uptake in living yeast cells. (A) Ratio imaging of maltose uptake in yeast cells. The cyan and yellow images were merged pixel by pixel and analyzed based on the ratio method of the FRET analysis protocol using CellP software (Olympus Co., Hamburg, Germany). After the cyan and yellow images were merged, pseudocolored images were produced using option Rainbow3 to demonstrate the dynamic changes of the maltose concentration in the living yeast, where red indicates a high ratio and green indicates a low ratio. Maltose was added after 2 min, as indicated by the arrow on top. (B) Quantification of resulting ratio images. To quantify the ratio images obtained, 5 to 11 cells were selected as ROIs, and the cyan and yellow fluorescent intensities were analyzed using CellP software.
To quantify the ratios in the images obtained, 5 to 11 cells were selected as the regions of interest (ROIs) and were analyzed using CellP software. The numerals acquired across the ROIs were imported into Excel to calculate the ratio values for a single yeast cell. Figure 4B shows the time-dependent increase in the emission ratio following maltose uptake by the yeast cells. CMY-BII, CMY-LH, and the CMY-LH/W62L mutant all exhibited different ratio changes, as expected from the in vitro experiments (Table 1). The CMY-LH/W62L mutant exhibited the highest signal intensity yet did not reach saturation before the end of the observation period, probably reflecting larger Kd values. Meanwhile, although CMY-BII and CMY-LH showed different ratios, both reached saturation levels within 2 min after the addition of maltose, which was consistent with their similar Kd values (Table 1).
DISCUSSION
Conformational changes in proteins result from the adjustment of the main-chain torsion and the side-chain reorientation, and the overall effect of such molecular changes can induce a hinge-like bending or a torsion motion between related domains in binding proteins. This structural motion has already been adopted in the development of molecular sensors for monitoring small molecules in biological samples (3, 11, 17, 19). The circular permutation of a FRET acceptor protein, the insertion of fluorescent proteins into the binding protein, and the truncation of the linker moiety have all been found to improve molecular sensors based on fluorescent proteins (4, 21) and to allow the relative orientation between fluorescent proteins to be optimized.
In the present study, the direct fusion of the mature MBP to two GFP variants generated only a small change in the 530/480 nm emission ratio (≈0.05), confirming a previous report of a nonsignificant ratio change with direct fusion, whereas the deletion of the first five amino acids in the mature MBP produced an increase in the emission ratio (≈0.2) (7). In this study, the insertion of optimized dipeptide linkers enabled a maximum change in the ratio of up to 0.5 without a significant change in the affinity level (Table 1), demonstrating that the MBP motion was transformed more efficiently to changes in the distance and/or the relative orientation of the FRET pairs by optimizing the linkers. When the linker effects were analyzed from the structural aspect through molecular dynamic simulations, the composite linker moiety with the Leu-His peptide resulted in a helical structure (Fig. 1C, inset), which contributed to the stiffness of the linker moiety, rendering a more intimate physical cooperation between the MBP and the fluorescent proteins. Although this optimization of the linker moiety affected both the distance and the relative orientation between the fluorescent proteins, the more significant effect may have been the change in orientation, as the angular orientation at the linker ends is sensitive to change with an extension of the helical secondary structure, i.e., 100° per residue in an α helix.
MBP-ligand complexes are known to use two binding conformations, the R and B modes, depending on the types of the bound substrates (5). Previous structural and mechanistic studies have suggested that Trp62 in the binding pocket is partially exposed to the solvent and far from the C-terminal domain with an open-structure MBP yet is directed toward the inner curvature of the ribbon-like maltose structure, permitting a hydrogen bond between the ring nitrogen and the 3-hydroxyl group of the second glucose unit (5). Thus, the large increase in the Kd value of up to 225 μM that occurred when Trp62 was mutated to Ala (W62A) was interpreted as the result of a reduced closing movement in the MBP, accompanied by a deterioration in the signal intensity to below half (7).
In the present study, the CMY-LH sensor with the W62A mutation was also accompanied by a 40% decrease in the signal intensity, which agreed well with previous reports. However, in contrast to the Ala mutations, the Leu and His mutations exhibited 200% and 140% increased signal intensities, respectively, compared to that for CMY-LH, suggesting that the changes in the signal intensity were not fully consistent with a reduced closing movement in the B mode binding of the MBP.
As mentioned in Results, structure-based rational design and directed evolution have already been successfully applied to engineer new binding specificities for periplasmic binding proteins (6, 10). Furthermore, in this study, the effects of the optimized linkers on the signal intensity were robustly conserved throughout the redesign of the binding site, thereby allowing the creation of highly responsive FRET sensors with broadened specificities (see Fig. S1B in the supplemental material).
When they were applied in vivo, the developed sensors produced highly responsive FRET images of the maltose uptake in yeast cells, demonstrating the usefulness of protein sensors with increased signal intensities and newly designed binding sites. Consequently, this study showed that the high sensitivity of a fusion protein with optimized linkers can facilitate new and more-detailed analyses of sugars in living cells and possibly other substances. According to the putative combinatorial efficacy of the system and the modularity of the binding protein moiety, the overall strategy of this study could be applied for other FRET sensors, based on periplasmic binding proteins with similar hinge-type motions.
Supplementary Material
Acknowledgments
We thank Hyeon-Su Ro and Hak-Sung Kim for comments on the genetics of Saccharomyces cerevisiae and reading the manuscript.
This work was supported by a grant (code no. 20050301034476) from the Biogreen 21 Program, Rural Development Administration, Republic of Korea, and by a grant from the KRIBB Research Initiative Program.
Footnotes
Published ahead of print on 21 September 2007.
Supplemental material for this article may be found at http://aem.asm.org/.
REFERENCES
- 1.Allen, G. J., J. M. Kwak, S. P. Chu, J. Llopis, R. Y. Tsien, J. F. Harper, and J. I. Schroeder. 1999. Cameleon calcium indicator reports cytoplasmic calcium dynamics in Arabidopsis guard cells. Plant J. 19:735-747. [DOI] [PubMed] [Google Scholar]
- 2.Crumplen, R. M., J. C. Slaughter, and G. G. Stewart. 1996. Characteristics of maltose transporter activity in an ale and large strain of the yeast Saccharomyces cerevisiae. Lett. Appl. Microbiol. 23:448-452. [DOI] [PubMed] [Google Scholar]
- 3.de Lorimier, R. M., J. J. Smith, M. A. Dwyer, L. L. Looger, K. M. Sali, C. D. Paavola, S. S. Rizk, S. Sadigov, D. W. Conrad, L. Loew, and H. W. Hellinga. 2002. Construction of a fluorescent biosensor family. Protein Sci. 11:2655-2675. [DOI] [PMC free article] [PubMed] [Google Scholar]
- 4.Deuschle, K., S. Okumoto, M. Fehr, L. L. Looger, L. Kozhukh, and W. B. Frommer. 2005. Construction and optimization of a family of genetically encoded metabolite sensors by semirational protein engineering. Protein Sci. 14:2304-2314. [DOI] [PMC free article] [PubMed] [Google Scholar]
- 5.Duan, X., J. A. Hall, H. Nikaido, and F. A. Quiocho. 2001. Crystal structures of the maltodextrin/maltose-binding protein complexed with reduced oligosaccharides: flexibility of tertiary structure and ligand binding. J. Mol. Biol. 306:1115-1126. [DOI] [PubMed] [Google Scholar]
- 6.Dwyer, M. A., L. L. Looger, and H. W. Hellinga. 2004. Computational design of a biologically active enzyme. Science 304:1967-1971. [DOI] [PubMed] [Google Scholar]
- 7.Fehr, M., W. B. Frommer, and S. Lalonde. 2002. Visualization of maltose uptake in living yeast cells by fluorescent nanosensors. Proc. Natl. Acad. Sci. USA 99:9846-9851. [DOI] [PMC free article] [PubMed] [Google Scholar]
- 8.Fehr, M., S. Lalonde, I. Lager, M. W. Wolff, and W. B. Frommer. 2003. In vivo imaging of the dynamics of glucose uptake in the cytosol of COS-7 cells by fluorescent nanosensors. J. Biol. Chem. 278:19127-19133. [DOI] [PubMed] [Google Scholar]
- 9.Giuliano, K. A., P. L. Post, K. M. Hahn, and D. L. Taylor. 1995. Fluorescent protein biosensors: measurement of molecular dynamics in living cells. Annu. Rev. Biophys. Biomol. Struct. 24:405-434. [DOI] [PubMed] [Google Scholar]
- 10.Guntas, G., T. J. Mansell, J. R. Kim, and M. Ostermeier. 2005. Directed evolution of protein switches and their application to the creation of ligand-binding proteins. Proc. Natl. Acad. Sci. USA 102:11224-11229. [DOI] [PMC free article] [PubMed] [Google Scholar]
- 11.Honda, A., S. R. Adams, C. L. Sawyer, V. Lev-Ram, R. Y. Tsien, and W. R. Dostmann. 2001. Spatiotemporal dynamics of guanosine 3′,5′-cyclic monophosphate revealed by a genetically encoded, fluorescent indicator. Proc. Natl. Acad. Sci. USA 98:2437-2442. [DOI] [PMC free article] [PubMed] [Google Scholar]
- 12.Hwang, Y. C., W. Chen, and M. V. Yates. 2006. Use of fluorescence resonance energy transfer for rapid detection of enteroviral infection in vivo. Appl. Environ. Microbiol. 72:3710-3715. [DOI] [PMC free article] [PubMed] [Google Scholar]
- 13.Kerr, R., V. Lev-Ram, G. Baird, P. Vincent, R. Y. Tsien, and W. R. Schafer. 2000. Optical imaging of calcium transients in C. elegans neurons and pharyngeal muscle. Neuron 26:583-594. [DOI] [PubMed] [Google Scholar]
- 14.Lager, I., M. Fehr, W. B. Frommer, and S. Lalonde. 2003. Development of a fluorescent nanosensor for ribose. FEBS Lett. 553:85-89. [DOI] [PubMed] [Google Scholar]
- 15.Lakowicz, J. 1999. Principles of fluorescence spectroscopy. Kluwer Academic/Plenum Publishers, New York, NY.
- 16.Lissandron, V., A. Terrin, M. Collini, L. D'alfonso, G. Chirico, S. Pantano, and M. Zaccolo. 2005. Improvement of a FRET-based indicator for cAMP by linker design and stabilization of donor-acceptor interaction. J. Mol. Biol. 354:546-555. [DOI] [PubMed] [Google Scholar]
- 17.Medintz, I. L., A. R. Clapp, J. S. Melinger, J. R. Deschamps, and H. Mattoussi. 2005. A reagentless biosensing assembly based on quantum dot-donor Förster resonance energy transfer. Adv. Mater. 17:2450-2455. [Google Scholar]
- 18.Miyawaki, A. 2003. Visualization of the spatial and temporal dynamics of intracellular signaling. Dev. Cell 4:295-305. [DOI] [PubMed] [Google Scholar]
- 19.Miyawaki, A., J. Llopis, R. Heim, J. M. McCafferty, J. M. Adams, M. Ikura, and R. Y. Tsien. 1997. Fluorescent indicators for Ca2+ based on green fluorescent proteins and calmodulin. Nature 388:882-887. [DOI] [PubMed] [Google Scholar]
- 20.Mochizuki, N., S. Yamashita, K. Kurokawa, Y. Ohba, T. Nagai, A. Miyawaki, and M. Matsuda. 2001. Spatio-temporal images of growth-factor-induced activation of Ras and Rap1. Nature 411:1065-1068. [DOI] [PubMed] [Google Scholar]
- 21.Nagai, T., S. Yamada, T. Tominaga, M. Ichikawa, and A. Miyawaki. 2004. Expanded dynamic range of fluorescent indicators for Ca2+ by circularly permuted yellow fluorescent proteins. Proc. Natl. Acad. Sci. USA 101:10554-10559. [DOI] [PMC free article] [PubMed] [Google Scholar]
- 22.Novak, S., Z.-K. V., and V. Maric. 2004. Regulation of maltose transport and metabolism in Saccharomyces cerevisiae. Food Technol. Biotechnol. 42:213-218. [Google Scholar]
- 23.Okumoto, S., L. L. Looger, K. D. Micheva, R. J. Reimer, S. J. Smith, and W. B. Frommer. 2005. Detection of glutamate release from neurons by genetically encoded surface-displayed FRET nanosensors. Proc. Natl. Acad. Sci. USA 102:8740-8745. [DOI] [PMC free article] [PubMed] [Google Scholar]
- 24.Sato, M., N. Hida, T. Ozawa, and Y. Umezawa. 2000. Fluorescent indicators for cyclic GMP based on cyclic GMP-dependent protein kinase I alpha and green fluorescent proteins. Anal. Chem. 72:5918-5924. [DOI] [PubMed] [Google Scholar]
- 25.Sato, M., Y. Ueda, M. Shibuya, and Y. Umezawa. 2005. Locating inositol 1,4,5-trisphosphate in the nucleus and neuronal dendrites with genetically encoded fluorescent indicators. Anal. Chem. 77:4751-4758. [DOI] [PubMed] [Google Scholar]
- 26.Sohn, J. H., E. S. Choi, B. H. Chung, D. J. Youn, J. H. Seo, and S. K. Rhee. 1995. Process development for the production of recombinant hirudin in Saccharomyces cerevisiae: from upstream to downstream. Proc. Biochem. 30:653-660. [Google Scholar]
- 27.Tanimura, A., A. Nezu, T. Morita, R. J. Turner, and Y. Tojyo. 2004. Fluorescent biosensor for quantitative real-time measurements of inositol 1,4,5-trisphosphate in single living cells. J. Biol. Chem. 279:38095-38098. [DOI] [PubMed] [Google Scholar]
- 28.Zaccolo, M. 2004. Use of chimeric fluorescent proteins and fluorescence resonance energy transfer to monitor cellular responses. Circ. Res. 94:866-873. [DOI] [PubMed] [Google Scholar]
- 29.Zaccolo, M., F. De Giorgi, C. Y. Cho, L. Feng, T. Knapp, P. A. Negulescu, S. S. Taylor, R. Y. Tsien, and T. Pozzan. 2000. A genetically encoded, fluorescent indicator for cyclic AMP in living cells. Nat. Cell Biol. 2:25-29. [DOI] [PubMed] [Google Scholar]
- 30.Zhang, J., R. E. Campbell, A. Y. Ting, and R. Y. Tsien. 2002. Creating new fluorescent probes for cell biology. Nat. Rev. Mol. Cell Biol. 3:906-918. [DOI] [PubMed] [Google Scholar]
Associated Data
This section collects any data citations, data availability statements, or supplementary materials included in this article.