

Abstract
A central question in developmental biology is how cells interact to organize into tissues? In this paper, we study the role of mesenchyme-ectoderm interaction in the growing chick limb bud using Glazier and Graner's cellular Potts model, a grid-based stochastic framework designed to simulate cell interactions and movement. We simulate cellular mechanisms including cell adhesion, growth, and division and diffusion of morphogens, to show that differential adhesion between the cells, diffusion of growth factors through the extracellular matrix, and the elastic properties of the apical ectodermal ridge together can produce the proper shape of the limb bud.
Keywords: Cellular Potts model, Cell adhesion, Chick limb growth, Apical ectodermal ridge, Fibroblast growth factor, CompuCell3D
1. Introduction and biology
The chick Gallus gallus is a major model organism in developmental biology. As a common and accessible source of embryos, chicks attracted the interest of the ancient Egyptians, as well as of Hippocrates and Aristotle. Aristotle's studies influenced embryologists until the 17th century, including Albertus Magnus, Harvey, Malpighi, von Haller, and Wolff [1]. Embryology progressed in the 19th century, partly thanks to technical advances applied to the chick embryo (Pander and von Baer, followed by von Ebner, Hensen, Rauber, Koller, and Remak). Modern developmental biology was born at the beginning of the 20th century, when experimental embryology combined with developmental genetics (Roux and Morgan). The chick remained important to experimental embryology at this time (Rawles, Fell, Rudnick, Gräper, Wetzel, Adelmann, Pannett, Huxley, De Beer, Weiss, and Waddington). From the 1940s to the 1970s, studies of chick development lost momentum as attention shifted to model organisms such as Xenopus laevis which were better suited to early molecular biology methods. New technologies, including in vivo electroporation, embryonic stem cell separation, transgenesis, and the completion of the chick genome sequence, have restored the appeal of this versatile experimental organism [2].
Limb development is an excellent model of vertebrate embryo patterning [3]. Chick embryos permit manipulation of the developing limb in vitro or through a window in the egg shell in vivo. Saunders' two key experiments on limb development in the chick showed that the removal of the apical ectodermal ridge (AER), a narrow band of specialized ectodermal cells located at the tip of the growing bud [4], caused distal truncations in the limb [5], and that the grafting of the posterior zone of polarizing activity (ZPA) to the anterior margin led to the development of additional digits [6]. These experiments defined the cell interactions in the developing limb that control growth and patterning along each of the three limb axes, and led to the formulation of various models of these interactions [7-9].
Hamburger and Hamilton published a detailed atlas of the stages of chick development [10]. The mesenchymal tissue of the early limb bud forms a paddle-shaped mesoblast with a surrounding layer of epithelium (the ectoderm), as shown in Fig. 1. The interaction of the distal portion of the mesoblast (the apical zone) with the AER drives proximodistal development of the chick limb bud. The AER secretes diffusing fibroblast growth factors (FGF) [11], which keep the apical-zone mesenchyme in a noncondensed and proliferating state [12,13], control cell division [14,15], and shape the bud [9].
Fig. 1.
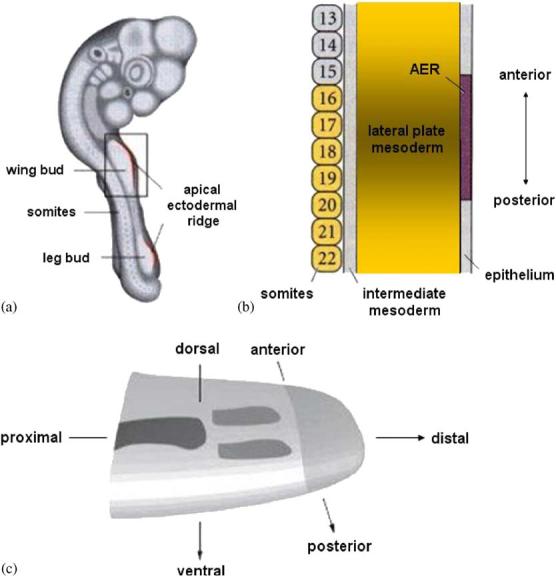
(a) The chick embryo at Hamburger and Hamilton stage 18. The rectangle encloses the area shown in panel (b). The embryo is approximately 7–8 mm long, and the width of the limb bud (∼1 mm) remains almost constant as the limb grows. Adapted, with changes, from Ref. [29]. (b) A larger picture of the chick wing bud at Hamburger and Hamilton stage 16, showing somite numbers, mesoderm, and ectoderm. Adapted, with changes, from Ref. [29]. (c) A sketch of the embryonic limb bud showing the major axes, the apical zone (light grey), precartilage condensations (medium grey), and cartilage (dark grey). Adapted, with changes, from Ref. [30].
Formation of the limb bud starts when the lateral plate mesoderm cells in the animal's flank begin to proliferate, approximately 1.5 days after fertilization [16-18]. Mesenchymal cells secrete FGF10, the key mesenchymal factor in limb bud initiation, which induces formation of the AER [19,20]. The AER then sustains the outgrowth of the limb by secreting FGF8 [21]. Application of FGF8 to the flank of young chick embryos induces the development of additional limbs [21]. Moreover, FGF8 can replace the AER to maintain limb growth, while misexpression of FGF8 causes severe limb truncations [21]. FGF8 also maintains secretion of FGF10 in the mesenchyme, and positive feedback between FGF8 and FGF10 is essential for continuous growth of the chick limb [22]. Thus, FGF8 appears to be the key molecule in outgrowth and patterning of the developing vertebrate limb [21]. Applying beads soaked in FGF1, FGF2 and FGF4 to the flank also induces additional limbs [23]. However, biochemical and expression studies suggest that none of these is the endogenous signal that initiates limb development [21].
Four days after fertilization, the mesenchymal cells condense and begin to form cartilage. Skeletogenic condensation is a multistep process that requires initiation, establishment of boundary conditions, cell adhesion, proliferation, growth, and cessation of growth (for a review, see Ref. [24]). Extracellular matrix (ECM) macromolecules, such as fibronectin, tenascin and transforming growth factor β (TGFβ), accumulate at sites of precartilage condensation changing cell-ECM interaction [25,26]. To explain skeletogenesis we must find a dynamical model of the spatio-temporal distribution of these molecules that can generate the skeleton [27]. If skeletogenesis involves a Turing instability of reacting and diffusing chemicals [28], we must model its boundary conditions (the dynamics of limb shaping, cell division, and cell growth), which control where and how the cells aggregate [27,30,31].
The ZPA regulates anteroposterior limb patterning by secreting sonic hedgehog (Shh) [32]. Shh initiates and regulates expression of secondary signaling molecules, including bone morphogenetic protein 2 (BMP2) in the mesoderm and FGF4 in the posterior part of the AER [33]. BMP2 mediates long-range effects of Shh, while FGF4 maintains the production of Shh in the ZPA. Fig. 2 shows the expression of FGF8 in the AER, and the schematic interaction between the mesenchyme, AER, and ZPA. We know less about patterning across the dorsoventral axis. Experiments suggest a role for ectodermal signalling involving Wnt7a [34] which also helps maintain Shh expression in posterior mesenchyme [35].
Fig. 2.
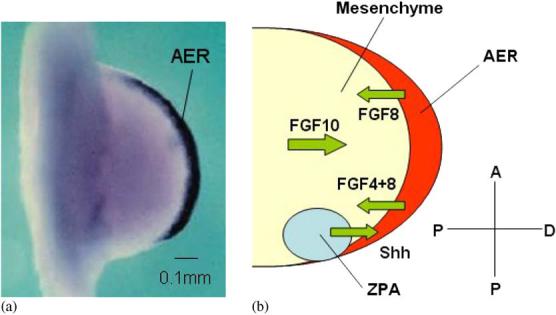
(a) Expression of FGF8 (black) in the AER of a Hamburger and Hamilton stage 21 chick wing bud. Adapted, with changes, from Ref. [21]. (b) Schematic representation of the interaction between the AER, ZPA, and mesenchyme in the early chick limb.
In this paper we concentrate on the shape of the growing chick limb bud. We assume that the AER secretes FGF8 (which decays with a given life-time in mesenchymal tissue) at a constant rate, to account for the regulatory role of FGF10. FGF8 diffuses into the underlying mesenchyme and induces the cells to grow and divide. We omit the role of the ZPA and condensation, leaving the anterior-posterior asymmetry, as well as cartilage formation, to future work. For simplicity, we also assume that the limb bud is dorsoventral symmetric. We show that cell adhesion and growth together with diffusion and decay of FGF8 can generate the proper shape of the bud, if we choose the physical parameters properly. We also show that the AER is crucial not only for maintaining the outgrowth of the limb (a permissive function), but also for forming the desired shape (an instructive function).
2. Computational model
Our simulations use CompuCell3D [36-41], a multi-model software framework for simulation of the development of multicellular organisms (morphogenesis). CompuCell3D models the interaction of the gene regulatory network with cellular mechanisms such as cell adhesion, growth, and division, diffusion of morphogens, chemotaxis (movement of cells along a gradient of a chemical diffusing in the ECM), and haptotaxis (movement of cells due to changes in cell-cell and cell-ECM adhesion which depend on the concentration of cell adhesion molecules). CompuCell3D implements Glazier and Graner's cellular Potts model (CPM) [42], a grid-based, stochastic model, which describes biological mechanisms in terms of effective interactions and constraint energies [43]. Some recent applications of the CPM include studies of chicken retinal cells [44], Dictyostelium discoideum [45], cancer invasion [46], flowing foams [47,48], and viscous flow [49].
N spatially distributed cells, indexed by σ, lie on a lattice, and the value at a lattice site (pixel) (i, j, k) is σ if this site lies in cell σ. A collection of connected lattice sites with the same index represents a cell. The evolution of the cells follows modified Monte Carlo–Boltzmann–Metropolis dynamics [42,43], with the cells rearranging their positions to minimize their total free energy [50].
In our simulations, the CPM Hamiltonian includes three main terms:
| (1) |
where τ denotes the type of a cell. The first term describes the surface adhesion energy between cells and between cells and their environment, and the surface tension coefficients are symmetric, Jτ,τ′ = Jτ′,τ The second term corresponds to the compressibility of the cells: V is the actual volume of a cell Vt its target volume. We simulate growth of the cells by increasing their Vt. The third term represents the elasticity of the cell membrane: S is the surface area of a cell and St its target surface area. In a two-dimensional CPM we omit V and Vt, as in Refs. [42,43]. The volume constraint prevents cell disappearance, and the surface term fixes the average shape of the cells. We use the simplest form of surface term [36,37], although a term of form is more consistent with classical elasticity [51].
At each step we randomly select a lattice site (i, j, k) and change its value from σ to the index of an arbitrary lattice site from the first-order neighborhood (a lattice site which is connected to a given pixel by a side) σ′, with a probability P:
| (2) |
where ΔH is the difference in energy produced by the change, θ is the Heaviside step function, and T is a parameter (“temperature”) corresponding to the amplitude of cell membrane fluctuations [52]. To calculate the energy resulting from cell–cell adhesion interactions we consider first and second nearest neighbors, which reduces lattice anisotropy effects compared to first nearest-neighbor calculations. One Monte Carlo step (MCS) corresponds to n flip attempts, where n is the total number of lattice sites.
Our simplified limb bud includes five types of cells: mesenchyme (M), AER (A), regular ectoderm (e), regular mesoderm (m), and the medium (w) in which the bud is immersed. The AER secrets a growth factor (FGF8) which diffuses into the mesenchyme and mesoderm. The secretion occurs at a constant rate s, in any pixel containing the center of mass of an AER cell. The constancy of s ensures that the length of the apical zone, where the mesenchymal cells grow and divide, remains approximately constant [53]. We implement diffusion on the CPM lattice using the forward Euler method at each MCS. We use no-flux boundary conditions at the walls of the box which contains the growing limb, and at the boundary between the limb and the medium. The mesenchymal cells respond to the FGF8 concentration and grow at a rate proportional to this concentration,
| (3) |
where a is a constant. We do not impose a priori any growth on the AER, ectodermal, and mesodermal cells,
| (4) |
In fact, the AER cells do not grow [9,54]. Our simulations show (see the next section) that large JMw induces the ectodermal cells to grow and divide so that a constant monolayer remains on the surface of the bud.
Fig. 3(a) shows the initial (3D) configuration. The dimensions of the box (in pixels) are 275 × 200 × 25 (the z-axis being perpendicular to the page). For simplicity, this configuration is dorsoventral symmetric, which means that the AER is represented by a thin plate rather than a stripe. Each cell initially occupies a cube 5 × 5 × 5 pixels, and 1 pixel approximately corresponds to 2 μm. A cell which doubles its volume with respect to its initial value, i.e., reaches V = 250, undergoes mitosis and splits into two cells with equal volumes. We estimate the diffusion constant for FGF8 moving in the ECM from the Einstein formula,
| (5) |
where kB is the Boltzmann constant, Ta is the absolute temperature, and kdrag is the drag coefficient in the relation between the drag force acting on a body moving slowly in a viscous fluid and the velocity of the body, Fvisc = kdragv. For a spherical body kdrag = 6πηR, where η is the viscosity of the fluid, and R is the radius of the body.
Fig. 3.
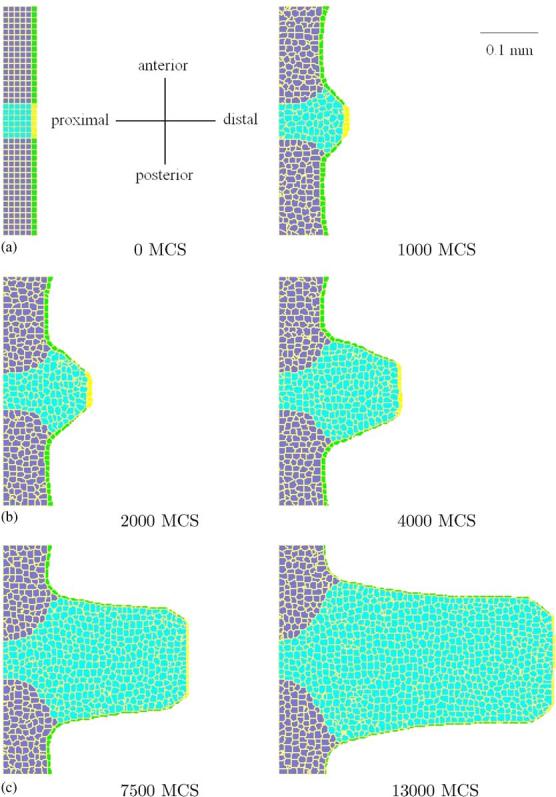
3D simulation of the growth of the chick limb bud (2D sections at z = 12). The bud consists of: the growing mesenchyme (light blue), AER (yellow), regular ectoderm (green), and mesoderm (blue), immersed in medium (white). The width of the bud is ∼4 times smaller than in reality, as expected: (a) 0 MCS, (b) 1000 MCS, (c) 2000 MCS, (d) 4000 MCS, (e) 7500 MCS, and (f) 13 000 MCS.
For FGF8, which is an average-size protein, we have R∼10−9 m. In limb bud ECM we have η∼102 kg=ms2 [55,56]. Therefore, at room temperature we estimate DFGF8∼2 × 10⁻¹⁵ m2/s. The diffusion constant sets the time scale of our simulations, which measure time in Monte Carlo steps, and distances in pixels. We set 1 MCS ∼1 min, which yields D∼0.1 pixel2/MCS. Experiment shows that the proximodistal size of the apical zone L is approximately 200 μm [53]. Our simulations set this length by appropriately chosing the FGF8 decay constant, kFGF8. From the diffusion equation we obtain the following relation:
| (6) |
which also results from a simple dimensional analysis [30]. In the simulation shown in Fig. 3, we chose k = 0.001 MCS−1, which corresponds to L∼50 μm. Rescaling the length of the apical zone to the value four times smaller than the experimental one greatly speeds up our simulations. However, it should also produce the limb bud four times smaller (the cells keep their real size). This rescaling changes the relation between the CPM parameters and the corresponding physical values, if their units contain time (such as viscosity), since the time scale is set by the diffusion constant, but does not change the dynamics of limb growth.
3. Results and discussion
All parameters appearing in formulae (1)–(3) have CPM units (pixels, MCS). The “temperature” T sets the values for the surface adhesion coefficients Jττ′ and the volume constraint coefficient λV. Here, we choose these values to prevent cells from disappearing or freezing, and use the hierarchy of surface adhesion coefficients to keep the cells from desorting. Thus, for each pair of cell types τ and τ′ we set Jττ < Jττ′ and Jτ′τ′. We remind the reader that, in the CPM, stronger adhesion corresponds to a lower value of J. Moreover, JAA must be very low so that the AER does not break. The same is true for Jee, although Jee can be larger than JAA since the ectoderm stretches during limb outgrowth. Since embryonic tissues are viscoelastic materials, we could, in principle, obtain their surface adhesion coefficients from parallel plate compression experiment [57-60]. Moreover, we could find the shear modulus which sets the value of λS, and viscosity. Of the surface tension coefficients, we know so far only JMM [56,59]. The values of s and a are not independent, since their products drives the growth of the mesodermal cells. Thus, without loss of generality we may set s = 1, and we choose a = 4 so that the interval between cell divisions is of the order of 10 h which is consistent with the actual duration of the chick limb mesenchymal cell cycle, which is 13–14 h [61].
We use the following values for the cell–cell and cell–medium adhesion coefficients, which satisfy the above inequalities:
| (7) |
They are of the same order of magnitude as those in Ref. [62]. We also set T = 30 following the same reference. Our choice of parameters is somewhat arbitrary and only experimentation can provide their exact relative values. The initial value of Vt for all cells is equal to the initial volume, 125, and we keep constant, so that the cells remain round and do not stiffen as they grow. We chose λS= 0.1 which suffices to round the cells. For all types λV = 5, except for the AER which has λV = 10. For these parameters, the AER is less elastic than other tissues, preventing the ridge from stretching and increasing the size of the apical zone, which would result in a bulbous bud [9]. We treat the medium as a large cell without volume or surface constraints.
Fig. 3 shows the results of the corresponding simulation. The width initially grows rapidly, but the growth decreases and the width remains approximately constant. At Hamburger and Hamilton stage 17, which the chick passes between 52 and 64 h after fertilization, both wing and leg buds lift off the blastoderm. This moment corresponds to 0 MCS in our simulation. At stage 23, after approximately four days, both buds are approximately as long as they are wide. In our simulation, this stage corresponds to ∼5000 MCS and the width is approximately 100 pixels which is in agreement with the expected value of 200 μm. Thus, 5000 MCS correspond to 1.5 days, giving the relation 1 MCS ∼0.5 min which is consistent with the relation we obtained by setting the CPM value of the diffusion constant (1 MCS ∼1 min). In Fig. 4 we show the configuration at 1000 MCS (from a different simulation) and the corresponding FGF8 concentration distribution, to demonstrate the underlying factors shaping the bud.
Fig. 4.
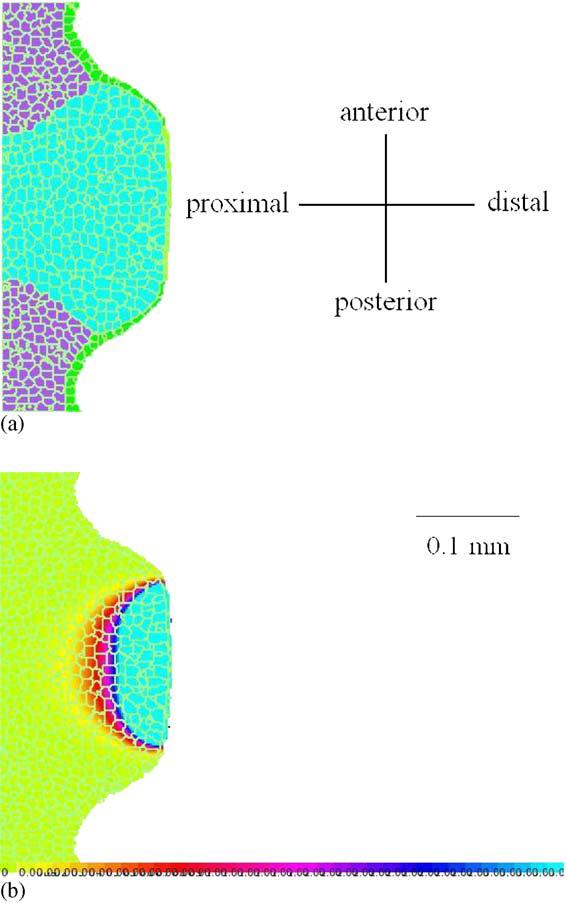
Early stage of 3D limb bud growth (a), and the corresponding FGF8 concentration distribution (b), shown as 2D sections at z = 12. Only the cells in the apical zone with a high concentration of FGF8 grow, generating mainly proximo-distal expansion of the bud.
The most important parameters in our simulation are: the rate of FGF8 secretion, its diffusion constant, and its decay constant. The first two cannot be too small, nor the last one too large, otherwise the FGF8 concentration will not suffice to make the mesenchyme cells grow. However, if one of the first two parameters is too large, or the decay constant is too small, the anteroposterior size of the apical zone increases, resulting in a bulbous bud, as in Fig. 5. The AER cells must not grow or divide, otherwise, even for slow growth, the size of the apical zone would grow due to the increasing number of AER cells secreting FGF8 (Fig. 6). For the same reason, the values of λV and λS for the AER cannot be too small. We repeated this simulation for different values of Jik, λV , and λS, obtaining similar shapes of bud.
Fig. 5.
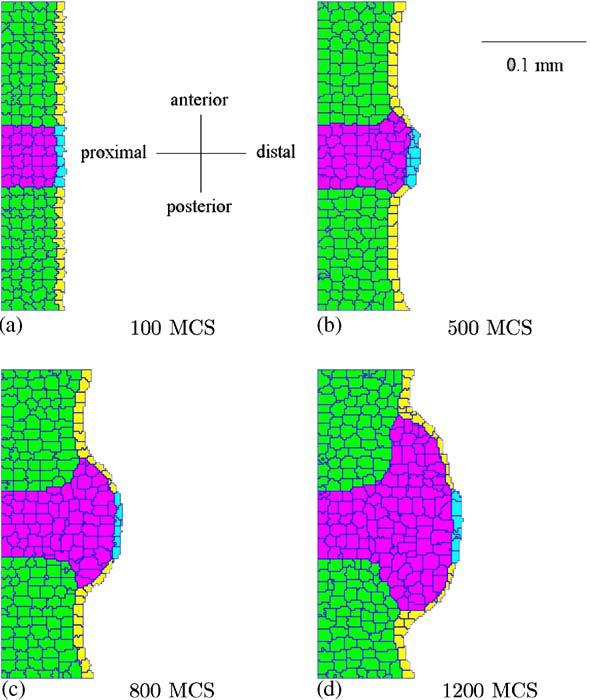
Simulation of excessively fast growth of the chick limb bud. The bud becomes bulbous, instead of paddle-like: (a) 100 MCS, (b) 500 MCS, (c) 800 MCS, and (d) 1200 MCS.
Fig. 6.
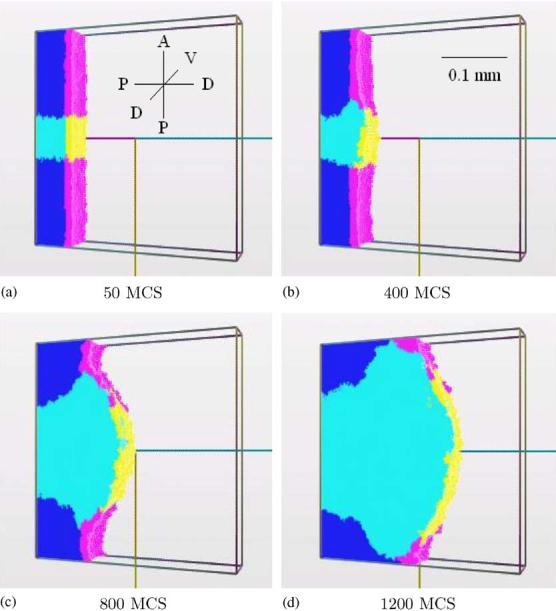
Simulation of the growth of the chick limb bud, including the AER growth. The shape of the bud is again bulbous: (a) 50 MCS, (b) 400 MCS, (c) 800 MCS, and (d) 1200 MCS.
Fig. 3 also shows the effects of lattice anisotropy on the shape of the limb. The tip of the bud initially aligns with the AER at an angle of 45°, forming a trapezoid. In time, the angle of alignment increases since only the most distal cells grow. Eventually, the tip becomes a polygon with more sides, while the rest of the bud remains smooth. This anisotropy appears when we limit spin flips in the CPM to nearest neighbors. To resolve this problem, we could extend spin flips to the second-order and third-order neighborhood (lattice sites which are connected to a given pixel by an edge and a corner, respectively).
In Fig. 7 we present the time-dependence of the length and width of the limb, and the length of the AER. The length of the bud is approximately a linear function of time, which is consistent with our assumption of a constant secretion of FGF8 and of mesenchymal growth proportional to the FGF8 concentration. We measure the width of the bud as the maximal width of the mesenchyme. It increases most rapidly at the beginning. Later, growth slows to zero since the proximal mesenchyme ceases to grow. The length of the AER behaves similarly, except it grows fastest growth a little later.
Fig. 7.
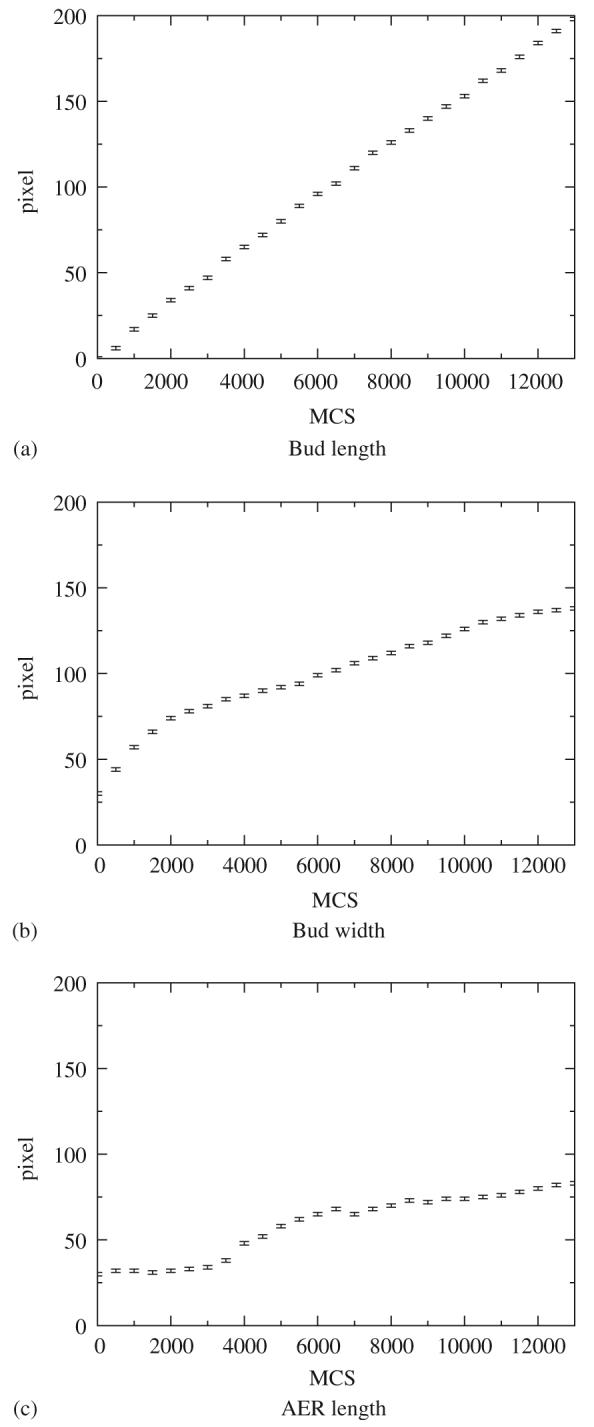
The time dependence of: the length of the limb bud (a), its width (b), and the length of the AER (c): (a) Bud length, (b) Bud width, and (c) AER length.
Finally, Fig. 8 compares the length to width ratio with the experimental data for the chick wing from the paper of Haburger and Hamilton [10] (the data for the chick leg are similar). Our results are quite consistent with these data. We are currently considering experiments which will provide more information about the actual time-dependence of the size and shape of the limb [63].
Fig. 8.
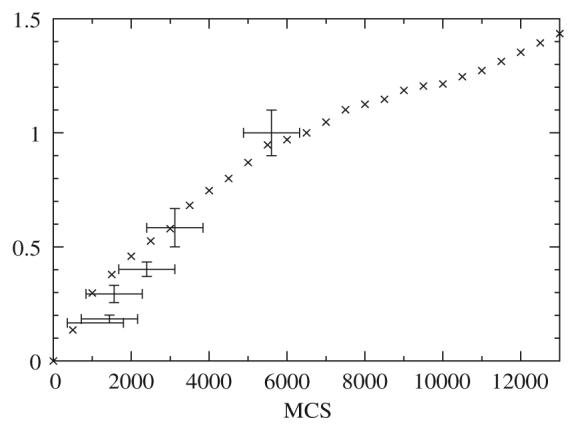
The time dependence of the length/width ratio (cross signs) compared to the experimental values for the chick wing at Hamburger and Hamilton stages 18–23 (bars).
4. Summary
We have demonstrated that the differential adhesion between cells and diffusion of morphogens regulating cell growth can generate the paddle shape of the chick limb bud. We used a simple model of limb growth with only one morphogen (FGF8), and assumed that the cells did not differentiate. The next step is to include the condensation of mesenchyme cells into cartilage. We know that differential adhesion of cells, together with chemotaxis, leads to density-dependent patterns consistent with experiment [31]. Moreover, we need to include the anteroposterior asymmetry by introducing the ZPA, and use a realistic shape for the AER, with interaction between FGF8 and FGF10 instead of a constant rate of the FGF8 production. Combining the two mechanisms (condensation and diffusion of morphogens), we hope to obtain a realistic cartilage pattern in the chick limb (humerus, ulna/radius, and three digits).
Acknowledgments
This work was sponsored by National Institutes of Health, National Institute of General Medical Sciences, 1R01 GM076692-01, an Indiana Special State Research Funding, an Indiana University Pervasive Technologies Laboratories Fellowship, an IBM Innovation Institute Award, NASA Glenn Research Center, NAG 2-1619, National Science Foundation, IBN-0083653, the College of Arts and Sciences at Indiana University, the Office of the Vice President for Research, Indiana University, and the Biocomplexity Institute, Indiana University.
References
- 1.Wolpert L. Mech. Dev. 2004;121:1015. doi: 10.1016/j.mod.2004.04.021. [DOI] [PubMed] [Google Scholar]
- 2.Stern CD. Dev. Cell. 2005;8:9. doi: 10.1016/j.devcel.2004.11.018. [DOI] [PubMed] [Google Scholar]
- 3.Tickle C. Int. J. Dev. Biol. 2000;44:101. [PubMed] [Google Scholar]
- 4.Zwilling E, Hansborough L. J. Exp. Zool. 1956;132:219. [Google Scholar]
- 5.Saunders JW. J. Exp. Zool. 1948;108:363. doi: 10.1002/jez.1401080304. [DOI] [PubMed] [Google Scholar]
- 6.Saunders JW, Gasseling M, Cairns JM. Dev. Biol. 1959;1:281. [Google Scholar]
- 7.Wolpert L. Principles of Development. University Press; Oxford: 2002. [Google Scholar]
- 8.Gilbert SF. Developmental Biology. Sinauer Associates; Sunderland, MA: 1994. [Google Scholar]
- 9.Tickle C. On Growth and Form. In: Chaplain MAJ, Singh GD, McLachlan JC, editors. Spatio-temporal Pattern Formation in Biology. Wiley; New York, NY: 1999. pp. 13–29. [Google Scholar]
- 10.Hamburger V, Hamilton HL. J. Morphol. 1951;88:49. [PubMed] [Google Scholar]
- 11.Martin GR. Genes Dev. 1998;12:1571. doi: 10.1101/gad.12.11.1571. [DOI] [PubMed] [Google Scholar]
- 12.Kosher RA, Savage MP, Chan SC. J. Embryol. Exp. Morphol. 1979;50:75. [PubMed] [Google Scholar]
- 13.Summerbell D. J. Embryol. Exp. Morphol. 1974;32:651. [PubMed] [Google Scholar]
- 14.Niswander L, Tickle C, Vogel A, Booth I, Martin GR. Cell. 1993;75:579. doi: 10.1016/0092-8674(93)90391-3. [DOI] [PubMed] [Google Scholar]
- 15.Fallon JF, Lopez A, Ros MA, Savage MP, Olwin BB, Simandl BK. Science. 1994;264:104. doi: 10.1126/science.7908145. [DOI] [PubMed] [Google Scholar]
- 16.Martin GR. Genes Dev. 1998;12:1571. doi: 10.1101/gad.12.11.1571. [DOI] [PubMed] [Google Scholar]
- 17.Johnson RL, Tabin CJ. Cell. 1997;90:979. doi: 10.1016/s0092-8674(00)80364-5. [DOI] [PubMed] [Google Scholar]
- 18.Rubin L, Saunders JW. Dev. Biol. 1972;28:94. doi: 10.1016/0012-1606(72)90129-7. [DOI] [PubMed] [Google Scholar]
- 19.Sekine K, Ohuchi H, Fujiwara M, Yamasaki M, Yoshizawa M, Sato T, Yagishita N, Matsui D, Koga Y, Itoh N, Kato S. Nat. Gen. 1999;21:138. doi: 10.1038/5096. [DOI] [PubMed] [Google Scholar]
- 20.Ohuchi H, Nakagawa T, Yamamoto A, Araga A, Ohata T, Ishimaru Y, Yoshioka H, Kuwana T, Nohno T, Yamasaki M, Itoh N, Noji S. Development. 1997;124:2235. doi: 10.1242/dev.124.11.2235. [DOI] [PubMed] [Google Scholar]
- 21.Vogel A, Rodriguez C, Izpisua-Belmonte JC. Development. 1996;122:1737. doi: 10.1242/dev.122.6.1737. [DOI] [PubMed] [Google Scholar]
- 22.Xu X, Weinstein M, Li C, Naski M, Cohen RI, Ornitz DM, Leder P, Deng C. Development. 1998;125:753. doi: 10.1242/dev.125.4.753. [DOI] [PubMed] [Google Scholar]
- 23.Cohn MJ, Izpisua-Belmonte JC, Abud H, Heath JK, Tickle C. Cell. 1995;80:739. doi: 10.1016/0092-8674(95)90352-6. [DOI] [PubMed] [Google Scholar]
- 24.Hall BK, Miyake T. BioEssays. 2000;22:138. doi: 10.1002/(SICI)1521-1878(200002)22:2<138::AID-BIES5>3.0.CO;2-4. [DOI] [PubMed] [Google Scholar]
- 25.Frenz DA, Jaikaria NS, Newman SA. Dev. Biol. 1989;136:97. doi: 10.1016/0012-1606(89)90133-4. [DOI] [PubMed] [Google Scholar]
- 26.Leonard CM, Fuld HM, Frenz DA, Downie SA, Massague J, Newman SA. Dev. Biol. 1991;145:99. doi: 10.1016/0012-1606(91)90216-p. [DOI] [PubMed] [Google Scholar]
- 27.Newman SA, Frisch HL. Science. 1979;205:662. doi: 10.1126/science.462174. [DOI] [PubMed] [Google Scholar]
- 28.Turing AM. Phil. Trans. Roy. Soc. London B. 1952;37:237. [Google Scholar]
- 29.Cui C. Dynamics of cell movement and tissue motion in gastrulation and micromass cell culture. Indiana University; 2005. Ph.D. Thesis. [Google Scholar]
- 30.Hentschel HGE, Glimm T, Glazier JA, Newman SA. Proc. Biol. Sci. 2004;271:1713. doi: 10.1098/rspb.2004.2772. [DOI] [PMC free article] [PubMed] [Google Scholar]
- 31.Zeng W, Thomas GL, Glazier JA. Physica A. 2004;341:482. [Google Scholar]
- 32.Riddle RD. Cell. 1993;75:1401. doi: 10.1016/0092-8674(93)90626-2. [DOI] [PubMed] [Google Scholar]
- 33.Laufer E, Nelson CE, Johnson RL, Morgan BA, Tabin C. Cell. 1994;79:993. doi: 10.1016/0092-8674(94)90030-2. [DOI] [PubMed] [Google Scholar]
- 34.Parr BA, McMahon AP. Nature. 1995;374:350. doi: 10.1038/374350a0. [DOI] [PubMed] [Google Scholar]
- 35.Yang Y, Niswander L. Cell. 1995;80:939. doi: 10.1016/0092-8674(95)90297-x. [DOI] [PubMed] [Google Scholar]
- 36.Chaturvedi R, Izaguirre JA, Huang C, Cickovski T, Virtue P, Thomas G, Forgacs G, Alber M, Newman SA, Glazier JA. Computational Science—ICCS 2003. Part II. Vol. 2659. Springer Verlag; Melbourne, Australia and St. Petersburg, Russia: 2003. Lecture Notes in Computer Science; pp. 39–49. [Google Scholar]
- 37.Izaguirre JA, Chaturvedi R, Huang C, Cickovski T, Coffland J, Thomas G, Forgacs G, Alber M, Newman S, Glazier JA. Bioinformation. 2004;20:1129. doi: 10.1093/bioinformatics/bth050. [DOI] [PubMed] [Google Scholar]
- 38.Cickovski T, Huang C, Chaturvedi R, Glimm T, Hentschel G, Alber M, Glazier JA, Newman SA, Izaguirre JA. ACM Trans. Comput. Biol. Biocompl. 2005;2:273. doi: 10.1109/TCBB.2005.46. [DOI] [PubMed] [Google Scholar]
- 39.Cickovski T, Merks RMH, Izaguirre JA. 2006. in preparation.
- 40.Aras K, Cickovski T, Hentschel G, Alber M, Glazier JA, Newman SA, Izaguirre JA. 2005. in preparation.
- 41.Izaguirre JA, Cickovski T. 2006. in preparation.
- 42.Glazier JA, Graner F. Phys. Rev. E. 1993;47:2128. doi: 10.1103/physreve.47.2128. [DOI] [PubMed] [Google Scholar]
- 43.Graner F, Glazier JA. Phys. Rev. Lett. 1992;69:2013. doi: 10.1103/PhysRevLett.69.2013. [DOI] [PubMed] [Google Scholar]
- 44.Mombach JCM, Glazier JA. Phys. Rev. Lett. 1996;76:3032. doi: 10.1103/PhysRevLett.76.3032. [DOI] [PubMed] [Google Scholar]
- 45.Marée SAM. From pattern formation to morphogenesis. Utrecht University; 2000. Ph.D. Thesis. [Google Scholar]
- 46.Turner S, Sherratt JA. Theor. Biol. 2002;216:85. doi: 10.1006/jtbi.2001.2522. [DOI] [PubMed] [Google Scholar]
- 47.Jiang Y, Swart PJ, Saxena A, Asipauskas M, Glazier JA. Phys. Rev. E. 1999;59:5819. doi: 10.1103/physreve.59.5819. [DOI] [PubMed] [Google Scholar]
- 48.Sanyal S, Glazier JA. 2005. arXiv:cond-mat/0505770.
- 49.Dan D, Mueller C, Chen K, Glazier JA. Phys. Rev. E. 2005;72 doi: 10.1103/PhysRevE.72.041909. 041909. [DOI] [PubMed] [Google Scholar]
- 50.Steinberg M. Science. 1963;141:401. doi: 10.1126/science.141.3579.401. [DOI] [PubMed] [Google Scholar]
- 51.Popławski NJ. 2005. arXiv:physics/0512129.
- 52.Mombach JCM, Glazier JA, Raphael RC, Zajac M. Phys. Rev. Lett. 1995;75:2244. doi: 10.1103/PhysRevLett.75.2244. [DOI] [PubMed] [Google Scholar]
- 53.Dudley AT, Ros MA, Tabin CJ. Nature. 2002;418:539. doi: 10.1038/nature00945. [DOI] [PubMed] [Google Scholar]
- 54.Vargesson N, Clarke J, Vincent K, Coles C, Wolpert L, Tickle C. Development. 1997;124:1909. doi: 10.1242/dev.124.10.1909. [DOI] [PubMed] [Google Scholar]
- 55.Newman S, Cloître M, Allain C, Forgacs G, Beysens D. Biopolymers. 1997;41:337. doi: 10.1002/(SICI)1097-0282(199703)41:3%3C337::AID-BIP9%3E3.0.CO;2-T. [DOI] [PubMed] [Google Scholar]
- 56.Forgacs G. private communication.
- 57.Foty RA, Forgacs G, Pfleger CM, Steinberg MS. Phys. Rev. Lett. 1994;72:2298. doi: 10.1103/PhysRevLett.72.2298. [DOI] [PubMed] [Google Scholar]
- 58.Foty RA, Pfleger CM, Forgacs G, Steinberg MS. Development. 1996;122:1611. doi: 10.1242/dev.122.5.1611. [DOI] [PubMed] [Google Scholar]
- 59.Forgacs G, Foty RA, Shafrir Y, Steinberg MS. Biophys. J. 1998;74:2227. doi: 10.1016/S0006-3495(98)77932-9. [DOI] [PMC free article] [PubMed] [Google Scholar]
- 60.Beysens DA, Forgacs G, Glazier JA. Can. J. Phys. 2000;78:243. doi: 10.1073/pnas.97.17.9467. [DOI] [PMC free article] [PubMed] [Google Scholar]
- 61.Newman SA. private communication.
- 62.Glazier JA, Raphael RC, Graner F, Sawada Y. In: Interplay of Genetic and Physical Processes in the Development of Biological Form. Beysens D, Forgacs G, Gaill F, editors. World Scientific Publishing Company; Singapore: 1995. pp. 54–61. [Google Scholar]
- 63.Yang N. private communication.