Abstract
We compared the caspofungin (CAS) susceptibility testing results generated by the disk diffusion (DD) assay with the results of the Clinical and Laboratory Standards Institute (CLSI) broth microdilution (BD) reference method for 106 yeast isolates. The isolates represented 11 different fungal species, including Candida albicans (n = 50), C. parapsilosis (n = 10), C. glabrata (n = 10), C. tropicalis (n = 10), C. guillermondii (n = 6), C. rugosa (n = 5), C. krusei (n = 5), C. kefyr (n = 2), C. pelliculosa (n = 2), Saccharomyces cerevisiae (n = 3), and Geotrichum candidum (n = 3). The DD assay was performed in supplemented Mueller-Hinton agar with CAS, which was tested at concentrations of 2, 10, and 25 μg per disk. MICs and inhibition zone diameters were evaluated at 24 and 48 h. In general, the results obtained by the DD assay correlated well with those obtained by the BD method. In particular, a significant correlation between methods was observed when CAS was used at concentration of 2 μg/disk at a reading time of either 24 or 48 h.
The increase in the rates of fungal infections, the changes in their epidemiology, the emergence of resistance, and the toxicities that some of the commercial antifungal drugs display have resulted in the need for an expanded arsenal of antifungal drugs. Echinocandins represent a new class of antifungal agents that act by inhibiting the synthesis of 1,3-β-d-glucan, a key step in fungal cell wall biosynthesis (10). Caspofungin acetate (CAS) is a water-soluble, potent echinocandin with activity against a number of clinically important fungi. Although many authors investigated the activity of CAS against clinical isolates of fungi (1-3, 16), caution should be used before drawing clinical conclusions about the susceptibility results (5, 9). In addition, the MIC for CAS determined by the reference broth microdilution (BD) method can be altered greatly by changes in assay conditions, including the test format, the time of reading, as well as the definition of the end point (5).
Agar-based antifungal susceptibility testing, such as the disk diffusion (DD) method, can be an alternative that has a lower cost and the need for a reduced amount of labor compared with those required for the reference BD assay, although the results obtained by the DD assay can be plagued by the same variables that alter the MICs obtained by the BD method. In addition, the DD assay does not generate an MIC of the drug but generates only a zone of inhibition. In the last few years, several investigators compared the results of triazole MICs for yeasts and filamentous fungi obtained by the BD and the DD methods (4, 7, 8, 11, 13, 17). Few data are still available for echinocandin drugs. Therefore, in this study we compared the CAS susceptibility results obtained by the DD method with those obtained by the BD method for 106 yeast isolates. Three different concentrations of CAS were investigated to find the best correlation between the two methods.
MATERIALS AND METHODS
Organisms.
A total of 106 clinical yeast isolates were tested. The collection included Candida albicans (n = 50), C. parapsilosis (n = 10), C. glabrata (n = 10), C. tropicalis (n = 10), C. guillermondii (n = 6), C. rugosa (n = 5), C. krusei (n = 5), C. kefyr (n = 2), C. pelliculosa (n = 2), Saccharomyces cerevisiae (n = 3), and Geotrichum candidum (n = 3). The isolates were recovered from blood; abscesses; and the gastrointestinal, respiratory, and urinary tracts.
Antifungal agents.
A standard antifungal powder of CAS (Merck Co., Whitehouse Station, PA) was obtained from the manufacturer. Stock solutions were prepared in water. Serial twofold dilutions were prepared exactly as outlined in CLSI (formerly NCCLS) document M27-A2 (14). Final dilutions were made in RPMI 1640 medium (Sigma, Milan, Italy) buffered to pH 7 with 0.165 M morpholinopropanesulfonic acid buffer (Sigma). Aliquots of 0.1 ml of CAS at a 2× concentration were placed into the wells of plastic microdilution trays, which were then sealed and stored at −70°C until they were used, which was within 7 days.
BD method.
BD testing was performed in accordance with the guidelines of the CLSI M27-A2 document by using the spectrophotometric method for inoculum preparation, an inoculum concentration of 1.5 (± 1.0) × 103 cells/ml, and RPMI 1640 medium (14). A total of 0.1 ml of fungal inoculum was added to each well of the microdilution trays. The final concentrations of CAS were 0.008 to 4.0 μg/ml. The trays were incubated at 35°C, and MICs were read at 24 and 48 h. Drug-free and fungus-free controls were included. Following incubation, the wells were examined and the growth in each well was compared to that in the growth control well. The MIC of CAS was defined as the minimum concentration (in micrograms per milliliter) of antifungal agent that provided an ∼50% reduction in growth compared to the growth in the control well (15, 16).
DD assay.
Blank disks of 6.3 mm in diameter (Becton Dickinson Microbiology Systems, Cockeysville, MD) were impregnated with 20 μl of CAS suspensions, resulting in final concentrations of 2, 10, and 25 μg/disk. The disks were allowed to dry at room temperature. Testing was performed on Mueller-Hinton agar plates supplemented with 2% glucose and 0.5 μg of methylene blue per ml. For each isolate, duplicate plates were inoculated by dipping two sterile cotton swabs into a 0.5 McFarland suspension and streaking the plate surface in three directions. After the plate was allowed to dry for 20 min, disks with each concentration were plated in duplicate to test each isolate and the plates were incubated at 35°C. Zone diameters (in millimeters) for the zone of complete inhibition were determined after 24 and 48 h of incubation. The zone edges were easily defined as the point of complete inhibition of growth. To assess the reproducibility of the methodology, the inhibition zone diameters were obtained on two different days for 19 of the 106 fungi evaluated, including 8 isolates (4 C. albicans strains, 3 non-C. albicans strains, and 1 S. cerevisiae strain) with MICs ≥2.0 μg/ml.
QC.
Quality control (QC) was performed in accordance with the guidelines in CLSI documents M27-A2 and M44-A by using C. krusei ATCC 6258 and C. parapsilosis ATCC 22019 (6, 14). The CLSI QC isolates were tested each time that a set of isolates was evaluated by the two procedures.
Interpretation of results.
The degree of correlation between the MICs and the disk diffusion zone diameters was analyzed by use of Pearson's correlation coefficient. A linear relationship was assessed by using least-squares regression, weighted by the number of strains. For comparative evaluation of the BD and DD methods, the arithmetic means (AMs) and the ranges of the MICs and the AMs and the ranges of the inhibition zone diameters were calculated for each species.
RESULTS AND DISCUSSION
The median CAS MICs for C. kusei ATCC 6258 and C. parapsilosis ATCC 22019 were 2.0 μg/ml and 1.0 μg/ml, respectively (18). Table 1 summarizes the results of the BD and DD assays obtained at 24 and 48 h. The CAS MICs for C. albicans isolates ranged from 0.06 to ≥4.0 μg/ml at either 24 or 48 h. The CAS MICs for Candida other than C. albicans and for the other fungal isolates ranged from 0.06 to ≥4.0 μg/ml at 24 h and from 0.125 to ≥4.0 μg/ml at 48 h. In general, the halo diameters obtained with the disks embedded with the highest CAS concentration were larger than those produced with the lower concentrations. A tendency toward slightly larger zones after 48 h of incubation was noted for the majority of the isolates tested. The biggest difference between the first- and second-day readings was observed for C. krusei isolates.
TABLE 1.
In vitro activity of CAS against 106 fungal isolates
| Species (no. of strains) | CAS concn (μg/disk) | Susceptibility testing result by DD assay (mm) at:
|
Susceptibility testing result by CLSI method (μg/ml) at:
|
||||||
|---|---|---|---|---|---|---|---|---|---|
| 24 h
|
48 h
|
24 h
|
48 h
|
||||||
| Range | AM | Range | AM | Range | AM | Range | AM | ||
| C. albicans (50) | 2 | 9-16 | 12.58 | 9-16 | 12.86 | 0.06-≥4 | 0.66 | 0.06-≥4 | 0.86 |
| 10 | 18-27 | 20.58 | 18-27 | 20.80 | |||||
| 25 | 17-25 | 22.98 | 20-28 | 23.20 | |||||
| C. parapsilosis (10) | 2 | 9-15 | 11.10 | 9-15 | 11.30 | 0.5-4 | 1.12 | 0.5-≥4 | 2.150 |
| 10 | 17-23 | 20.00 | 17-23 | 20.10 | |||||
| 25 | 20-26 | 22.50 | 20-26 | 22.60 | |||||
| C. glabrata (10) | 2 | 9-20 | 13.00 | 9-20 | 13.09 | 0.125-2 | 0.54 | 0.25-2 | 1.20 |
| 10 | 17-24 | 20.73 | 18-24 | 20.82 | |||||
| 25 | 20-26 | 23.55 | 20-28 | 23.73 | |||||
| C. tropicalis (10) | 2 | 10-13 | 12.00 | 10-13 | 12.18 | 0.125-0.5 | 0.27 | 0.125-1 | 0.54 |
| 10 | 16-22 | 19.18 | 17-22 | 19.36 | |||||
| 25 | 18-26 | 21.64 | 18-25 | 21.64 | |||||
| C. guillermondii (6) | 2 | 10-14 | 11.67 | 10-14 | 11.67 | 0.125-1 | 0.35 | 0.25-2 | 0.71 |
| 10 | 18-20 | 19.33 | 18-20 | 19.33 | |||||
| 25 | 21-23 | 21.83 | 21-23 | 21.83 | |||||
| C. rugosa (5) | 2 | 9-18 | 15.00 | 12-18 | 15.60 | 0.125-0.25 | 0.17 | 0.25-0.5 | 0.40 |
| 10 | 20-23 | 21.80 | 20-23 | 21.80 | |||||
| 25 | 24-26 | 25.20 | 24-26 | 25.20 | |||||
| C. krusei (5) | 2 | 9-15 | 12.80 | 12-18 | 15.60 | 0.125-1 | 0.575 | 0.25-0.5 | 0.40 |
| 10 | 9-20 | 17.80 | 20-23 | 21.80 | |||||
| 25 | 20-22 | 21.60 | 24-26 | 25.20 | |||||
| C. kefyr (2) | 2 | 15-17 | 16.00 | 16-17 | 16.50 | 0.06-0.125 | 0.09 | 0.125-0.25 | 0.18 |
| 10 | 21 | 21 | 21 | 21 | |||||
| 25 | 24-25 | 24.50 | 24-25 | 24.50 | |||||
| C. pelliculosa (2) | 2 | 12-17 | 14.50 | 12-17 | 14.50 | 0.06-0.125 | 0.09 | 0.125-0.5 | 0.313 |
| 10 | 21 | 21 | 21 | 21 | |||||
| 25 | 24-25 | 24.50 | 24-25 | 24.50 | |||||
| Others (6) | 2 | 7-15 | 11.50 | 7-15 | 11.50 | 0.06-≥4 | 2.82 | 0.25-≥4 | 2.96 |
| 10 | 8-22 | 16.83 | 8-22 | 16.83 | |||||
| 25 | 10-26 | 19.16 | 10-26 | 19.50 | |||||
Table 2 summarizes the correlation between the methodologies. The best correlation between the methods was obtained by the use of CAS at a concentration of 2.0 μg/disk at either 24 h or 48 h of reading for C. albicans (r = −0.383 at 24 h and r = −0.416 at 48 h) and for non-C. albicans species (r = −0.333 at 24 h and r = −0.417 at 48 h). With the exception of susceptibility testing for the isolates belonging to genera other than Candida, the results obtained with CAS at 10 and 25 μg did not correlate significantly with the results obtained by the BD method.
TABLE 2.
Correlation between BD and DD methods for CAS susceptibility testing
| Time of reading | Species (no. of strains) | CASa concn (μg/disk) | Pearson's correlation (r) |
|---|---|---|---|
| 24 h | C. albicans (50) | 2 | −0.383 |
| 10 | −0.130 | ||
| 25 | −0.354 | ||
| Non-C. albicans species (50) | 2 | −0.333 | |
| 10 | −0.118 | ||
| 25 | −0.184 | ||
| Others (6) | 2 | −0.925 | |
| 10 | −0.993 | ||
| 25 | −0.988 | ||
| 48 h | C. albicans (50) | 2 | −0.416 |
| 10 | −0.196 | ||
| 25 | −0.129 | ||
| Non-C. albicans species (50) | 2 | −0.417 | |
| 10 | −0.212 | ||
| 25 | −0.187 | ||
| Others (6) | 2 | −0.938 | |
| 10 | −0.997 | ||
| 25 | −0.991 |
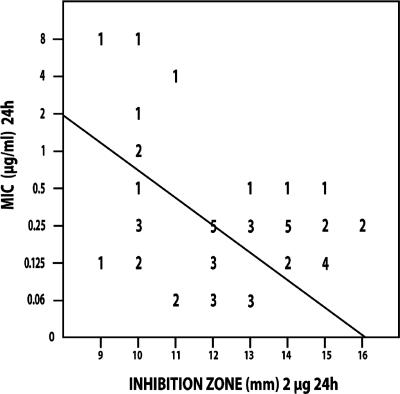
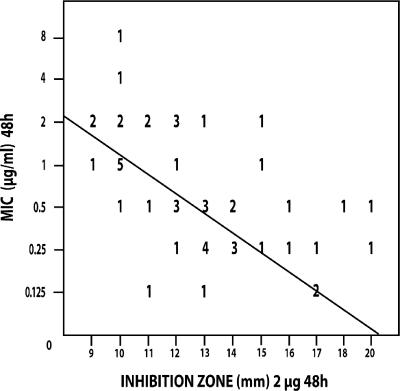
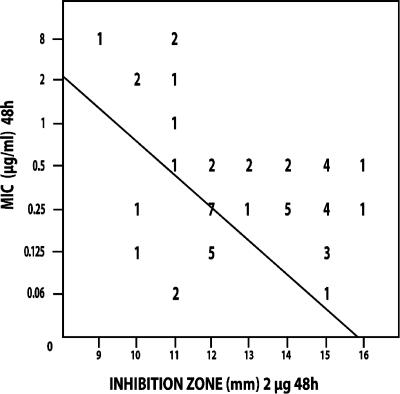
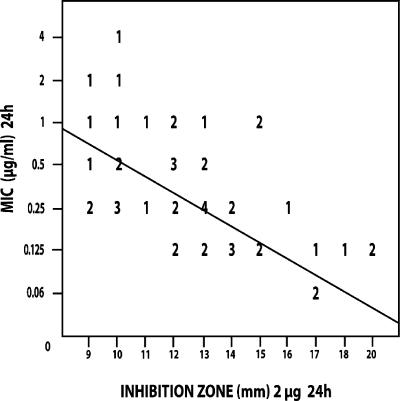
Figures 1 to 4 show the isolate-by-isolate relationship between the log10 MIC and the inhibition zones produced on agar plates by 2-μg disks after 24 and 48 h of incubation. For most organisms tested, the more susceptible that the organism was by the BD method, the greater the inhibition zone that was produced on agar. On the basis of the findings presented in previous reports, we grouped the isolates with MICs of ≤1 μg/ml as being susceptible and those with MICs of ≥2 μg/ml as being resistant (15, 16).
FIG. 1.
Regression analysis for CAS susceptibility values of C. albicans isolates (n = 50) correlating the 24-h zones of inhibition (mm) determined with Mueller-Hinton agar plates with the 24-h MICs determined by the CLSI BD method (μg/ml). The line of best fit is shown, and the regression statistics gave a Pearson's r value of −0.383. The numbers in the figure are the numbers of strains that correlate with each value.
FIG. 4.
Regression analysis for CAS susceptibility values of non-Candida albicans isolates (n = 50) correlating the 48-h zones of inhibition (mm) determined with Mueller-Hinton agar plates with the 48-h MICs determined by the CLSI broth dilution method (μg/ml). The line of best fit is shown, and the regression statistics gave a Pearson's r value of −0.417. The numbers in the figure are the numbers of strains that correlate with each value.
Table 3 summarizes the agreement between the two methods. In particular, among the Candida isolates showing CAS MICs ≤1.0 μg/ml at 24 h, 75.2% (76.1% for C. albicans and 74.4% for the other Candida spp.) produced halo diameters that ranged from 12 to 16 mm. Similarly, among those isolates showing CAS MICs ≥2.0 μg/ml, 100% of the strains showed inhibition zone diameters that ranged from 9 to 11 mm. At the second-day reading, the proportions of C. albicans and non-C. albicans isolates with MICs ≤1.0 μg/ml and inhibition zones ≥12 mm increased to 86.4% and 75.7%, respectively.
TABLE 3.
Agreement between BD and DD methods for CAS susceptibility testing
| Time of reading | Species (no. of strains) | BD methoda
|
% of isolates with DD inhibition zone diam ofb:
|
% Agreementc | ||
|---|---|---|---|---|---|---|
| MIC (μg/ml) | % of isolates | ≥12 mm | ≤11 mm | |||
| 24 h | C. albicans (50) | ≤1 | 92.0 | 76.1 | 23.9 | 78.0 |
| ≥2 | 8.0 | 0 | 100 | |||
| Non-C. albicans (50) | ≤1 | 94.0 | 74.4 | 25.6 | 76.0 | |
| ≥2 | 6.0 | 0 | 100 | |||
| Overall (100) | ≤1 | 93.0 | 75.2 | 24.2 | 77.0 | |
| ≥2 | 7.0 | 0 | 100 | |||
| 48 h | C. albicans (50) | ≤1 | 88.0 | 86.4 | 13.6 | 88.0 |
| ≥2 | 12.0 | 0 | 100 | |||
| Non-C. albicans (50) | ≤1 | 74.0 | 75.7 | 24.3 | 72.0 | |
| ≥2 | 26.0 | 38.5 | 61.5 | |||
| Overall (100) | ≤1 | 81.0 | 81.5 | 18.5 | 80.0 | |
| ≥2 | 19.0 | 26.3 | 73.7 | |||
CLSI M27-A2 microdilution method.
DD assay by the CLSI M44-A method with caspofungin at 2 mg per disk.
Percentages of inhibition zone diameters (in mm) compared with the reference MICs that were in agreement regarding a tentative breakpoint classification: susceptible, MIC of ≤1 mg/ml and inhibition zone diameters of ≥12 mm; resistant, MIC of ≥2 mg/ml and inhibition zone diameters of ≤11 mm.
Since the clinical laboratory needs easy, reliable, and non-time-consuming alternative methods for the determination of the MICs of antifungal agents, we investigated a DD procedure as a method for testing the activity of CAS against clinical fungal isolates. We examined three different concentrations of the echinocandin and found that the best correlation with the BD results was obtained by using disks containing 2 μg of CAS. Our data agree with those previously reported by Lozano-Chiu et al. (12). Those authors found that a final CAS concentration of 2.5 μg/disk yielded the best range of zone diameters of all the concentrations tested. Our data seem to indicate a greater correlation between the two methodologies when CAS is used at 2 μg/disk against Candida spp. on either the first- or the second-day reading. Further studies involving clinical isolates obtained from patients with well-known clinical outcomes are warranted to further elucidate this important technical issue. In general, our data show that this agar-based method hold promise as a simple and reliable method for determining the susceptibilities of Candida spp. to CAS.
FIG. 2.
Regression analysis for CAS susceptibility values of C. albicans isolates (n = 50) correlating the 48-h zones of inhibition (mm) determined with Mueller-Hinton agar plates with the 48-h MICs determined by the CLSI broth dilution method (μg/ml). The line of best fit is shown, and the regression statistics gave a Pearson's r value of −0.416. The numbers in the figure are the numbers of strains that correlate with each value.
FIG. 3.
Regression analysis for CAS susceptibility values of non-Candida albicans isolates (n = 50) correlating the 24-h zones of inhibition (mm) determined with Mueller-Hinton agar plates with the 24-h MICs determined by the CLSI broth dilution method (μg/ml). The line of best fit is shown, and the regression statistics gave a Pearson's r value of −0.333. The numbers in the figure are the numbers of strains that correlate with each value.
Footnotes
Published ahead of print on 29 August 2007.
REFERENCES
- 1.Abruzzo, G. K., A. M. Flattery, C. J. Gill, L. Kong, J. G. Smith, V. B. Pikounis, J. M. Balkovec, A. F. Bouffard, J. F. Dropinski, H. Rosen, H. Kropp, and K. Bartizal. 1997. Evaluation of the echinocandin antifungal MK-0991 (L-743,872): efficacies in mouse models of disseminated aspergillosis, candidiasis, and cryptococcosis. Antimicrob. Agents Chemother. 41:2333-2338. [DOI] [PMC free article] [PubMed] [Google Scholar]
- 2.Barchiesi, F., A. M. Schimizzi, A. W. Fothergill, G. Scalise, and M. G. Rinaldi. 1999. In vitro activity of the new echinocandin antifungal, MK-0991, against common and uncommon clinical isolates of Candida species. Eur. J. Clin. Microbiol. Infect. Dis. 18:302-304. [DOI] [PubMed] [Google Scholar]
- 3.Barry, A. L., M. A. Pfaller, S. D. Brown, A. Espinel-Ingroff, M. A. Ghannoum, C. Knapp, R. P. Rennie, J. H. Rex, and M. G. Rinaldi. 2000. Quality control limits for broth microdilution susceptibility tests of ten antifungal agents. J. Clin. Microbiol. 38:3457-3459. [DOI] [PMC free article] [PubMed] [Google Scholar]
- 4.Barry, A. L., M. A. Pfaller, R. P. Rennie, P. C. Fuchs, and S. D. Brown. 2002. Precision and accuracy of fluconazole susceptibility testing by broth microdilution, Etest, and disk diffusion methods. Antimicrob. Agents Chemother. 46:1781-1784. [DOI] [PMC free article] [PubMed] [Google Scholar]
- 5.Cada, D. J., T. Levien, and D. E. Baker. 2001. Caspofungin. Hosp. Pharm. 36:522-533. [Google Scholar]
- 6.Clinical and Laboratory Standards Institute. 2004. Method for antifungal disk diffusion susceptibility testing of yeasts. Approved guideline. Document M44-A. Clinical and Laboratory Standards Institute, Wayne, PA.
- 7.Espinel-Ingroff, A., B. Arthington-Skaggs, N. Iqbal, D. Ellis, M. A. Pfaller, S. Messer, M. Rinaldi, A. Fothergill, D. L. Gibbs, and A. Wang. 2007. Multicenter evaluation of a new disk agar diffusion method for susceptibility testing of filamentous fungi with voriconazole, posaconazole, itraconazole, amphotericin B, and caspofungin. J. Clin. Microbiol. 45:1811-1820. [DOI] [PMC free article] [PubMed] [Google Scholar]
- 8.Espinel-Ingroff, A., E. Canton, D. Gibbs, and A. Wang. 2007. Correlation of Neo-Sensitabs tablet diffusion assay results on three different agar media with CLSI broth microdilution M27-A2 and disk diffusion M44-A results for testing susceptibilities of Candida spp. and Cryptococcus neoformans to amphotericin B, caspofungin, fluconazole, itraconazole, and voriconazole. J. Clin. Microbiol. 45:858-864. [DOI] [PMC free article] [PubMed] [Google Scholar]
- 9.Kartsonis, N., J. Killar, L. Mixson, C. Hoe, C. Sable, K. Bartizal, and M. Motyl. 2005. Caspofungin susceptibility testing of isolates from patients with esophageal candidiasis or invasive candidiasis: relationship of MIC to treatment outcome. Antimicrob. Agents Chemother. 49:3616-3623. [DOI] [PMC free article] [PubMed] [Google Scholar]
- 10.Kartsonis, N. A., J. Nielsen, and C. M. Douglas. 2003. Caspofungin: the first in a new class of antifungal agents. Drug Resist. Updates 6:197-218. [DOI] [PubMed] [Google Scholar]
- 11.López-Oviedo, E., A. I. Aller, C. Martín, C. Castro, M. Ramirez, J. M. Pemán, E. Cantón, C. Almeida, and E. Martín-Mazuelos. 2006. Evaluation of disk diffusion method for determining posaconazole susceptibility of filamentous fungi: comparison with CLSI broth microdilution method. Antimicrob. Agents Chemother. 50:1108-1111. [DOI] [PMC free article] [PubMed] [Google Scholar]
- 12.Lozano-Chiu, M., P. W. Nelson, V. L. Paetznick, and J. H. Rex. 1999. Disk diffusion method for determining susceptibilities of Candida spp. to MK-0991. J. Clin. Microbiol. 37:1625-1627. [DOI] [PMC free article] [PubMed] [Google Scholar]
- 13.Matar, M. J., L. Ostrosky-Zeichner, V. L. Paetznick, J. R. Rodriguez, E. Chen, and J. H. Rex. 2003. Correlation between E-test, disk diffusion, and microdilution methods for antifungal susceptibility testing of fluconazole and voriconazole. Antimicrob. Agents Chemother. 47:1647-1651. [DOI] [PMC free article] [PubMed] [Google Scholar]
- 14.National Committee for Clinical Laboratory Standards. 2002. Publication M27-A2: reference method for broth dilution antifungal susceptibility testing of yeast. Approved standards. National Committee for Clinical Laboratory Standards, Wayne, PA.
- 15.Odds, F., M. Motyl, R. Andrade, J. Bille, E. Canton, M. Cuenca-Estrella, A. Davidson, C. Durussel, D. Ellis, E. Foraker, A. W. Fothergill, M. A. Ghannoum, R. A. Giacobbe, M. Gobernado, R. Handke, M. Laverdiere, W. Lee-Yang, W. G. Merz, L. Ostrosky-Zeichner, J. Peman, S. Perea, J. R. Perfect, M. A. Pfaller, L. Proia, J. H. Rex, M. G. Rinaldi, J. L. Rodriguez-Tudela, W. A. Schell, C. Shields, D. A. Sutton, P. E. Verweij, and D. W. Warnock. 2004. Interlaboratory comparison of results of susceptibility testing with caspofungin against Candida and Aspergillus species. J. Clin. Microbiol. 42:3475-3482. [DOI] [PMC free article] [PubMed] [Google Scholar]
- 16.Pfaller, M. A., L. Boyken, R. J. Hollis, S. A. Messer, S. Tendolkar, and D. J. Diekema. 2006. In vitro susceptibilities of Candida spp. to caspofungin: four years of global surveillance. J. Clin. Microbiol. 44:760-763. [DOI] [PMC free article] [PubMed] [Google Scholar]
- 17.Pfaller, M. A., L. Boyken, S. A. Messer, S. Tendolkar, R. J. Hollis, and D. J. Diekema. 2005. Comparison of results of voriconazole disk diffusion testing for Candida species with results from a central reference laboratory in the ARTEMIS global antifungal surveillance program. J. Clin. Microbiol. 43:5208-5213. [DOI] [PMC free article] [PubMed] [Google Scholar]
- 18.Pfaller, M. A., D. J. Diekema, S. A. Messer, R. J. Hollis, and R. N. Jones. 2003. In vitro activities of caspofungin compared with those of fluconazole and itraconazole against 3,959 clinical isolates of Candida spp., including 157 fluconazole-resistant isolates. Antimicrob. Agents Chemother. 47:1068-1071. [DOI] [PMC free article] [PubMed] [Google Scholar]


