

Abstract
Although NAD+-dependent succinate semialdehyde dehydrogenase activity was first described in Escherichia coli more than 25 years ago, the responsible gene has remained elusive so far. As an experimental proof of concept for a gap-filling algorithm for metabolic networks developed earlier, we demonstrate here that the E. coli gene yneI is responsible for this activity. Our biochemical results demonstrate that the yneI-encoded succinate semialdehyde dehydrogenase can use either NAD+ or NADP+ to oxidize succinate semialdehyde to succinate. The gene is induced by succinate semialdehyde, and expression data indicate that yneI plays a unique physiological role in the general nitrogen metabolism of E. coli. In particular, we demonstrate using mutant growth experiments that the yneI gene has an important, but not essential, role during growth on arginine and probably has an essential function during growth on putrescine as the nitrogen source. The NADP+-dependent succinate semialdehyde dehydrogenase activity encoded by the functional homolog gabD appears to be important for nitrogen metabolism under N limitation conditions. The yneI-encoded activity, in contrast, functions primarily as a valve to prevent toxic accumulation of succinate semialdehyde. Analysis of available genome sequences demonstrated that orthologs of both yneI and gabD are broadly distributed across phylogenetic space.
In spite of extensive biochemical research, metabolic networks of sequenced microbes contain a significant number of orphan enzyme activities that are not assigned to any gene. For example, the reconstructed metabolic network models of Escherichia coli (36), Saccharomyces cerevisiae (29), and Staphylococcus aureus (21) contain 19, 14, and 23% orphan activities, respectively. Moreover, for about 30 to 40% of the metabolic activities classified by the Enzyme Commission (http://www.chem.qmul.ac.uk/iubmb/enzyme/) there are no known sequences in any organism (8, 24, 31).
An example of a well-known orphan activity is the NAD+-dependent succinate semialdehyde dehydrogenase (SSADH) (EC 1.2.1.24) in E. coli. The SSADH is almost certainly present in E. coli based on much experimental evidence (34). Two distinct SSADHs (NAD+- and NADP+-dependent SSADHs) were first described in Pseudomonas fluorescens (22). In E. coli strain B Donnelly and Cooper (12) described two physically and genetically distinct forms of SSADHs, EC 1.2.1.16 and EC 1.2.1.24 (Fig. 1), with molecular masses of 200 kDa (as a tetramer) and 97 kDa (as a dimer), respectively. The larger of the two enzymes (NADP+ dependent) was found to be the product of the gabD gene and to be induced primarily by growth on γ-aminobutyrate (GABA). The smaller enzyme (NAD+/NADP+ dependent, encoded by sad) was induced by exposure to exogenous succinate semialdehyde (SSA). The same authors (13) demonstrated later that the NAD+-specific SSADH is also present in E. coli strain K-12. In K-12 the NAD+-dependent enzyme was induced in cells grown on GABA due to the gratuitous induction by SSA generated during GABA degradation. However, only genomic fragments containing the sad gene were located and cloned, and the exact location of the sad gene, as well as its cellular function, remained unknown (12, 32, 41). Despite extensive experimental research, the NAD+-dependent activity has remained an orphan in E. coli for over 25 years.
FIG. 1.

Biosynthesis and degradation metabolism of arginine and putrescine in E. coli. The EC 1.2.1.24 orphan activity is indicated by a shaded box. Genes highly expressed with the yneI (sad) gene under stress conditions in which the DNA-stabilizing gene hupB is knocked out (hupB_KOPG) (see text for details) (17) are indicated by bold italics. Genes highly coexpressed with the gabD gene under nitrogen limitation conditions (40, 47) are indicated by underlined italics. TCA, tricarboxylic acid.
Computational methods based on sequence homology can be used to assign functions to a significant fraction of metabolic genes (1, 37, 43, 45). However, the accuracy of homology methods is low for sequences with remote sequence homology to known enzymes. For example, to transfer all four digits of an EC number with 90% accuracy, at least 50 to 60% sequence identity is required (37, 43). According to the KEGG database, genes that encode the EC 1.2.1.24 activity are annotated in seven organisms, including Homo sapiens and Drosophila melanogaster. Based on the annotated sequences, no gene can be reliably assigned to the SSADH activity in E. coli as the top sequence hits with unknown functions (hypothetical genes) display identities that are less than 35%.
In addition to sequence homology-based methods, several context-based genomics correlations, such as coexpression, coevolution, chromosomal clustering, and gene fusion (4, 15, 16, 23, 35, 46), have been developed to establish functional links between proteins. Specifically, with a focus on filling remaining gaps in metabolic networks, we have previously developed an algorithm that combines context-based correlations with the structure of a partially known metabolic network (9, 25, 27). The main idea of the approach is to use genes assigned to the network neighbors as constraints in assigning genes to orphan metabolic activities. This gap-filling method can be used to rank potential candidates for specific metabolic activities. As an experimental proof of concept for this gap-filling algorithm, we present here computational prediction and experimental verification of the gene encoding the NADP+/NAD+-dependent SSADH in E. coli.
MATERIALS AND METHODS
Metabolic network.
The metabolic network was constructed based on the E. coli iJR904 model (36). The network was represented as a graph with metabolic genes as nodes and connections established by shared metabolites as edges (9, 26, 27). Orphan activities appear as “gaps” in the constructed metabolic network. The 15 most widely used metabolites (ATP, ADP, AMP, CO2, coenzyme A, glutamate, H+, NAD+, NADH, NADP+, NADPH, NH3, glucose, orthophosphate, and pyrophosphate) were not used to establish connections as they usually do not represent true functional linkages. The metabolic network distance between two metabolic genes was calculated as the shortest path length between the two corresponding network nodes.
Computational prediction of genes responsible for metabolic orphans.
The fitness of candidate genes in the network gap represented by the SSADH activity was calculated using context-based correlation as described in detail previously (9, 25, 27). Briefly, the values of context-based correlations between genes (evolutionary phylogenetic profiles, gene distance profiles, gene coexpression, chromosomal gene clustering, and protein fusion) were used in the cost function to assess the overall fitness of a candidate gene at a certain network position:
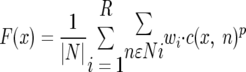 |
where x is a candidate gene, n is a gene from the network neighborhood of the gap, c(x, n) is the one type of context-based correlations between genes x and n, wi is the layer weight, and p is the power factor for context-based correlation calculations. The summation in the equation is, first, over all genes in a given layer (distance) (Ni) around the gap and, second, over all layers up to layer R. Only three layers around the network gaps were used in all calculations in this study. N is the total number of genes in all three layers.
The cost function values for various context correlations were integrated using the boosting algorithm with an alternating decision tree as described previously (18, 25). The confidence score generated by the alternating decision tree algorithm was used to rank the candidate genes for the orphan activity.
Strains and growth conditions.
E. coli BW25113 [lacIq rrnB3 ΔlacZ4787 hsdR514 Δ(araBAD)567 Δ(rhaBAD)568 rph-1] (10) and gabD and yneI knockout mutants of this strain were obtained from the Keio knockout collection and verified by PCR (2). E. coli strains harboring overexpression plasmids for both His-tagged YneI and GabD were obtained from the AKSA clone collection (28). All physiological experiments were conducted in M9 minimal medium supplemented with 20 mM glycerol or 22 mM glucose as the sole carbon source. Batch cultures were grown in 500-ml baffled flasks with 50 ml of M9 minimal medium at 250 rpm and 37°C. Batch cultures with glycerol and different exogenous SSA concentrations were grown in 15-ml tubes with 5 ml of M9 minimal medium at 250 rpm and 37°C. Overexpression of the His-tagged GabD and YneI dehydrogenases was performed in 50 LB medium containing 0.1 mM isopropyl-β-d-thiogalactopyranoside (IPTG) and 20 μg/ml chloramphenicol at 250 rpm and 37°C.
The M9 minimal medium contained (per liter of deionized water) 7.52 g Na2HPO4·2H2O, 3.0 g KH2PO4, 0.5 g NaCl, and 2.5 g (NH4)2SO4. The following components were sterilized separately and then added (per liter of medium [final concentrations]): 1 ml 0.1 M CaCl2, 1 ml 1 M MgSO4, 0.6 ml 100 mM FeCl3, 2 ml vitamin solution (filter sterilized), and 10 ml M9 trace salts solution. The vitamin solution contained (per 50 ml) 25 mg each of biotin, cyanocobalamin, niacin, calcium pantothenate, pyridoxine HCl, and thiamine HCl. The M9 trace salts solution contained (per liter) 0.18 g ZnSO4·7H2O, 0.12 g CuCl2·2H2O, 0.12 g MnSO4·H2O, and 0.18 g CoCl2·6H2O. The (NH4)2SO4 was omitted for the growth experiments in which GABA, arginine, or putrescine was used as an alternative nitrogen source.
In vitro enzyme activities.
Bacterial cells were harvested by centrifugation at 4°C and washed twice in 0.9% NaCl and 10 mM MgSO4. Cells were concentrated 10-fold in extraction buffer (100 mM Tris-HCl [pH 7.5], 5 mM MgCl2, 1 mM dithiothreitol, Complete EDTA-free protease inhibitor cocktail [Roche]) and disrupted by passage through a French press at 4°C. Cell extracts were obtained by centrifugation at 23,100 × g for 30 min at 4°C. The supernatant was used for the enzymatic assays in 1 ml of reaction buffer at 25°C. Reduction of NAD+/NADP+ was monitored spectrophotometrically at 340 nm. Protein concentrations of the extracts were determined by the biuret assay (19). In vitro enzyme activities of SSADH were detected under the following assay conditions: 100 mM KPO4 buffer (pH 7.8), 50 μl cell extract, 1 mM NAD+/NADP+, and 1 mM SSA (40). His-tagged YneI and GabD dehydrogenases were purified from cell extracts with HiTrap affinity columns from Amersham Biosciences by following the manufacturer's instructions, and enzyme activities were analyzed as described above after dialysis using Spectra/Por Float-A-Lyzer membranes with a molecular mass cutoff of 25 kDa.
Expression analysis.
The expression profiles of E. coli genes were obtained from two independent sources: the Stanford Microarray Database (http://genome-www5.stanford.edu/) (185 conditions) (3) and the M3D Database (http://m3d.bu.edu) (247 conditions) (17). We selected and analyzed all experimental conditions in which a target gene was more highly expressed than it was in 90% of all available conditions.
RESULTS
Computational prediction of the gene responsible for the NAD+/NADP+-dependent SSADH activity.
Based on the previously described gap-filling algorithm (9, 25, 27), we predicted that the yneI and ydcW genes are the two top candidates for NAD+/NADP+-dependent SSADH activity among 1,294 E. coli genes without known functions. All other 1,292 gene candidates were eliminated based on significantly inferior fitness scores. The ydcW gene has recently been identified as the gene encoding gamma-aminobutyraldehyde dehydrogenase (EC 1.5.1.35) (38) and therefore was not investigated further. The yneI gene has strong phylogenetic profile correlations (9) with several genes involved in the same glutamate pathway, as defined in the KEGG database. One example is the puuE gene (previously known as goaG [30]), which is responsible for the directly neighboring 4-aminobutyrate transaminase activity (EC 2.6.1.19). In addition, the yneI gene is close to the yneH gene from the KEGG glutamate pathway. The inferred molecular mass of the YneI protein is approximately 50 kDa, which is close to the apparent molecular mass, 55 kDa, that was reported for NAD+/NADP+-dependent SSADH in E. coli (32).
Physiological and biochemical analyses of the yneI function.
To identify the molecular function of the yneI gene, we first grew E. coli wild-type strain BW25113 and the gabD and yneI mutants on M9 minimal medium containing 1% (vol/vol) LB medium with 5 mM GABA as the nitrogen source and glycerol as the carbon source (Fig. 2). E. coli can use GABA as the sole nitrogen source by transaminase cleavage (EC 2.6.1.19) (Fig. 1) to glutamate and SSA (14, 40). It was shown previously that the sad and gabD genes are induced under these conditions to convert the toxic compound SSA to succinate (13, 41). The growth of all strains was linear in the beginning but rapidly leveled off due to depletion of the LB medium. As expected, the gabD mutant had a limited capacity to metabolize GABA and thus reached a lower optical density than the wild-type strain. In the yneI mutant, growth on GABA was affected even more, suggesting that the cells cannot efficiently metabolize SSA.
FIG. 2.

Growth of E. coli wild-type strain BW25113 (▵) and the gabD (□) and yneI (○) mutants on M9 minimal medium containing 1% (vol/vol) LB, 20 mM glycerol as the carbon source, and 5 mM GABA as the nitrogen source. Growth of E. coli wild-type strain BW25113 without GABA was used as a control (▴). OD600, optical density at 600 nm.
If yneI indeed encodes NAD+-dependent SSADH activity, then one would expect severe growth inhibition of the yneI mutant due to an inability to degrade the toxic intracellular SSA. To test this hypothesis, the sensitivity to exogenous SSA was analyzed by growing the wild type and the gabD and yneI mutants on defined M9 minimal medium with ammonium sulfate as the nitrogen source and glycerol as the carbon source. Growth of the three strains was tested in the presence of 0, 1, 2, 3, 4, and 5 mM SSA (Fig. 3). The yneI mutant showed strongly inhibited growth compared to the wild type and the gabD mutant. While the wild-type growth rate was affected only at a concentration of 5 mM and the gabD mutant growth rate was affected only at concentrations of 4 and 5 mM, the growth rate of the yneI mutant was affected at a concentration of 1 mM (Fig. 3A). Concomitant with the decrease in the growth rate, we also observed a significant increase in the lag phase with increasing SSA concentration (Fig. 3B).
FIG. 3.

Growth rates (A) and approximate lag phases (B) of E. coli wild-type strain BW25113 (black bars) and the gabD (light gray bars) and yneI (dark gray bars) mutants on M9 minimal medium containing glycerol as the carbon source and 0, 1, 2, 3, 4, or 5 mM exogenous SSA. The lag phases are expressed relative to the results obtained without exogenous SSA (Reference). ND, not determined due to the absence of growth.
We determined the in vitro NAD+- and NADP+-dependent SSADH activities in crude extracts prepared from cells grown on the defined M9 minimal medium with ammonium sulfate as the nitrogen source and glycerol as the carbon source in the presence of 2 mM exogenous SSA (Fig. 4). The enzymatic assays revealed that the NAD+-dependent SSADH activity is absent in the yneI mutant but present in the wild type and the gabD mutant in the presence of SSA. This provides biochemical evidence that yneI is the sad gene coding for the NAD+/NADP+-dependent activity, while gabD is specific for NADP+. The results also suggest that the yneI gene is strongly induced by SSA because the NAD+-dependent SSADH activity was essentially absent in the uninduced wild-type strain but strong in the presence of 2 mM SSA (Fig. 4).
FIG. 4.

SSADH activities in crude cell extracts harvested from growth on M9 minimal medium with glycerol and 0 or 2 mM exogenous SSA. The values are means ± standard deviations for both NAD+ and NADP+.
Finally, to obtain direct biochemical evidence that the yneI gene is responsible for the predicted activity, the YneI and GabD proteins were purified by using a His tag (Fig. 5). The purified YneI dehydrogenase accepted both NADP+ and NAD+ as cofactors (activities, 3,164 ± 97 and 3,679 ± 166 μmol min−1 g−1, respectively), while the GabD dehydrogenase reacted only with NADP+ and not with NAD+ (3,433 ± 105 and 96 ± 135 μmol min−1 g−1, respectively), as previously shown (12).
FIG. 5.

Sodium dodecyl sulfate-polyacrylamide gel electrophoresis gel showing purification of the His-tagged YneI and GabD dehydrogenases. Lanes M, molecular weight marker; lane 1, wash fraction of nonspecific bound cell protein from GabD overexpression; lane 2, elution fraction containing purified GabD (predicted molecular mass of the monomer, 51.7 kDa); lane, 3, wash fraction of nonspecific bound cell protein from YneI overexpression; lane 4, elution fraction containing purified YneI (predicted molecular mass of the monomer, 49.7 kDa).
Analysis of yneI expression.
After establishing that yneI encodes the NAD+/NADP+-dependent SSADH, we investigated the cellular function of this enzyme. Although it is known that the sad gene (yneI) is induced during E. coli growth on GABA due to the accumulation of SSA (13), the exact physiological role of the gene has not been established. The yneI gene is located at 34.75 min on the E. coli chromosome. While gabD is part of the gabDTPC operon (40) and is located at 60.14 min, yneI belongs to a single gene operon without a known function. It was demonstrated that the gabD gene is coexpressed with genes involved in the GABA and main arginine catabolism pathway under nitrogen limitation conditions (39) (Fig. 1). In contrast, our analysis of E. coli gene expression in more than 400 conditions available from the Stanford Microarray Database (3) and M3D Database (17) suggested that yneI is induced under various stress conditions. It was specifically demonstrated that gabD, but not yneI, is under transcriptional control of the NtrC regulator induced under nitrogen-limited conditions (42).
We found that yneI is highly expressed under several stress conditions together with many genes related to the metabolism of nitrogen compounds. For example, when the hupB gene (encoding a DNA-binding protein stabilizing DNA under extreme environmental conditions) is deleted (17), yneI is expressed together with the genes involved in the biosynthesis of arginine, ornithine (argA, argD, argF, argG), and putrescine (speC, speF), as well as the genes involved in putrescine transport (potD, potE, potFGHI, puuP) and catabolism (puuA, puuB, puuD, puuE, ydcW). This expression pattern is shown in Fig. 1. The yneI gene is also highly expressed along with subsets of the aforementioned genes under other stress conditions, such as heat shock (aerobic growth of cells in log phase on morpholinepropanesulfonic acid [MOPS] media with glucose after heat shock at 50°C) and growth on nonoptimal carbon sources (aerobic growth of cells on MOPS media with glycerol). To confirm that the yneI gene plays a role in the metabolism of nitrogen compounds, we investigated the wild-type strain and mutants growth on arginine and putrescine as sole nitrogen sources.
Importance of yneI during bacterial growth on arginine and putrescine.
The growth of the wild-type strain and the gabD and yneI mutants on 5 mM arginine was investigated using minimal medium with 5 g/liter glucose as the carbon source (Fig. 6). The wild type and the gabD mutant grew exponentially on arginine at the same maximal growth rate (0.040 ± 0.004 and 0.039 ± 0.003 h−1), while the yneI mutant grew significantly slower (0.024 ± 0.004 h−1). On 1 mM putrescine as the sole nitrogen source, after ∼60 h of linear growth, the wild type and the gabD mutant started to grow exponentially. The yneI mutant, in contrast, did not grow at all for about 80 h and then grew exponentially and reached the same final cell density (data not shown). The sudden occurrence of exponential growth is consistent with the emergence of a suppressor mutation. Thus, in contrast to the gabD mutant, the yneI mutant cannot grow on putrescine unless a significant metabolic rearrangement takes place. These findings suggest that yneI is more important than gabD when arginine or putrescine is used as the nitrogen source.
FIG. 6.

Growth of E. coli wild-type strain BW25113 (•) and the gabD (▾) and yneI (▪) mutants on M9 minimal medium containing 5 g/liter glucose as the carbon source and 5 mM arginine as the nitrogen source. OD600, optical density at 600 nm.
DISCUSSION
Starting from the computational prediction of the gene responsible for the NAD+/NADP+-specific SSADH, we physiologically and biochemically demonstrated that the yneI gene is responsible for this activity in E. coli. Analyzing expression profile data and growth experiments, we showed that yneI plays an important role during growth on several nitrogen compounds.
We found that compared to gabD, yneI plays a more important role when arginine and putrescine are used as the sole nitrogen sources. While gabD is induced during nitrogen limitation, the product of the yneI gene is the only SSADH that is induced during accumulation of SSA. These results suggest that yneI functions as a valve in preventing accumulation of toxic SSA during metabolism and homeostasis of various nitrogen compounds. For example, it is likely that yneI plays an important role in homeostasis of putrescine which is involved in maintaining chromosomal structure and translational fidelity (7, 11, 42). Previously, Schneider et al. suggested that the induction of the gabDTPC operon during nitrogen limitation may be related to homeostasis of putrescine and other polyamines (40). Although yneI may not be involved in this process during nitrogen limitation, our results suggest that it may be involved in putrescine homeostasis under many other stress conditions, such as DNA disruption, heat shock, and carbon source starvation. It is likely that stress conditions trigger changes in putrescine concentration in order to stabilize DNA and cell structure. The accumulation of excessive putrescine is harmful to cells and may trigger the putrescine catabolism pathway (20).
The availability of the yneI sequence made it possible to investigate the distribution of the gabD and yneI orthologs across phylogenetic space. Using orthology information established based on the best bidirectional sequence alignments from the Integrated Microbial Genomes database (see the supplemental material) (33), we found that both SSADHs have wide distributions in the Archaea and Bacteria kingdoms. Of 495 completed genomes, yneI and gabD have sequence orthologs in 137 (27.7%) and 269 (54.3%), respectively; 65 genomes (13.1%) have orthologs for both genes. Although the sequences of homologs of SSADH genes from 13 sequenced eukaryotic species are more similar to the sequence of gabD (46 to 60% sequence identity) than to the sequence of yneI (30 to 34% sequence identity), the study of Cash et al. (6) provided experimental evidence that the homologous human SSADH gene (ALDH5A1) is the functional ortholog of yneI, as it works with both NAD+ and NADP+ cofactors. Other eukaryotic homologs have sequences similar to the human ALDH5A1 gene sequence, and it is likely that they are also functional orthologs of the yneI gene.
The combined computational-experimental approach used here for the SSADH activity in E. coli can be applied to annotate orphan activities in various microbes. Importantly, the method reported here can be easily extended to less-studied organisms as almost all context-based correlations are calculated based directly on genomic sequences (5, 9, 25, 44). Functional analysis of the predicted gene candidates should improve our understanding of the molecular and cellular roles of orphan activities. In addition, discovered orphan sequences could be used to annotate orthologous genes in many other organisms using sequence homology methods (8).
Supplementary Material
Acknowledgments
This work was partially fonded by the National Institutes of Health NIGMS grant 1R01GM079759 to D.V.
We thank Peter Kharchenko and Michiel de Hoon for valuable discussions and Shin Kurihara for pointing out an error in the text. We also thank the anonymous reviewers for helpful suggestions.
Footnotes
Published ahead of print on 14 September 2007.
Supplemental material for this article may be found at http://jb.asm.org/.
REFERENCES
- 1.Andrade, M. A., N. P. Brown, C. Leroy, S. Hoersch, A. de Daruvar, C. Reich, A. Franchini, J. Tamames, A. Valencia, C. Ouzounis, and C. Sander. 1999. Automated genome sequence analysis and annotation. Bioinformatics 15:391-412. [DOI] [PubMed] [Google Scholar]
- 2.Baba, T., T. Ara, M. Hasegawa, Y. Takai, Y. Okumura, M. Baba, K. A. Datsenko, M. Tomita, B. L. Wanner, and H. Mori. 2006. Construction of Escherichia coli K-12 in-frame, single-gene knockout mutants: the Keio collection. Mol. Syst. Biol. 2:2006.0008. [DOI] [PMC free article] [PubMed] [Google Scholar]
- 3.Ball, C. A., I. A. Awad, J. Demeter, J. Gollub, J. M. Hebert, T. Hernandez-Boussard, H. Jin, J. C. Matese, M. Nitzberg, F. Wymore, Z. K. Zachariah, P. O. Brown, and G. Sherlock. 2005. The Stanford Microarray Database accommodates additional microarray platforms and data formats. Nucleic Acids Res. 33:D580—D582. [DOI] [PMC free article] [PubMed] [Google Scholar]
- 4.Bork, P., L. J. Jensen, C. von Mering, A. K. Ramani, I. Lee, and E. M. Marcotte. 2004. Protein interaction networks from yeast to human. Curr. Opin. Struct. Biol. 14:292-299. [DOI] [PubMed] [Google Scholar]
- 5.Bowers, P. M., M. Pellegrini, M. J. Thompson, J. Fierro, T. O. Yeates, and D. Eisenberg. 2004. Prolinks: a database of protein functional linkages derived from coevolution. Genome Biol. 5:R35. [DOI] [PMC free article] [PubMed] [Google Scholar]
- 6.Cash, C. D., M. Maitre, L. Ossola, and P. Mandel. 1978. Purification and properties of two succinate semialdehyde dehydrogenases from human brain. Biochim. Biophys. Acta 524:26-36. [DOI] [PubMed] [Google Scholar]
- 7.Chattopadhyay, M. K., C. W. Tabor, and H. Tabor. 2006. Polyamine deficiency leads to accumulation of reactive oxygen species in a spe2Delta mutant of Saccharomyces cerevisiae. Yeast 23:751-761. [DOI] [PubMed] [Google Scholar]
- 8.Chen, L., and D. Vitkup. 2007. Distribution of orphan metabolic activities. Trends Biotechnol. 25:343-348. [DOI] [PubMed] [Google Scholar]
- 9.Chen, L. F., and D. Vitkup. 2006. Predicting genes for orphan metabolic activities using phylogenetic profiles. Genome Biol. 7:R17. [DOI] [PMC free article] [PubMed] [Google Scholar]
- 10.Datsenko, K. A., and B. L. Wanner. 2000. One-step inactivation of chromosomal genes in Escherichia coli K-12 using PCR products. Proc. Natl. Acad. Sci. USA 97:6640-6645. [DOI] [PMC free article] [PubMed] [Google Scholar]
- 11.Davis, R. H., D. R. Morris, and P. Coffino. 1992. Sequestered end products and enzyme regulation: the case of ornithine decarboxylase. Microbiol. Rev. 56:280-290. [DOI] [PMC free article] [PubMed] [Google Scholar]
- 12.Donnelly, M. I., and R. A. Cooper. 1981. Succinic semialdehyde dehydrogenases of Escherichia coli: their role in the degradation of p-hydroxyphenylacetate and gamma-aminobutyrate. Eur. J. Biochem. 113:555-561. [DOI] [PubMed] [Google Scholar]
- 13.Donnelly, M. I., and R. A. Cooper. 1981. Two succinic semialdehyde dehydrogenases are induced when Escherichia coli K-12 is grown on gamma-aminobutyrate. J. Bacteriol. 145:1425-1427. [DOI] [PMC free article] [PubMed] [Google Scholar]
- 14.Dover, S., and Y. S. Halpern. 1972. Utilization of gamma-aminobutyric acid as the sole carbon and nitrogen source by Escherichia coli K-12 mutants. J. Bacteriol. 109:835-843. [DOI] [PMC free article] [PubMed] [Google Scholar]
- 15.Eisenberg, D., E. M. Marcotte, I. Xenarios, and T. O. Yeates. 2000. Protein function in the post-genomic era. Nature 405:823-826. [DOI] [PubMed] [Google Scholar]
- 16.Enright, A. J., I. Iliopoulos, N. C. Kyrpides, and C. A. Ouzounis. 1999. Protein interaction maps for complete genomes based on gene fusion events. Nature 402:86-90. [DOI] [PubMed] [Google Scholar]
- 17.Faith, J. J., B. Hayete, J. T. Thaden, I. Mogno, J. Wierzbowski, G. Cottarel, S. Kasif, J. J. Collins, and T. S. Gardner. 2007. Large-scale mapping and validation of Escherichia coli transcriptional regulation from a compendium of expression profiles. PLoS Biol. 5:e8. [DOI] [PMC free article] [PubMed] [Google Scholar]
- 18.Freund, Y., and R. E. Schapire. 1999. A short introduction to Boosting. J. Jpn. Soc. Artif. Intelligence 14:771-780. [Google Scholar]
- 19.Gornall, A., W. Bardawill, and M. David. 1949. Determinations of serum proteins by means of the Biuret reaction. J. Biol. Chem. 177:751-766. [PubMed] [Google Scholar]
- 20.He, Y., K. Kashiwagi, J. Fukuchi, K. Terao, A. Shirahata, and K. Igarashi. 1993. Correlation between the inhibition of cell growth by accumulated polyamines and the decrease of magnesium and ATP. Eur. J. Biochem. 217:89-96. [DOI] [PubMed] [Google Scholar]
- 21.Heinemann, M., A. Kummel, R. Ruinatscha, and S. Panke. 2005. In silico genome-scale reconstruction and validation of the Staphylococcus aureus metabolic network. Biotechnol. Bioeng. 92:850-864. [DOI] [PubMed] [Google Scholar]
- 22.Jakoby, W. B., and E. M. Scott. 1959. Aldehyde oxidation. III. Succinic semialdehyde dehydrogenase. J. Biol. Chem. 234:937-940. [PubMed] [Google Scholar]
- 23.Jansen, R., H. Yu, D. Greenbaum, Y. Kluger, N. J. Krogan, S. Chung, A. Emili, M. Snyder, J. F. Greenblatt, and M. Gerstein. 2003. A Bayesian networks approach for predicting protein-protein interactions from genomic data. Science 302:449-453. [DOI] [PubMed] [Google Scholar]
- 24.Karp, P. D. 2004. Call for an enzyme genomics initiative. Genome Biol. 5:401. [DOI] [PMC free article] [PubMed] [Google Scholar]
- 25.Kharchenko, P., L. Chen, Y. Freund, D. Vitkup, and G. M. Church. 2006. Identifying metabolic enzymes with multiple types of association evidence. BMC Bioinformatics 7:177. [DOI] [PMC free article] [PubMed] [Google Scholar]
- 26.Kharchenko, P., G. M. Church, and D. Vitkup. 2005. Expression dynamics of a cellular metabolic network. Mol. Syst. Biol. 1:2005.0016. [DOI] [PMC free article] [PubMed] [Google Scholar]
- 27.Kharchenko, P., D. Vitkup, and G. M. Church. 2004. Filling gaps in a metabolic network using expression information. Bioinformatics 20(Suppl. 1):I178-I185. [DOI] [PubMed] [Google Scholar]
- 28.Kitagawa, M., T. Ara, M. Arifuzzaman, T. Ioka-Nakamichi, E. Inamoto, H. Toyonaga, and H. Mori. 2005. Complete set of ORF clones of Escherichia coli ASKA library (a complete set of E. coli K-12 ORF archive): unique resources for biological research. DNA Res. 12:291-299. [DOI] [PubMed] [Google Scholar]
- 29.Kuepfer, L., U. Sauer, and L. M. Blank. 2005. Metabolic functions of duplicate genes in Saccharomyces cerevisiae. Genome Res. 15:1421-1430. [DOI] [PMC free article] [PubMed] [Google Scholar]
- 30.Kurihara, S., S. Oda, K. Kato, H. G. Kim, T. Koyanagi, H. Kumagai, and H. Suzuki. 2005. A novel putrescine utilization pathway involves gamma-glutamylated intermediates of Escherichia coli K-12. J. Biol. Chem. 280:4602-4608. [DOI] [PubMed] [Google Scholar]
- 31.Lespinet, O., and B. Labedan. 2005. Orphan enzymes? Science 307:42. [DOI] [PubMed] [Google Scholar]
- 32.Marek, L. E., and J. M. Henson. 1988. Cloning and expression of the Escherichia coli K-12 sad gene. J. Bacteriol. 170:991-994. [DOI] [PMC free article] [PubMed] [Google Scholar]
- 33.Markowitz, V. M., F. Korzeniewski, K. Palaniappan, E. Szeto, G. Werner, A. Padki, X. Zhao, I. Dubchak, P. Hugenholtz, I. Anderson, A. Lykidis, K. Mavromatis, N. Ivanova, and N. C. Kyrpides. 2006. The integrated microbial genomes (IMG) system. Nucleic Acids Res. 34:D344—D348. [DOI] [PMC free article] [PubMed] [Google Scholar]
- 34.Misra, R. V., R. S. Horler, W. Reindl, I. I. Goryanin, and G. H. Thomas. 2005. EchoBASE: an integrated post-genomic database for Escherichia coli. Nucleic Acids Res. 33:D329—D333. [DOI] [PMC free article] [PubMed] [Google Scholar]
- 35.Overbeek, R., M. Fonstein, M. D'Souza, G. D. Pusch, and N. Maltsev. 1999. The use of gene clusters to infer functional coupling. Proc. Natl. Acad. Sci. USA 96:2896-2901. [DOI] [PMC free article] [PubMed] [Google Scholar]
- 36.Reed, J. L., T. D. Vo, C. H. Schilling, and B. O. Palsson. 2003. An expanded genome-scale model of Escherichia coli K-12 (iJR904 GSM/GPR). Genome Biol. 4:R54. [DOI] [PMC free article] [PubMed] [Google Scholar]
- 37.Rost, B. 2002. Enzyme function less conserved than anticipated. J. Mol. Biol. 318:595-608. [DOI] [PubMed] [Google Scholar]
- 38.Samsonova, N. N., S. V. Smirnov, A. E. Novikova, and L. R. Ptitsyn. 2005. Identification of Escherichia coli K12 YdcW protein as a gamma-aminobutyraldehyde dehydrogenase. FEBS Lett. 579:4107-4112. [DOI] [PubMed] [Google Scholar]
- 39.Schneider, B. L., A. K. Kiupakis, and L. J. Reitzer. 1998. Arginine catabolism and the arginine succinyltransferase pathway in Escherichia coli. J. Bacteriol. 180:4278-4286. [DOI] [PMC free article] [PubMed] [Google Scholar]
- 40.Schneider, B. L., S. Ruback, A. K. Kiupakis, H. Kasbarian, C. Pybus, and L. Reitzer. 2002. The Escherichia coli gabDTPC operon: specific gamma-aminobutyrate catabolism and nonspecific induction. J. Bacteriol. 184:6976-6986. [DOI] [PMC free article] [PubMed] [Google Scholar]
- 41.Skinner, M. A., and R. A. Cooper. 1982. An Escherichia coli mutant defective in the NAD-dependent succinate semialdehyde dehydrogenase. Arch. Microbiol. 132:270-275. [DOI] [PubMed] [Google Scholar]
- 42.Tabor, C. W., and H. Tabor. 1985. Polyamines in microorganisms. Microbiol. Rev. 49:81-99. [DOI] [PMC free article] [PubMed] [Google Scholar]
- 43.Tian, W., and J. Skolnick. 2003. How well is enzyme function conserved as a function of pairwise sequence identity? J. Mol. Biol. 333:863-882. [DOI] [PubMed] [Google Scholar]
- 44.von Mering, C., L. J. Jensen, B. Snel, S. D. Hooper, M. Krupp, M. Foglierini, N. Jouffre, M. A. Huynen, and P. Bork. 2005. STRING: known and predicted protein-protein associations, integrated and transferred across organisms. Nucleic Acids Res. 33:D433—D437. [DOI] [PMC free article] [PubMed] [Google Scholar]
- 45.Wilson, C. A., J. Kreychman, and M. Gerstein. 2000. Assessing annotation transfer for genomics: quantifying the relations between protein sequence, structure and function through traditional and probabilistic scores. J. Mol. Biol. 297:233-249. [DOI] [PubMed] [Google Scholar]
- 46.Yanai, I., A. Derti, and C. DeLisi. 2001. Genes linked by fusion events are generally of the same functional category: a systematic analysis of 30 microbial genomes. Proc. Natl. Acad. Sci. USA 98:7940-7945. [DOI] [PMC free article] [PubMed] [Google Scholar]
- 47.Zimmer, D. P., E. Soupene, H. L. Lee, V. F. Wendisch, A. B. Khodursky, B. J. Peter, R. A. Bender, and S. Kustu. 2000. Nitrogen regulatory protein C-controlled genes of Escherichia coli: scavenging as a defense against nitrogen limitation. Proc. Natl. Acad. Sci. USA 97:14674-14679. [DOI] [PMC free article] [PubMed] [Google Scholar]
Associated Data
This section collects any data citations, data availability statements, or supplementary materials included in this article.