

Abstract
Glucocorticoids are widely used in the treatment of inflammatory and other diseases. However, high-dose or chronic administration often triggers troublesome side effects such as metabolic syndrome and osteoporosis. We recently described that one glucocorticoid receptor gene produces eight translational glucocorticoid receptor isoforms that have distinct gene-regulatory abilities. We show here that specific, but not all, glucocorticoid receptor isoforms induced apoptosis in human osteosarcoma U-2 OS bone cells. Whole human genome microarray analysis revealed that the majority of the glucocorticoid target genes were selectively regulated by specific glucocorticoid receptor isoforms. Real-time PCR experiments confirmed that proapoptotic enzymes necessary for cell death, granzyme A and caspase-6, were induced by specific glucocorticoid receptor isoforms. Chromatin immunoprecipitation assays further suggested that glucocorticoid receptor isoform-dependent induction of proapoptotic genes was likely due to selective coregulator recruitment and chromatin modification. Interestingly, the capabilities to transrepress proinflammatory genes were similar among glucocorticoid receptor isoforms. Together, these findings provide new evidence that translational glucocorticoid receptor isoforms can elicit distinct glucocorticoid responses and may be useful for the development of safe glucocorticoids with reduced side effects.
Glucocorticoids are widely used in the clinic to treat a variety of diseases including inflammation, cancer, and autoimmune disorders (23). Responsiveness to glucocorticoid therapy, however, differs considerably among patients, and even within the same individual, different tissues have different glucocorticoid responsivenesses (3). For example, tissue-specific glucocorticoid resistance after chronic exposure frequently occurs in patients with rheumatoid arthritis, osteoarthritis, Crohn's disease, ulcerative colitis, and asthma (10). In addition, patients chronically treated with glucocorticoids suffer side effects including metabolic syndrome, muscle wasting, and osteoporosis, which are frequently accompanied by fracture and fatality, particularly in the elderly. Therefore, there has been a focus on the development of “safe glucocorticoids” characterized by efficient anti-inflammatory actions and minimal side effects. Glucocorticoid-induced osteoporosis has been attributed to multiple mechanisms such as impaired intestinal calcium absorption, increased osteoclast activity, suppressed osteoblastic formation, and stimulated osteoblast apoptosis (32). Studies of transgenic animals overexpressing 11-β-hydroxysteroid dehydrogenase 2, an enzyme that reduces the active corticosteroid level, in osteoblasts and osteocytes suggest that glucocorticoids exert their cell-killing effects directly on bone cells (21).
An unresolved question in the field is how glucocorticoids selectively kill bone cells and protect other cells such as hepatocytes from death. Although tissue-selective ligand availability and cofactor recruitment can partially explain the cell type-selective effects of glucocorticoids (1, 9, 11, 12), recent evidence suggests that tissue-selective expression of glucocorticoid receptor (GR) isoforms may also play a critical role in the tissue-selective responsiveness of glucocorticoids. GR isoforms include GRα and GRβ, which are generated via alternative splicing, with GRα being expressed at relatively higher levels in the majority of the tissues examined (17). In addition, each GR transcript generates additional isoforms via alternative translation initiation mechanisms (18). The GR-A isoform, one of the eight translational isoforms, is the full-length receptor, and the other GR isoforms have smaller N termini (18). We previously demonstrated that translationally generated GRα isoforms regulate both common and distinct sets of genes in the same cell (18). Here, we expressed wild-type human GRα and individual GRα isoforms in U-2 OS cells, a human osteoblastic sarcoma cell line that lacks endogenous GR, and show that these translationally generated GR isoforms selectively regulated the genome. Importantly, the GR isoforms had distinct capabilities to activate the cell death program despite having identical DNA binding and ligand binding domains. The molecular basis for this functional difference among GR isoforms appeared to involve selective coactivator recruitment and chromatin modification on proapoptotic genes. Interestingly, the ability to repress NF-κB activity was comparable among GR isoforms.
MATERIALS AND METHODS
Reagents and antibodies.
Dexamethasone (1,4-pregnadien-9α-fluoro-16α-methyl-11β,17,21-triol-3,20-dione) (DEX) was purchased from Steraloids (Newport, RI). Rabbit anti-GR antibody 57 was previously described (6). All other primary antibodies were obtained from Upstate (Charlottesville, VA), except rabbit anti-granzyme A (GZMA) (Santa Cruz Biotechnology, Santa Cruz, CA) and anti-poly(ADP-ribose) polymerase (PARP) (Pharmingen, San Diego, CA). Goat anti-rabbit antibodies conjugated with horseradish peroxidase were obtained from Jackson Immunoresearch (West Grove, PA). All other reagents were obtained from Sigma (St. Louis, MO) unless otherwise specified.
Animals.
The studies were approved by the institutional animal use committee at Northwestern University. After terminal anesthesia, spleens were harvested from 6-week-old male C57BL/6 mice (Jackson Laboratory, Bar Harbor, ME), and calvaria were harvested from 1- to 2-day-old C57BL/6 pups. Primary spleen cells were subjected to red blood cell lysing and gradient centrifugation purification. Calvaria were trimmed and subjected to 15 min of collagenase (20 U/ml; MP Biomedicals, Solon, OH) digestion threetimes. Cells from the last two digestions were harvested and cultured until Western blot analysis.
Cell lines.
COS-1 cells, U-2 OS parental cells, and U-2 OS cells expressing each of the GR isoforms were described previously (18). U-2 OS cell subclones expressing two GR isoforms were produced as described previously (18). The expression of one GR isoform in these subclones can be down-regulated by doxycycline, and the expression of the second GR isoform, the GR-A isoform, derived from pcDNA-human GRα containing an optimal Kozak context, is constitutive. Cells were treated with vehicle, DEX (100 nM), and/or lipopolysaccharide (LPS) (1 μg/ml).
Stably expressing siRNAs in U-2 OS cells.
U-2 OS cells expressing the GR-C isoform were plated onto a 100-mm dish at 80% confluence and transfected with 15 μg of plasmid DNA expressing each small interfering RNA (siRNA). Sequences of siRNAs against GZMA were CACCTCAACTGGATAATTA, ACGCGAAGGTGACCTTAAA, and TAACCTACAGTACGTATCA (scrambled); and sequences of siRNAs against caspase-6 (CASP6) were ACATTAACTGGCTTGTTCA, GATGCAGCCTCCGTTTACA, and CTATAATTACCAAGTGCTC (scrambled). Each siRNA was cloned into pSUPER.retro.puro (Oligoengine, Seattle, WA) and transfected into U-2 OS GR-C cells using Transit LT1 reagent (Mirus Corp., Madison, WI) at 5 μl per 1 μg DNA according to the manufacturer's protocol. One day after transfection, cells were passaged onto three 150-mm dishes, and selection was initiated 24 h later by supplementing the growth medium with 5 μg/ml of puromycin (Invitrogen, Carlsbad, CA). Selection lasted for 4 weeks, and the medium was replenished every 5 days. Healthy colonies were then transferred onto 12-well plates and propagated in growth medium containing 1 μg/ml of puromycin. Positive clones were screened using Western blot analysis.
Western blot analysis.
Procedures for preparing cell lysates and animal tissues for Western blot analysis were previously described (20). Lysates containing 10 to 50 μg of proteins were resolved on 4 to 12% NuPage Bis-Tris gels (Invitrogen), and titers for antibodies were 1:1,000 to 1:2,500 for anti-GR 57 antibodies, 1:150 for anti-GZMA, 1:500 for anti-CASP6, 1:2,000 for anti-PARP, and 1:10,000 to 1:40,000 for anti-β-actin. Densitometry analysis was performed using NIH Image software.
[3H]DEX binding assay.
Cytosolic GR was prepared by resuspending cells in binding buffer (10 nM HEPES, 20 nM NaMoO4, 1 nM EDTA, and 1 nM dithiothreitol containing protease inhibitor cocktails [Roche, Indianapolis, IN] [pH 7.35] at 4°C) and sonication for 10 s at setting 4 on a Branson 150 sonifier (Branson Ultrasonics Co., Danbury, CT), followed by centrifuging at 55,000 rpm for 45 min at 4°C. Eight concentrations of [3H]DEX (Perkin-Elmer, Wellesley, MA) ranging from 0.5 to 2,500 nM were used for binding reactions. After incubation for 16 h at 4°C, unbound [3H]DEX was absorbed and stripped using activated charcoal. The amount of [3H]DEX bound to GR was counted on a 1450 Microbeta Wallac Jet (Perkin-Elmer). Nonspecific binding was defined by the addition of a 100-fold excess of unlabeled DEX. Saturable binding was normalized to protein content. The one-site binding subroutine in Prism (GraphPad, San Diego, CA) was used to obtain the total binding (Bmax) and apparent Kd (dissociation constant) values.
Microarray analysis.
Gene expression analysis was conducted using Agilent Whole Human arrays (Agilent Technologies, Palo Alto, CA). Three separate biological replicates of cytoplasmic RNA samples were harvested and purified from each of the U-2 OS cell lines stably expressing human GRα (hGRα), -A, -B, -C3, or -D3 treated with 100 nM DEX for 0 or 6 h using RNeasy Midi kits (Invitrogen). Total RNA was amplified using the Agilent Low RNA Input fluorescent linear amplification lit protocol. Starting with 500 ng of total RNA, Cy3-labeled cRNA was produced according to the manufacturer's protocol. For each sample, 1.5 μg of Cy3-labeled cRNAs was fragmented using the Agilent In Situ Hybridization kit protocol. Hybridizations were performed for 17 h in a rotating hybridization oven at 65°C at 4 rpm. Slides were washed with a solution containing 6× SSPE (1× SSPE is 0.18 M NaCl, 10 mM NaH2PO4, and 1 mM EDTA [pH 7.7]) plus 0.005% N-lauroyl sarcosine for 1 min and then washed in a solution containing 0.06× SSPE plus 0.005% N-lauroyl sarcosine for 1 min at 37°C. The slides were dried by slowly removing from second wash solution and then scanned with an Agilent G2565 scanner (10 μm and with extended dynamic range) and processed with Agilent Feature Extraction v9.1. Consequently, three separate chips were used for each of the isoforms at each treatment condition, yielding 30 chips in total: five isoforms by three biological replicates by two time points. The resulting files were imported into the Rosetta Resolver system (version 6.0; Rosetta Biosoftware, Kirkland, WA). This system performs data preprocessing and error modeling (33). The ratios (treated to controls) were analyzed at the Entrez gene level in Resolver and were considered to be differentially expressed if the P value was less than 0.0001. Clustering analysis was performed using the Rosetta Resolver analysis software. The list of genes used in the clustering came from GeneSpring's Gene Ontology SLIMS, Cell Death GO 0008219 (2).
Real-time PCR.
RNA samples were extracted from cells using an Absolutely RNA RT-PCR Miniprep kit (Stratagene, La Jolla, CA) and treated with DNase according to the manufacturer's protocol. The level of individual mRNA in each sample was measured using a one-step reverse transcription-PCR procedure on a Prism 7900HT thermocycler (Applied Biosystems, Foster City, CA). Each reaction mixture (25-μl total volume) contained 12.5 μl of 2× Universal PCR Master Mix, No AmpErase (Applied Biosystems), 1.25 μl of the predeveloped gene expression system (Applied Biosystems), 250 ng of total RNA, 2 U/μl of RNase inhibitor (Roche Diagnostics), and 0.4 U/μl murine leukemia virus reverse transcriptase (Roche). Each experiment was performed in duplicates at least twice. Quantification was achieved using the Sequence Detection software 2.0 absolute level subroutine (Applied Biosystems). Human cyclophilin B mRNA levels were measured as described above by using primers 5′-AGATGGCAAGCATGTGGTGTT and 5′-TACTCCTTGGCGATGGCAA and probe 5′-ATCATCGCAGACTGCGGCAAGATCGA labeled with a 6-carboxyfluorescein (FAM) reporter at the 5′ end and a 6-carboxytetramethylrhodamine quencher at the 3′ end. Human GAPDH (glyceraldehyde-3-phosphate dehydrogenase) levels were measured as described above by using primers 5′-GAAGGTGAAGGTCGGAGTC and 5′-GAAGATGGTGATGGGATTT and probe 5′-CAAGCTTCCCGTTCTCAGCC labeled with FAM reporter at the 5′ end and a 6-carboxytetramethylrhodamine quencher at the 3′ end. Cyclophilin B mRNA or GAPDH levels were used to normalize the levels of genes of interests.
Flow cytometry analysis.
Labeling with annexin V and propidium iodide (PI) was processed using the TACS annexin V-fluorescein isothiocyanate apoptosis detection kit (Trevigen, Inc., Gaithersburg, MD) and 10 μg/ml PI according to the manufacturer's instructions. Caspase activity was determined using CaspaTag In Situ Assay kits (Chemicon International, Temecula, CA) for the fluorescence detection of caspase-3 and caspase-7 activities according to the manufacturer's instructions. A total of 1.5 × 10⁵ control or treated cells were processed, and 1 × 10⁴ cells were analyzed using a BD (Franklin Lakes, NJ) FACSort flow cytometer with an excitation wavelength of 488 nm and emission wavelength of 530 nm (for annexin V-fluorescein isothiocyanate and CaspaTag) or 585 nm (for PI). The DNA content of each sample was determined by fixing cells via the slow addition of cold 70% ethanol to a volume of ∼1.5 ml, which was then adjusted to 5 ml with cold 70% ethanol. The samples were stored at 4°C overnight before analysis. For flow cytometric analysis, the fixed cells were pelleted, washed once in phosphate-buffered saline, and stained in 1 ml of 20 μg/ml of PI containing 1 mg/ml RNase in phosphate-buffered saline for 20 min. Cells (7,500) were analyzed by flow cytometry by gating onto a PI area-versus-width dot plot to exclude cell debris and cell aggregates. The percentage of degraded DNA was determined by dividing the number of cells with subdiploid DNA by the total number of cells examined under each experimental condition.
NF-κB reporter assays.
COS-1 cells were plated at approximately 80% confluence on 12-well plates. Twenty nanograms of pTRE-GRα, -A, -B, -C, or -D; 200 ng pCMVp65 (27); 150 ng pGL2-3XMHCLuc (27); and 20 ng of pGL3-hRL (18) were transfected into COS-1 cells using Transit LT1 reagent at 3 μl per 1 μg DNA according to the manufacturer's protocol. Drug or vehicle treatment started 4 h after transfection and lasted for 20 h in growth medium supplemented with 5% charcoal-dextran-stripped fetal calf serum. Luciferase activity was measured as previously described (19). In each experiment, the firefly luciferase activity normalized to the Renilla luciferase activity was measured in triplicate and averaged. Each experiment was repeated three times.
ChIP assay.
Chromatin immunoprecipitation (ChIP) assays were performed using a ChIP kit from Upstate according to the manufacturer's protocol. Briefly, 5 × 10⁶ cells grown on 150-mm dishes supplemented with charcoal-stripped fetal bovine serum for 3 days were treated with vehicle or DEX (100 nM) for 6 h. Cells were then harvested in lysis buffer in the presence of protease inhibitors sonicated on a Branson Sonifier 150 at setting 4 with 10-s pulses four times on ice. The amount of total input DNA for each immunoprecipitation reaction was 35 μg. Sources of antibodies are listed above. The amounts of antibodies per immunoprecipitation reaction were 4 μl for anti-GR, 2 μl for anti-CBP, 5 μl for anti-p300, 5 μl for anti-acetylated H4, and 2 μl for anti-phosphorylated polymerase II. The level of precipitated DNA containing the GZMA promoter region (146 bp) was quantified using real-time PCR analysis. The primer sequences were 5′-GCACTGTGCCCTATTCAAGAAACC and 5′-ACACAAGGCAAACCATACATGCAG, and the probe (FAM-labeled) sequence was 5′-ATCCAAGAACATCTGGTGCAGGAGGT. All measurements were normalized to the levels of input DNA. In addition, precipitated DNA containing other promoter regions was subjected to PCR analysis, and the primer sequences used were 5′-GCCACATGCTGTCCTTGTAGTGAA and 5′-AGGGAAGGCTTTGGAGGGTTGTAA for H+/K+-exchanging ATPase α (ATP4A), 5′-ATC TGT GGG ATC AGG CTG AG and 5′-CTC TGT GGG ACA GAG TTG TC for vitamin D receptor (VDR), 5′-AAC GGA AAG GAC CGG CAG TTG and 5′-CTG GAA AGT CCT TCC GAC CA for inhibitor of nuclear factor-κBα (I-κBα), and 5′-CTT AAC TCA GGA ACC ATC CTC TCT G and 5′-TGC CCT CCT CTT CCT GAA G for CASP6.
Statistical analysis.
One-way analysis of variance (ANOVA) was performed, followed by a Tukey post hoc comparison using Prism software (GraphPad, San Diego, CA) to compare the differences among treated cells and controls. A P value of <0.05 was considered to be significant.
Microarray data accession number.
The microarray data in this publication were deposited in NCBI's Gene Expression Omnibus (http://www.ncbi.nlm.nih.gov/geo/) (7) and are accessible through Gene Expression Omnibus series accession number GSE6711.
RESULTS
Induction of apoptosis by stable expression of wild-type human GRα in U-2 OS cells.
To determine whether glucocorticoids can directly induce programmed cell death via GR in bone cells, we stably expressed wild-type hGRα in U-2 OS cells, a human osteosarcoma cell line lacking endogenous GR (Fig. 1). When treated with the synthetic glucocorticoid DEX (100 nM), a striking contrast was observed between the parental cells and cells expressing GRα: cells expressing GRα were killed upon exposure to DEX, while parental cells lacking GRα were not killed. To determine whether DEX-induced cell death in cells expressing GRα is occurring by apoptotic mechanisms, we examined a series of morphological and biochemical parameters that are well-recognized integrative components of the programmed cell death process. Apoptotic characteristics displayed by U-2 OS cells expressing GRα included distinct chromatin condensation (Fig. 1B), a loss of cell membrane integrity (Fig. 1C), externalization of phosphatidyl serine (Fig. 1D), PARP cleavage (Fig. 1E), DNA degradation (Fig. 1F), and caspase activity (Fig. 1G). In stark contrast, U-2 OS cells lacking GR did not exhibit any of these apoptotic phenotypes following glucocorticoid treatment. These findings support the notion that U-2 OS cells are fully capable of undergoing apoptosis in response to glucocorticoids and that GR expression is required for the proapoptotic actions of glucocorticoids in these cells.
FIG. 1.

GRα induced apoptosis in U-2 OS cells. (A) Cells stably expressing hGRα were subjected to Western blot analysis. These cells express GR-A, -B, -C, and -D isoforms as indicated. (B) When treated with vehicle or DEX (100 nM) for 48 h, nucleus staining showed chromatin condensation in DEX-treated cells containing GR but not in those lacking GR. (C) Flow cytometric analysis of PI labeling showed that a higher percentage of cells expressing GR were PI positive, as indicated in the histogram highlighted with an arrow. (D) Annexin V labeling showed that GR-expressing cells, when treated with DEX, had a greater number of cells positive for cell surface annexin V and negative for PI, as indicated in the lower right quadrants on the dot plots. (E) The active PARP level was increased in GR-expressing cells as determined by Western blot analysis. (F) DNA degradation was induced in GR-expressing cells as indicated by arrows on the histogram. (G) Caspase activity was elevated in GR-expressing cells, as indicated by arrows on the histogram.
Stable expression of GR isoforms in U-2 OS cells.
As seen in Fig. 1A, one species of GRα message produces multiple GR isoforms (18). However, the physiologic consequences of the expression of these multiple isoforms of GR are not fully understood. To determine whether the GR isoforms differ in their ability to induce apoptosis in bone cells, we stably expressed GRα-A, -B, -C (C3 as a representative of three GR-C isoforms, C1, C2, and C3), and -D (D3 as a representative of three GR-D isoforms, D1, D2, and D3) isoforms individually in U-2 OS cells (18). GR protein levels were comparable among individual isoforms as determined by both Western blot analysis and [3H]DEX ligand binding assays (Fig. 2A). Western blot analysis showed that individual isoforms had similar expression levels in the absence or presence of DEX (100 nM for 2 h) and that the clone expressing wild-type GRα contained the combination of all GR isoforms. The Bmax and apparent Kd values for cytosolic receptors obtained from cells expressing GRα, -A, -B, -C, and -D isoforms were similar (Fig. 2A). In addition, the half-life of each of the GR isoforms was measured using Western blot analysis as well. There was no difference among the half-lives of the GR isoforms. The half-lives of the GR isoforms in the absence of ligand were 12 to 15 h, and exposure to DEX (100 nM) reduced the half-live of the GR isoforms to ∼6 h (Fig. 2B), indicating that all GR isoforms are fully capable of undergoing ligand-dependent downregulation (31). Previous studies indicate that all GR isoforms produced in these U-2 OS cells are functional, as all GR isoforms regulate transiently expressed reporter genes and endogenous U-2 OS genes (18).
FIG. 2.

Stable expression of GR isoforms in U-2 OS cells. (A) Individual GRα isoforms were expressed at comparable levels in the absence and presence of DEX (100 nM for 2 h) as determined by Western blot analysis and ligand binding assay. Additional bands between the GR-C and -D isoforms may be nonspecific signals, and they were not consistently detected. Bmax and Kd values ± standard errors of the means (SEM) are shown. (B) The half-lives of each GR isoform were similar. The expression of each GR isoform was turned off by doxycycline. The GR protein level was determined in the absence or presence of DEX (100 nM) by Western blot analysis.
GR isoform-selective induction of apoptosis.
When the U-2 OS cells stably expressing individual GR isoforms were treated with DEX (100 nM), cell death occurred in a GR isoform-selective manner (Fig. 3). Cells expressing the GR-C isoform initiated the cell death process as early as 12 h after DEX administration, whereas cells expressing other GR isoforms did not do so until approximately 20 h after DEX exposure (Fig. 3B). By 48 h, 30% of the cells expressing the GRα, -A, or -B isoform underwent apoptosis (Fig. 3), whereas more than 50% of cells expressing the GR-C isoform were killed by the same treatment (P < 0.05). Cells expressing the GR-D isoform had significantly less cell death than did cells expressing any of the other GR isoforms. These experiments indicate that GR-C isoform-expressing bone cells were killed by DEX earlier (by 12 h) and to a greater extent than other GR isoforms, whereas the GR-D isoform-expressing cells were relatively resistant to the apoptosis-inducing actions of glucocorticoid. This observation was confirmed in a second set of U-2 OS cell clones expressing each GR isoform (Fig. 4). These results suggest the possibility that GR isoform-specific apoptosis may occur in U-2 OS cells. Indeed, apoptotic landmarks including the externalization of phosphatidyl serine (Fig. 3C), PARP cleavage (Fig. 3D), DNA degradation (Fig. 3E), and caspase activity (Fig. 3F) all indicated GR isoform-selective regulation. For all apoptotic markers examined, the GRα, -A, and -B isoforms had similar efficacies, and the GR-C isoform was twice as efficacious. For several markers, the GR-D isoform had significantly less activity than the GRα, -A, and -B isoforms (Fig. 3).
FIG. 3.

GR isoforms differentially induced apoptosis in U-2 OS cells. (A) When treated with vehicle or DEX (100 nM) for 48 h, nucleus staining showed chromatin condensation in DEX-treated cells containing GR. (B) Flow cytometric analysis of PI labeling showed that a high percentage of cells expressing the GR-C isoforms were PI positive, whereas the GR-D-expressing cells were relatively resistant to DEX killing. Time course experiments showed that GR-C isoform-expressing cells had an earlier onset of cell death than cells expressing other GR isoforms, and GR-D isoform-expressing cells had less cell death than cells expressing the other GR isoforms after 48 h of DEX treatment. (C) Annexin V labeling showed that GR-C-expressing cells, when treated with DEX, had a greater number of cells positive for cell surface annexin V and negative for PI. Similar patterns were also observed for the PARP level (D), DNA degradation (E), and caspase activation (F). Average results from five to six experiments are presented in the bar graph. One-way ANOVA was performed to compare values from DEX-treated cells expressing different GR isoforms, which was followed by Tukey post hoc analysis. *, significantly higher than that of GRα (P < 0.05); **, significantly lower than that of GRα (P < 0.05).
FIG. 4.

Characterization of two sets of U-2 OS clones. (A) The levels of GR isoforms were comparable in each set of clones. (B) GR isoform-selective killing of U-2 OS cells by DEX (100 nM, 48 h) was observed in both sets of clones. The first set of clones was extensively examined, as shown in the other figures. *, significantly higher than GRα; **, significantly lower than GRα.
Genome-wide gene regulation by selective GR isoforms.
The time course experiments revealed that apoptosis in these cells occurred approximately 12 to 20 h after DEX treatment (Fig. 3B). These data suggest that de novo gene expression may be required to induce cell death. Although transcription is required for glucocorticoid-induced apoptosis in several model systems (22, 29, 35), the identities of the glucocorticoid-regulated apoptotic genes in bone cells are relatively unknown (18). Thus, we performed whole human genome microarray analysis. Analysis of 41,079 gene probes revealed that targets of GR isoforms were widespread across the genome (Fig. 5A). Clustering analysis revealed that each GR isoform acted as a potent regulator of gene expression and that each GR isoform has a distinct gene regulation profile. The numbers of genes regulated by each isoform (100 nM DEX for 6 h [n = 3; P < 0.0001]) (Fig. 5B) were 2,978 (GRα), 3,451 (GR-A), 2,945 (GR-B), 3,252 (GR-C), and 1,761 (GR-D). Collectively, the total number of genes regulated by at least one GR isoform reached 6,501. Consistent with a previous report that analyzed a limited number of genes (18), we show here that the majority of the GR target genes were selectively regulated by the GR isoforms. The number of genes commonly regulated by all GR isoforms was 468 (Fig. 5B). Each GR isoform regulated a unique set of genes in addition to the commonly regulated genes.
FIG. 5.

Widespread and selective gene regulation by GR isoforms. (A) Clustering analysis of the 6,501 genes regulated by at least one GR isoform after 6 h of DEX treatment. The gene targets of each GR isoform are diverse and distinct. (B) Each of the GR isoforms regulated a unique set of genes. The numbers of genes induced (red) or repressed (blue) by each isoform are shown. Dotted lines mark the number of genes regulated by all isoforms. (C) Clustering analysis of 301 genes involved in cell death indicated that the majority of these genes were selectively regulated by GR isoforms. As highlighted by the brackets, GR-D isoforms did not regulate a series of genes as robustly as the other GR isoforms.
Regulation of apoptotic genes by selective GR isoforms.
Further analysis of the GR target genes assisted by the Gene Ontology Consortium (2) revealed 301 cell death-related genes regulated by at least one of the GR isoforms (Fig. 5C and Table 1). It appeared that these genes were selectively regulated by GR isoforms (Fig. 5C). The number of genes regulated by each GR isoform varied: 164, 176, 166, 158, and 70 genes for the GRα, -A, -B, -C, and -D isoforms, respectively. Only 25 genes in this list were commonly regulated by all GR isoforms (Table 1). Many of the induced genes are proapoptotic. These included CASP6, caspase-7, receptor-interacting serine/threonine kinase 1, tumor necrosis factor (TNF) receptor superfamily members 1b and 10b, GZMA, DNase I-like 3, and caspase recruitment domain family members 12 and 14. In addition, there were repressed antiapoptotic genes. These included B-cell CLL/lymphoma 2 (BCL2)-associated athanogene 2, myeloid cell leukemia sequence 1 (MCL1), and Bcl-xL (BCL2L1) genes.
TABLE 1.
Changes (n-fold) in genes regulated by GR isoformsa
| Entrez gene ID | Gene | Fold change
|
||||
|---|---|---|---|---|---|---|
| GRα | GRα-A | GRα-B | GRα-C | GRα-D | ||
| 2 | A2M | 1.47 | 2.28* | 3.26* | 3.40* | −1.13 |
| 9625 | AATK | 1.20 | 3.29* | 1.63* | 2.69* | 1.75 |
| 25 | ABL1 | −2.10* | −1.88 | −1.99* | −2.23* | −1.29 |
| 87 | ACTN1 | −1.27* | −1.29* | −1.30* | −1.23 | −1.09 |
| 88 | ACTN2 | 9.88 | 11.08* | 3.58* | 5.77* | −1.35 |
| 150209 | AIFL | 1.00 | 8.87* | 1.45 | 1.94 | 16.94* |
| 207 | AKT1 | −1.53 | −1.76 | −1.48 | −1.51* | −1.18 |
| 208 | AKT2 | −1.58* | −1.26 | −1.27* | −1.37 | −1.12 |
| 347902 | AMIGO2 | −18.86* | −19.68* | −15.26* | −9.55* | −24.43* |
| 51129 | ANGPTL4 | −7.33 | −11.44* | −3.76 | −10.84 | 1.15 |
| 348 | APOE | 2.42* | 1.37 | 1.40 | 1.76* | 1.55 |
| 80833 | APOL3 | 1.22 | −1.06 | 1.27 | 2.08* | −1.11 |
| 54840 | APTX | −1.71* | −1.39* | −1.20 | −1.44* | 1.14 |
| 51742 | ARID4B | −1.34 | −1.32 | −1.14 | −1.39* | −1.37 |
| 9140 | ATG12 | −1.05 | 1.00 | 1.20* | 1.28* | 1.19 |
| 23192 | ATG4B | 1.37 | 1.43* | 1.19 | 1.34* | 1.19 |
| 6310 | ATXN1 | −3.70* | −4.70* | −3.27* | −3.58* | −3.21 |
| 6311 | ATXN2 | −1.27 | −1.31 | −1.34* | −1.49 | −1.09 |
| 64651 | AXUD1 | −3.65* | −3.01* | −1.70* | −3.53* | 1.36 |
| 573 | BAG1 | −1.42 | −1.39* | −1.14 | −1.40 | 1.02 |
| 9532 | BAG2 | −3.20* | −2.26* | −1.68* | −2.11* | −1.33 |
| 9531 | BAG3 | −1.88* | 1.19* | 1.71* | 1.23 | 1.38 |
| 9530 | BAG4 | −1.11 | −1.51 | −1.27 | −1.38* | −1.24 |
| 580 | BARD1 | 1.37* | 1.43* | 1.34 | 1.08 | 1.35 |
| 8915 | BCL10 | 1.60* | 1.27 | 1.02 | 1.15 | 1.02 |
| 598 | BCL2L1 | −4.28* | −2.94* | −2.86* | −2.56* | −1.46 |
| 10018 | BCL2L11 | −1.24 | −1.85 | −1.65* | −1.65 | −1.42 |
| 79370 | BCL2L14 | 2.57* | 3.74 | 8.47* | 1.86 | −1.23 |
| 599 | BCL2L2 | −1.92* | −1.63* | −1.47* | −1.99* | −1.02 |
| 54880 | BCOR | −1.58 | −1.73 | −1.56* | −1.93* | −1.61 |
| 274 | BIN1 | −1.21 | −1.29* | −1.14 | −1.21 | 1.23 |
| 4671 | BIRC1 | 1.57 | 1.72* | 1.21 | 1.18 | −1.43 |
| 90427 | BMF | −2.65 | −3.24* | −2.41 | −3.33 | −1.82 |
| 665 | BNIP3L | −1.04 | −1.15 | −1.28 | −1.23 | −1.63* |
| 666 | BOK | −1.96* | −1.98* | −1.61 | −1.90* | 1.11 |
| 673 | BRAF | −1.45* | −1.67* | −1.19 | −1.48* | −1.14 |
| 672 | BRCA1 | −1.11 | 1.19* | 1.31 | −1.16 | 1.08 |
| 9577 | BRE | −1.23 | −1.21 | −1.32* | −1.14 | 1.09 |
| 54014 | BRWD1 | −1.63 | −2.07 | −1.98* | −2.09 | −1.54 |
| 694 | BTG1 | 1.78* | 1.01 | −1.17 | −1.27 | −1.93 |
| 695 | BTK | −1.18 | 2.74 | 12.53 | 6.34* | 5.92 |
| 81566 | C12orf22 | 2.13* | 1.87 | 1.29 | 1.76 | 1.04 |
| 114897 | C1QTNF1 | 1.64 | 2.15* | 2.35 | 4.33* | 4.75 |
| 114898 | C1QTNF2 | −2.04* | −2.14* | −1.44* | −1.93* | −1.30* |
| 114900 | C1QTNF4 | −1.08 | 1.11 | −2.03 | 1.24 | 9.70* |
| 114905 | C1QTNF7 | −1.19 | −1.31 | 1.33 | −1.06 | 4.08* |
| 56997 | CABC1 | −1.49* | −1.60 | −1.63 | −1.41 | −1.52 |
| 824 | CAPN2 | −1.05 | −1.39 | −1.39 | −1.62* | −1.31 |
| 29775 | CARD10 | −5.71* | −5.47* | −2.30* | −3.68* | −1.26 |
| 58484 | CARD12 | 5.11* | 1.46 | 4.85* | 19.79* | −1.03 |
| 79092 | CARD14 | 20.55* | 59.49* | 83.31* | 55.19* | 50.25* |
| 64127 | CARD15 | 4.09* | 1.82 | 2.14 | 4.88* | 1.99 |
| 84674 | CARD6 | −3.45* | −3.67* | −3.22* | −3.64* | −2.11 |
| 843 | CASP10 | −1.21 | −1.80 | −1.98* | −1.28 | −1.20 |
| 837 | CASP4 | −1.12 | −1.13 | −1.33* | −1.17 | −1.11 |
| 839 | CASP6 | 3.33* | 3.14* | 2.19* | 3.13* | 1.35 |
| 840 | CASP7 | 1.58 | 1.52* | 1.93* | 1.52* | 1.29 |
| 842 | CASP9 | −1.36* | −1.45* | −1.34* | −1.62* | 1.00 |
| 8535 | CBX4 | 1.77* | 1.54 | 1.36 | 1.59 | 1.33 |
| 55749 | CCAR1 | 1.37* | 1.56* | 1.34* | 1.33 | 1.11 |
| 6347 | CCL2 | −8.54* | −27.25* | −17.58* | −12.81* | −12.28* |
| 952 | CD38 | 1.46 | 1.82 | 4.06* | 8.12* | 10.30 |
| 959 | CD40LG | 1.35 | 5.73 | 1.16 | 1.98 | 11.02* |
| 984 | CDC2L1 | 1.28* | 1.37* | 1.16 | 1.34* | 1.16 |
| 1026 | CDKN1A | 1.03 | 1.47 | 1.35* | 1.59* | 1.25 |
| 114548 | CIAS1 | 2.62 | 8.33* | 14.20* | 6.44* | 5.99* |
| 1149 | CIDEA | 5.86* | 2.96 | 1.66 | 3.96 | 8.28 |
| 63924 | CIDEC | 1.08 | 1.29 | 1.81* | 1.67* | 1.34 |
| 26586 | CKAP2 | 1.09 | −1.03 | 1.45* | −1.19 | 1.11 |
| 23529 | CLCF1 | −4.41* | −4.30* | −3.96* | −5.37* | −1.71 |
| 1196 | CLK2 | −1.02 | 1.44* | 1.40* | 1.41* | 1.39 |
| 23603 | CORO1C | −1.47 | −2.15* | −1.41 | −1.69 | −1.61 |
| 7464 | CORO2A | −1.83* | −2.20* | −1.67* | −1.94* | −1.61 |
| 56259 | CTNNBL1 | 1.05 | 1.33* | 1.30 | 1.37 | 1.36 |
| 8454 | CUL1 | −1.56* | −1.18 | −1.05 | −1.28* | 1.06 |
| 8451 | CUL4A | 1.65* | 1.38* | −1.07 | −1.10 | −1.15 |
| 1603 | DAD1 | 1.22* | 1.19* | 1.14* | 1.18 | −1.08 |
| 1605 | DAG1 | −1.35 | −1.32 | −1.36 | −1.45* | −1.14 |
| 23604 | DAPK2 | 1.96 | 1.85* | 1.75 | 1.51 | 2.29 |
| 1613 | DAPK3 | −2.62* | −1.97* | −1.63 | −1.60 | 1.33 |
| 1616 | DAXX | −1.69* | −1.70* | −1.53* | −1.73* | 1.02 |
| 162989 | DEDD2 | −2.05 | −1.59* | −1.18 | −1.73 | 1.07 |
| 56616 | DIABLO | −1.24* | −1.17 | −1.26 | −1.19 | −1.12 |
| 55929 | DMAP1 | 1.15 | 1.41* | 1.32* | 1.55* | 1.46* |
| 1776 | DNASE1L3 | 7.79* | 31.29* | 28.11* | 25.78* | 8.78* |
| 5977 | DPF2 | −1.25 | −1.54 | −1.53 | −1.87* | −1.17 |
| 29952 | DPP7 | 1.31 | 1.46* | 1.01 | 1.52 | 1.24 |
| 80824 | DUSP16 | −3.52* | −2.38* | −1.86* | −2.29* | −1.32 |
| 56940 | DUSP22 | −1.08 | −1.15 | −1.23* | −1.18 | −1.27 |
| 8655 | DYNLL1 | −1.66* | −1.59* | −1.18* | −1.85* | −1.08 |
| 140735 | DYNLL2 | 1.42* | 1.67* | 1.71* | 1.63* | 1.32 |
| 9166 | EBAG9 | 1.05 | 1.36* | 1.42* | 1.28 | 1.02 |
| 63916 | ELMO2 | 1.18 | 1.46* | 1.74* | 1.35 | 1.72* |
| 55531 | ELMOD1 | 5.20* | 3.95* | 6.43* | 4.41* | 1.36 |
| 255520 | ELMOD2 | 1.57* | 1.36 | 1.31* | 1.29 | −1.32 |
| 2012 | EMP1 | −4.05 | −4.26* | −4.14* | −5.78 | −5.81* |
| 8507 | ENC1 | −2.36* | −3.58* | −6.96* | −2.42* | −3.68* |
| 2021 | ENDOG | 1.65* | 1.53* | 1.29 | 1.40 | 1.74* |
| 2056 | EPO | −1.20 | 1.42 | −1.10 | 2.09 | 24.80* |
| 2081 | ERN1 | 2.84 | 4.79* | 5.01* | 9.08* | 5.58 |
| 2149 | F2R | −2.08* | −2.05* | −2.37 | −1.49 | −3.19 |
| 8772 | FADD | 1.07 | −1.16 | −1.02 | −1.29* | 1.07 |
| 79675 | FASTKD1 | 1.73* | 1.58 | 1.19 | 1.40 | 1.05 |
| 22868 | FASTKD2 | −1.64* | −1.13 | −1.07 | −1.18 | −1.22 |
| 60493 | FASTKD5 | 1.24* | 1.28 | 1.48* | 1.46 | 1.13 |
| 2309 | FOXO3A | 1.85* | 1.99* | 1.60* | 2.01* | 1.28 |
| 64400 | FTS | −1.10 | −1.31* | 1.42* | −1.21 | −1.03 |
| 2549 | GAB1 | 2.65* | 1.76 | 1.63 | 1.61 | −1.32 |
| 1647 | GADD45A | −2.13* | −1.52 | −1.09 | −1.23 | −1.09 |
| 4616 | GADD45B | 1.30 | 1.40 | −1.05 | 1.89* | −1.20 |
| 11010 | GLIPR1 | −1.75 | −1.29 | −1.22 | −1.12 | −1.46* |
| 9340 | GLP2R | −1.73* | −2.57* | −1.51 | −1.92* | −2.23 |
| 2752 | GLUL | −1.04 | 1.88 | 5.67* | 1.24 | 2.14 |
| 8477 | GPR65 | −8.21* | −1.06 | −1.03 | −16.13* | −2.07 |
| 51454 | GULP1 | −1.99 | −1.04 | −1.67* | −1.52 | −2.00* |
| 3001 | GZMA | 28.18* | 22.25* | 9.29* | 11.66* | 3.69 |
| 3093 | HIP2 | −1.37* | −1.37* | −1.37* | −1.59* | −1.15 |
| 3192 | HNRPU | −1.48 | −1.44 | −1.26 | −1.59* | −1.15 |
| 10524 | HTATIP | −2.25* | −1.45 | −1.16 | −1.31 | 1.13 |
| 135458 | HUS1B | 2.35* | 1.41 | 1.38 | 2.10* | −1.13 |
| 8870 | IER3 | −3.93* | −10.03* | −8.18* | −5.28* | −4.94* |
| 2537 | IFI6 | 1.28 | −1.00 | −1.08 | 1.17 | −1.44* |
| 64135 | IFIH1 | 1.91* | 1.25 | −1.35 | 1.27 | −1.03 |
| 55764 | IFT122 | 1.38* | 1.47* | 1.39* | 1.76* | 1.17 |
| 3480 | IGF1R | −2.80* | −2.71* | −1.91* | −2.05* | −1.88 |
| 117283 | IHPK3 | 1.71 | 3.96 | 12.07* | 6.75 | 3.01 |
| 3551 | IKBKB | −1.30* | −1.36 | −1.37* | −1.35* | 1.09 |
| 3600 | IL-15 | −1.59* | −1.93* | −1.52* | −2.18* | −1.91 |
| 3601 | IL15RA | −1.74 | −2.08 | −2.08* | −1.77 | −1.90 |
| 3606 | IL-18 | −2.31 | −2.47* | −2.04* | −1.79 | −2.76* |
| 3553 | IL1B | 1.15 | −5.87* | −4.83 | −4.92 | −1.56 |
| 56300 | IL1F9 | 2.47 | 3.02 | 5.82* | 8.37* | 1.18 |
| 3556 | IL1RAP | 1.05 | −1.64* | −1.67* | −1.70 | −1.62 |
| 11009 | IL-24 | −3.24 | −4.56* | −1.27 | −2.41 | −2.31 |
| 3563 | IL3RA | 7.39 | 2.82 | 4.60* | 2.36 | 1.72 |
| 3575 | IL7R | −3.73* | −2.65* | −2.03 | −1.46 | −3.25* |
| 3621 | ING1 | 2.95* | 2.91* | 2.11* | 1.65* | 1.39 |
| 3622 | ING2 | −1.29 | −1.58* | −1.11 | −1.68* | 1.01 |
| 54556 | ING3 | 1.36 | 1.29 | 1.41* | 1.19 | 1.07 |
| 3624 | INHBA | −5.24* | −4.36* | −2.29* | −2.36* | −2.87 |
| 3659 | IRF1 | −1.37 | −1.96* | −1.47 | −1.53 | −1.15 |
| 3689 | ITGB2 | 13.94 | 6.29* | 15.50* | 20.21* | 1.46 |
| 3727 | JUND | −2.42* | −2.25* | −2.20* | −2.33* | −1.46* |
| 85329 | LGALS12 | 5.06* | 7.51* | 4.59* | 15.62* | −1.08 |
| 3964 | LGALS8 | −1.18 | −1.22* | −1.13 | −1.18 | −1.35* |
| 4050 | LTB | 1.47 | −1.29 | −1.89* | −1.12 | −1.52 |
| 10296 | MAEA | 1.24* | 1.28* | 1.18* | 1.10 | 1.07 |
| 260425 | MAGI3 | −1.28 | −1.35 | −1.40* | −1.42* | −1.40 |
| 4118 | MAL | 7.83* | 1.61 | 6.49* | 4.05 | 2.49 |
| 10892 | MALT1 | −1.83 | −1.65* | −1.32 | −1.70 | −1.66* |
| 9020 | MAP3K14 | −2.63* | −2.48* | −2.17* | −2.76* | −2.04* |
| 6885 | MAP3K7 | 1.69* | 1.66* | 1.34 | 1.43 | −1.03 |
| 891 | MAP4K3 | −1.39* | −1.29 | −1.21 | −1.35 | −1.15 |
| 5594 | MAPK1 | −1.32 | −1.36* | −1.13 | −1.39* | −1.05 |
| 5601 | MAPK9 | −1.49 | −1.96* | −1.46* | −2.08* | −1.48* |
| 4149 | MAX | −1.41* | −1.49* | −1.36* | −1.67* | −1.11 |
| 4170 | MCL1 | −1.74* | −1.73* | −1.45* | −2.27* | −1.14 |
| 4194 | MDM4 | −1.32* | −1.14 | −1.21* | −1.38 | −1.17 |
| 145815 | MGC18216 | −1.81 | −2.71* | −2.07 | −2.24 | −2.60* |
| 64112 | MOAP1 | −1.51 | −1.70 | −1.34* | −1.88* | 1.02 |
| 27136 | MORC1 | 1.29 | 2.37 | 3.00* | 2.59 | −1.86 |
| 4488 | MSX2 | 4.03* | 3.00* | 3.48* | 3.15* | 3.23* |
| 9633 | MTL5 | 1.71* | −1.15 | −1.27 | −1.31 | −1.21 |
| 4615 | MYD88 | 1.62* | 1.15 | −1.21 | 1.12 | 1.03 |
| 338322 | NALP10 | −7.19* | −3.06 | −3.54 | −2.59 | 2.35 |
| 4790 | NFKB1 | −2.24* | −2.06* | −1.52 | −1.50* | −1.27 |
| 4791 | NFKB2 | −1.67 | −1.98* | −1.56 | −1.10 | −1.40 |
| 4792 | NFKBIA | 1.69 | 1.97 | 5.44* | 2.28 | 2.10 |
| 4804 | NGFR | 3.09* | 2.89 | 1.90 | 2.64* | 1.28 |
| 8382 | NME5 | 5.79* | 2.02 | 1.15 | 1.69 | 2.20 |
| 4836 | NMT1 | 1.61* | 1.42* | 1.37* | 1.59* | 1.17 |
| 8996 | NOL3 | 2.32* | 2.79* | 3.19* | 3.10* | 1.61 |
| 9542 | NRG2 | 12.11* | 17.48* | 27.26* | 37.45* | 2.70 |
| 8439 | NSMAF | −1.48* | −1.49* | −1.55* | −1.71* | −1.10 |
| 4908 | NTF3 | 9.21* | 15.28* | 21.25* | 27.51* | 10.31* |
| 4914 | NTRK1 | −1.14 | −1.85 | 1.12 | 1.13 | 3.00* |
| 4973 | OLR1 | −1.06 | −5.94* | −2.06 | −2.60 | −6.60 |
| 51237 | PACAP | −1.46 | 4.49 | 1.28 | −1.41 | 13.10* |
| 5058 | PAK1 | −1.21 | −1.32 | −1.33 | −1.49* | 1.01 |
| 5062 | PAK2 | −1.41* | −1.27* | −1.45* | −1.50* | −1.20 |
| 56924 | PAK6 | 3.28* | 1.83 | 2.14 | 2.71 | 2.23 |
| 143 | PARP4 | 1.63* | 1.83* | 1.53 | 1.89* | 1.54 |
| 5074 | PAWR | −2.48* | −2.46* | −2.80* | −1.45 | −2.44* |
| 5077 | PAX3 | −1.03 | 1.90 | −1.06 | −1.04 | 11.51* |
| 10135 | PBEF1 | −2.02* | −1.45* | −1.02 | −1.54* | 1.03 |
| 80380 | PDCD1LG2 | −1.45 | −3.98 | −4.19* | −2.92 | −1.60 |
| 27250 | PDCD4 | −1.58* | −1.86* | −1.70 | −1.91* | −2.03* |
| 10081 | PDCD7 | 1.21 | 1.34* | 1.16 | 1.08 | 1.25* |
| 79031 | PDCL3 | −1.14 | −1.14 | −1.01 | −1.43* | −1.02 |
| 8682 | PEA15 | −1.74* | −1.78* | −1.73* | −1.77* | −1.47 |
| 79960 | PHF17 | −2.54 | −2.36* | −1.58 | −2.63* | −1.11 |
| 7262 | PHLDA2 | 1.62* | −1.10 | −1.13 | −1.35 | −1.14 |
| 5291 | PIK3CB | −1.97* | −1.92* | −1.51 | −2.45* | 1.08 |
| 5293 | PIK3CD | 1.42 | 1.22 | 1.52* | 1.12 | 1.64* |
| 5295 | PIK3R1 | 1.11 | 1.60 | 1.76* | 1.48 | 1.22 |
| 8503 | PIK3R3 | 1.98* | 1.97 | −1.19 | 1.65 | 1.07 |
| 5325 | PLAGL1 | 2.00* | 1.38 | −1.04 | 1.30 | −1.31 |
| 79156 | PLEKHF1 | −1.30 | −1.08 | 1.38 | 1.02 | 1.27* |
| 57645 | POGK | −2.06* | −1.87* | −1.31 | −2.03* | −1.19 |
| 10848 | PPP1R13L | −2.18* | −2.32* | −1.97* | −1.80* | −1.73* |
| 23645 | PPP1R15A | −1.53 | −1.42 | −1.43* | −1.34 | 1.08 |
| 5515 | PPP2CA | −1.36* | −1.70* | −1.18 | −1.52* | −1.18 |
| 5519 | PPP2R1B | −1.51* | −1.43 | −1.24 | −1.27 | −1.29 |
| 5530 | PPP3CA | −1.38 | −1.59* | −1.68* | −1.77* | −2.10* |
| 5533 | PPP3CC | 4.49* | 3.39* | 3.17* | 4.71* | 1.77 |
| 5534 | PPP3R1 | −1.88 | −1.99* | −1.52* | −2.25* | −1.40 |
| 5552 | PRG1 | −1.07 | 1.34 | 2.35* | 2.15* | 1.22 |
| 5567 | PRKACB | 1.16 | −1.61* | −1.40* | −1.69* | −1.84 |
| 5573 | PRKAR1A | −1.18* | −1.54* | −1.32* | −1.51* | −1.37* |
| 5575 | PRKAR1B | 2.25* | 2.93* | 2.30* | 1.35 | 2.57* |
| 5579 | PRKCB1 | 6.97* | 4.64* | 12.54* | 14.91* | 1.99 |
| 5580 | PRKCD | 2.35* | 1.99* | 1.29* | 1.64 | −1.03 |
| 5581 | PRKCE | −1.05 | 1.75* | 1.68* | −1.23 | −1.24 |
| 5584 | PRKCI | 1.12* | 1.01 | −1.08 | 1.07 | −1.47* |
| 5618 | PRLR | 2.09 | 2.08 | 1.69 | 7.73* | 1.03 |
| 5663 | PSEN1 | −1.15 | −1.38 | −1.51* | −1.43 | −1.41* |
| 23210 | PTDSR | −2.09* | −1.23 | 1.05 | −1.51 | 1.68* |
| 2185 | PTK2B | 2.20* | 2.38* | 2.34* | 2.22* | 2.63 |
| 51651 | PTRH2 | −1.31 | −1.83* | −1.51* | −1.69* | −1.67* |
| 5885 | RAD21 | −1.52* | −1.32 | −1.15 | −1.44* | −1.31 |
| 84173 | RBED1 | 1.64* | 1.55* | 1.28 | 1.23 | 1.32 |
| 5939 | RBMS2 | −1.52 | −1.97* | −1.69* | −1.63* | −1.96* |
| 27303 | RBMS3 | 1.54 | 1.56 | 1.96* | 1.87 | 1.42 |
| 5970 | RELA | −1.60* | −1.62* | −1.50* | −1.49* | −1.09 |
| 473 | RERE | 2.53* | 2.22* | 2.55* | 2.82* | 1.31 |
| 388 | RHOB | 1.40 | 1.57 | 2.23* | 1.78 | 1.86 |
| 8737 | RIPK1 | 2.55* | 2.06* | 1.55 | 2.32* | 1.24 |
| 8767 | RIPK2 | −1.70* | −2.19* | −2.23* | −2.23* | −1.31 |
| 152006 | RNF38 | −1.24* | −1.31 | −1.27* | −1.62* | −1.51 |
| 6093 | ROCK1 | −1.28* | −1.09 | −1.29* | −1.40* | −1.22 |
| 64121 | RRAGC | 1.68* | 1.51* | 1.47* | 1.51* | 1.25* |
| 57142 | RTN4 | −1.95 | −1.77* | −1.78* | −1.53 | −1.97 |
| 29115 | SAP30BP | 1.11 | 1.15 | 1.34 | 1.17 | 1.50* |
| 949 | SCARB1 | −1.39 | −1.43* | −1.28* | −1.38 | −1.47 |
| 6446 | SGK | 3.83* | 8.86* | 11.78* | 7.14* | 5.52* |
| 8879 | SGPL1 | −1.28 | −1.24* | −1.20 | −1.38* | −1.36 |
| 81537 | SGPP1 | 2.00* | 1.09 | 1.22 | 1.11 | −1.48 |
| 51100 | SH3GLB1 | −1.15 | −1.08 | −1.08 | −1.33* | −1.14 |
| 30011 | SH3KBP1 | −1.25 | −1.43 | −1.53* | −1.39 | −1.40* |
| 6477 | SIAH1 | −1.72* | −2.26* | −1.43 | −2.73* | −1.16 |
| 6478 | SIAH2 | −1.89* | −1.36 | −1.09 | −1.60* | 1.47 |
| 4086 | SMAD1 | −1.67* | −1.91* | −1.59* | −2.57* | −1.72 |
| 6622 | SNCA | −1.22 | −1.89 | −1.69 | −1.69 | −1.61* |
| 6651 | SON | −1.92 | −1.64* | −1.48 | −2.18 | −1.31 |
| 6659 | SOX4 | −1.68 | −2.05 | −2.62* | −2.48 | −1.94 |
| 56928 | SPPL2B | 1.58 | 1.59* | 1.26* | 1.71* | 1.24 |
| 6774 | STAT3 | 1.26* | 1.10 | 1.25 | 1.28 | 1.03 |
| 6776 | STAT5A | 3.40* | 5.84* | 2.30* | 3.54* | 1.48* |
| 6778 | STAT6 | −1.43 | −1.53* | −1.53 | −1.22 | −1.59 |
| 9262 | STK17B | 1.41* | −1.05 | 1.31 | −1.24 | −1.23 |
| 6613 | SUMO2 | −1.27* | −1.57* | −1.32* | −1.63* | −1.29* |
| 10474 | TADA3L | −1.08 | −1.23* | −1.12 | −1.40 | −1.02 |
| 55145 | THAP1 | −1.14 | −1.54* | −1.26 | −1.40 | −1.40 |
| 7078 | TIMP3 | 3.07* | 1.31 | −1.71 | 1.23 | −1.87 |
| 7096 | TLR1 | −2.32* | −3.13 | −1.88 | −2.65 | −2.23 |
| 7100 | TLR5 | 9.41* | 3.91* | 1.55 | 1.64 | 15.93 |
| 83877 | TM2D2 | −1.87 | −1.56 | −1.29 | −1.99* | −1.39 |
| 80213 | TM2D3 | 1.50 | 1.46* | 1.36* | 1.29 | 1.03 |
| 7126 | TNFAIP1 | −3.04* | −3.00* | −2.22* | −3.62* | −1.71* |
| 7127 | TNFAIP2 | −1.36 | −2.79* | −3.57* | −2.19 | −2.28* |
| 7128 | TNFAIP3 | −1.87 | −1.17 | 1.53* | −1.04 | 1.67 |
| 7130 | TNFAIP6 | −1.26 | −5.24 | −5.37* | −2.48 | −2.42 |
| 25816 | TNFAIP8 | 1.69* | 1.28 | 1.44 | −1.02 | −1.16 |
| 8797 | TNFRSF10A | −1.58 | 5.65 | 1.83 | 3.42 | 16.84* |
| 8795 | TNFRSF10B | 2.03* | 2.42* | 2.32* | 2.53* | 1.32 |
| 4982 | TNFRSF11B | −1.83* | −3.20* | −6.10* | −2.97* | −4.51* |
| 51330 | TNFRSF12A | −5.75* | −3.80* | −2.99* | −3.62* | −2.00* |
| 84957 | TNFRSF19L | 4.19* | 3.83* | 2.89* | 3.80* | 1.52 |
| 7132 | TNFRSF1A | 1.02 | −1.01 | −1.14 | −1.35* | 1.15 |
| 7133 | TNFRSF1B | 11.94* | 8.06* | 17.13* | 9.73* | 6.81* |
| 27242 | TNFRSF21 | −1.22 | −1.82* | −1.39* | −1.86* | −1.85 |
| 8718 | TNFRSF25 | −1.90* | −1.53 | −1.50* | −1.81 | −1.37 |
| 943 | TNFRSF8 | −2.96 | −2.83* | −1.33 | −1.12 | −1.83 |
| 8600 | TNFSF11 | 1.48 | 7.84 | 1.14 | 1.33 | 13.51* |
| 8740 | TNFSF14 | 1.44 | 7.54* | 1.02 | 6.66* | 7.59 |
| 7292 | TNFSF4 | 5.62* | 5.42* | 3.73 | 7.57* | 1.68 |
| 56984 | TNFSF5IP1 | −1.44* | −1.40* | −1.31* | −1.55* | −1.21 |
| 970 | TNFSF7 | −2.01* | −1.97 | −2.33* | −1.17 | −3.18* |
| 8744 | TNFSF9 | −1.20 | −1.30 | −2.85* | −1.22 | −1.35 |
| 7159 | TP53BP2 | 1.35 | 1.57 | 2.09* | 1.39 | 2.64* |
| 9540 | TP53I3 | 2.91* | 5.57* | 4.43* | 5.71* | 1.77* |
| 7185 | TRAF1 | −2.43* | −5.25* | −1.55 | −1.47 | −2.13 |
| 7187 | TRAF3 | −2.33* | −2.28* | −1.78* | −2.66* | −1.54 |
| 10758 | TRAF3IP2 | 2.40* | 2.00* | 3.08* | 2.80* | 2.24 |
| 9618 | TRAF4 | −3.47* | −3.89* | −2.64* | −3.17* | −1.00 |
| 7188 | TRAF5 | 3.29 | 3.26* | 2.30* | 1.69 | 1.17 |
| 57761 | TRIB3 | −3.53* | −3.43* | −2.14* | −2.81* | −1.19 |
| 80263 | TRIM45 | 1.91* | 2.03* | 1.65* | 1.47* | 1.39 |
| 10497 | UNC13B | 1.13 | 1.41* | 1.58* | 2.23* | 1.47 |
| 55759 | WDR12 | −1.63 | −1.51* | −1.24 | −1.51 | −1.44* |
| 80232 | WDR26 | −1.20 | −1.41* | −1.36 | −1.57* | −1.50 |
| 10885 | WDR3 | −1.49* | −1.64* | −1.50* | −1.62* | −1.54* |
| 114987 | WDR31 | 1.33 | 1.71 | 1.58 | 1.43 | 1.74* |
| 22884 | WDR37 | 2.56* | 2.65* | 1.70* | 2.23* | 1.35 |
| 139170 | WDR40B | 1.61* | 1.97* | 3.06* | 2.25* | 1.36 |
| 11180 | WDR6 | −1.75* | −1.44* | −1.37 | −1.59 | −1.14 |
| 7532 | YWHAG | −1.79* | −1.72* | −1.54* | −1.85* | −1.21 |
| 7533 | YWHAH | −1.55* | −1.99* | −1.42 | −2.20* | −1.15 |
| 7534 | YWHAZ | −1.35* | −1.56* | −1.38* | −1.57* | −1.35* |
| 51776 | ZAK | −2.11* | −2.18* | −1.55* | −2.29* | −2.03* |
| 23567 | ZNF346 | −1.12 | −1.13 | −1.09 | −1.31* | 1.05 |
This list was generated by gene ontology cell death and regulated by at least one GR isoform (*, P < 0.0001). There are 301 genes in the list, 25 of which are regulated by all GR isoforms (highlighted in boldface type).
To further examine the differential gene-regulatory actions of GR isoforms, we performed real-time PCR analysis and revealed additional selectivity in the regulation of apoptotic genes by GR isoforms (Fig. 6A). It was found that both GZMA and CASP6 were induced in a GR isoform-selective manner. The GR-C isoform was more efficacious and the GR-D isoform was less active than the other GR isoforms. To verify whether GZMA and CASP6 play essential roles in mediating the selective apoptotic actions of GR isoforms in our experiments, we stably expressed siRNAs against GZMA and CASP6 in cells expressing the GR-C isoform. Each specific siRNA significantly reduced the expression of the respective gene and blunted the apoptosis-inducing effects of glucocorticoids (Fig. 6B). Only partial inhibition of apoptosis was observed using these siRNAs. This is consistent with the observation from the microarray analysis that multiple additional molecules were indicated as candidate genes that mediate the selective apoptosis-inducing actions of the GR isoforms. These additional molecules may include mediators of other apoptotic pathways such as DNase and other proapoptotic candidate genes as well as antiapoptotic genes (Table 1).
FIG. 6.

GR isoforms differentially regulated apoptotic genes. (A) Real-time PCR verification of selective regulation of apoptotic genes by GR isoforms. GZMA and CASP6 are proteases and apoptotic executor enzymes. One-way ANOVA was performed to compare values from DEX-treated cells expressing different GR isoforms, which was followed by Tukey post hoc analysis. *, significantly higher than that of GRα (P < 0.05); **, significantly lower than that of GRα (P < 0.05). (B) Cells stably expressing siRNAs against GZMA or CASP6 significantly blocked DEX-induced death as indicated by PI labeling in cells expressing the GR-C isoform. Results using two separate species of siRNAs with distinct targets (#1 and #2) are shown. One-way ANOVA was performed to compare values from DEX-treated cells expressing different siRNAs, which was followed by Tukey post hoc analysis. *, significantly lower than that of the controls (Con) (P < 0.05).
Selective recruitment of cofactors by GR isoforms.
To define the molecular mechanisms underlying the selective transcriptional regulation of apoptotic genes in cells expressing different GR isoforms, we sought to further analyze the capability of GR isoforms to bind DNA and to recruit cofactors. ChIP assays using GR-selective antibodies were performed to determine the DNA binding ability of each GR isoform. GR isoforms, when activated by DEX, were found to have similar binding capacities on different glucocorticoid response elements including those from ATP4A, VDR, I-κBα, CASP6, and GZMA (Fig. 7A). This observation is consistent with the fact that all the GR isoforms have identical DNA binding domains. Interestingly, in the absence of DEX, the GR-D isoform, but not any of the other GR isoforms, was found to bind to certain promoters. The mechanism for ligand-independent DNA binding by this GR isoform is not known, and it may be related to its unique nuclear localization pattern (18). The GR-D isoform is in the nucleus regardless of ligand activation; all the other GR isoforms reside in the cytoplasm in the absence of ligand and translocate to the nucleus upon ligand exposure. Additional ChIP assays were also performed using selective antibodies against cyclic AMP response element binding (CREB) binding protein (CBP) and p300, both of which are GR coregulators with histone acetylase activity (Fig. 7B). Significantly higher amounts of CBP and p300 were recruited to the GZMA promoter region by the GR-C isoform, whereas a significantly lower amount of each was recruited by the GR-D isoform than by the other GR isoforms. A similar relationship was found for acetylated histone H4 and phosphorylated RNA polymerase II on the same segment of the GZMA promoter (Fig. 7B). In contrast, the amount of GR protein recruited to the same GZMA promoter region was the same for different GR isoforms, as shown in Fig. 7A. Together, these data indicate that different GR isoforms have different abilities to recruit cofactors, to modify chromatin, and to recruit active RNA polymerase. Quantitative analysis using real-time reverse transcription-PCR confirming the preferential recruitment of cofactors by the GR-C isoform is shown in Fig. 7B. The preferential recruitment of cofactors by the GR-C isoform is gene specific, since coregulator recruitment by GR isoforms onto the promoter region of another gene, I-κBα, was similar among GR isoforms (data not shown).
FIG. 7.

GR isoforms differentially recruit cofactors onto the GZMA promoter region (27). (A) GR isoforms, when activated by DEX, bind to several glucocorticoid response elements (GRE) equally as determined by ChIP analysis using anti-GR 57 antibody. This is true for the GZMA promoter as well. The bar graph shows the quantification of GR binding of the GZMA promoter region using real-time PCR. (B) GR-C isoforms selectively recruited cofactors, induced histone H4 acetylation, and utilized different amounts of RNA polymerase II (Pol II) as indicated by the arrow and determined by ChIP analysis using antibodies against respective cofactors, modified histones, and RNA polymerase. DNA obtained from ChIP assays was subjected to real-time PCR analysis and normalized to input. The bar graphs represent results from five to six experiments. One-way ANOVA was performed to compare values from DEX-treated cells expressing different GR isoforms, which was followed by Tukey post hoc analysis. *, significantly higher than that of GRα (P < 0.05); **, significantly lower than that of GRα (P < 0.05).
Cellular composition of GR isoforms determines glucocorticoid sensitivity.
The GR isoforms are expressed in almost all cell types, and importantly, their relative levels vary considerably among tissues (Fig. 8). In spleen, the amount of the GR-D isoforms was similar to those of the GR-A, -B, and -C isoforms, whereas in bone (primary osteoblasts), the amounts of GR-D isoforms were negligible compared to those of the other GR isoforms. To further determine the glucocorticoid responsiveness mediated by different combinations of GR isoforms, additional stable U-2 OS cell lines were established (Fig. 9). These cell lines expressed two GR isoforms simultaneously: they all contained a constant amount of the GR-A isoform and an additional GR isoform that can be regulated by doxycycline. The constant level of the GR-A isoform in these cells induced approximately 20 to 30% cell death by 48 h of DEX (100 nM) treatment. An increase in the amount of GR-A induced an additional 10% of cell death; increasing the amount of the GR-C isoform induced an additional 19% of cell death, whereas in contrast, increasing the amount of the GR-D isoform did not induce additional cell death (Fig. 9). Thus, the combination of the GR-A and the GR-C isoforms in U-2 OS cells was more efficacious than the combination of the GR-A and the GR-D isoforms in cell killing. These experiments support the notion that different cellular compositions of GR isoforms may influence the glucocorticoid response.
FIG. 8.
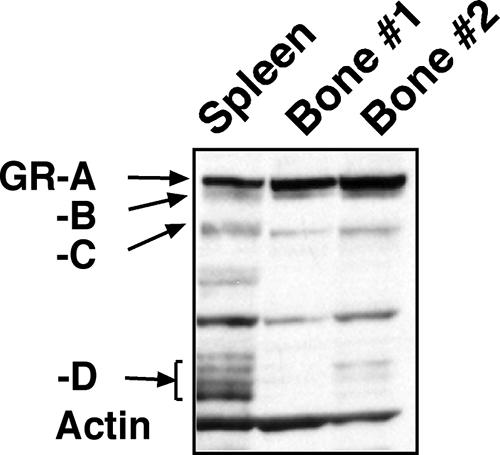
Comparison of the levels of GR isoforms in spleen and bone. All GR isoforms were found in mouse spleen and bone. The expression of the GR-D isoforms was much higher in spleen than that in bone, whereas the expression levels of the other GR isoforms were comparable between spleen and bone. Additional bands in between the GR-C and GR-D isoforms may be nonspecific signals, and they were not consistently detected.
FIG. 9.

Combination of GR isoforms. (A) Three U-2 OS cell lines were generated, where the level of the GR-A isoform is constant and the level of the second GR isoform can be regulated by addition of doxycycline. (B) The constitutively expressed GR-A isoform is responsible for 20 to 30% of cell death (0.3 ng/ml doxycycline). Increases in the amount of the GR-A (control) or the GR-C isoform induced additional cell death as measured by PI staining, whereas increases in the amount of the GR-D isoform did not.
The GR-D isoform has transrepression activity equal to those of other GR isoforms.
Although it did not kill U-2 OS cells as effectively as the other GR isoforms, the GR-D isoforms repressed the NF-κB reporter gene approximately 50% (Fig. 10A), equivalent to the degree of NF-κB repression obtained by the other GR isoforms (Fig. 10A). As an index of NF-κB activity, we determined the level of proinflammatory cytokines induced by LPS in the absence and presence of DEX in U-2 OS cells (Fig. 10B). TNF, interleukin-8 (IL-8), and granulocyte-monocyte colony-stimulating factors are all significantly induced by LPS in cells expressing different GR isoforms. Upon the addition of DEX, these LPS-induced genes were suppressed down to the baseline level by each of the GR isoforms, including the GR-D isoform. In summary, the GR-D isoform inhibits NF-κB activity without stimulating apoptosis in bone cells.
FIG. 10.

Transrepression activity of GR isoforms. (A) All GR isoforms dose-dependently downregulated NF-κB reporter gene expression. (B) All GR isoforms inhibited LPS-induced expression of TNF, IL-8, and granulocyte-monocyte colony-stimulating factor (GMCSF) in U-2 OS cells. One-way ANOVA was performed to compare values from different treatments, which was followed by Tukey post hoc analysis. y-axis values are percentages. *, significantly different from that of LPS treatment (P < 0.05).
DISCUSSION
Apoptosis of osteoblastic cells and osteocytes has been proposed to be a possible cause for glucocorticoid-induced osteoporosis (32). U-2 OS osteosarcoma cells activate an apoptotic program following DEX treatment only when GR is present. Therefore, GR is required and sufficient for glucocorticoid killing of these bone cells. These findings are in contrast to the hypothesis that glucocorticoids act on other organ systems and indirectly kill osteoblasts. Glucocorticoid-induced apoptosis in lymphoid cells has been extensively characterized into an initiation stage, which involves GR activation and transcriptional regulation; a decision stage, which triggers apoptotic factors at the mitochondrial level; and an execution stage, which activates proapoptotic caspases and endonucleases (8). In agreement with data in the literature, there is a delayed onset of cell death in our model system, suggesting that the proapoptotic action of glucocorticoids requires GR-mediated transcription (22, 29, 35). Several genes, including GZMA and CASP6, have been suggested to participate in glucocorticoid-induced killing of osteoblasts, chondrocytes, and lymphocytes (4, 28, 30, 35). Using siRNA technology, we clearly show that these execution-stage molecules are critical in glucocorticoid-induced bone cell apoptosis. In addition, our results indicate that other molecules upstream of the apoptosis signaling pathway, such as TNF receptors, may also mediate glucocorticoid-induced apoptosis. Other authors reported previously that cell survival factors such as insulin-like growth factor, IL-6, integrins, and matrix metalloproteinases can be suppressed by glucocorticoids (34), and conversely, proapoptotic factors such as caspases may be increased by glucocorticoids (5, 13). Indeed, Rogatsky et al. reported previously that the downregulation of the antiapoptotic Bcl-2 gene may contribute to the cell-killing effects of glucocorticoids in U-2 OS cells (24). Consistent with their findings, we also observed the downregulation of several Bcl-2-related antiapoptotic molecules, such as Bcl-xL (Bcl2L1) and MCL1, in cells undergoing apoptosis (Table 1). Thus, similar to glucocorticoid-induced apoptosis in lymphocytes, glucocorticoid-induced apoptosis in bone cells likely involves gene products that are crucial for multiple phases of the programmed cell death process. The GR-mediated apoptosis reported here may complement the GR-mediated cell cycle arrest reported previously for osteoporosis (25). It will be interesting to determine whether GR isoforms selectively kill other cell types such as lymphocytes.
GR is a transcription factor that impacts the genome on a large scale. Microarray analysis in particular revealed that each GR isoform had a distinct set of target genes. Collectively, the number gene targets of GR isoforms was over 6,000. Whole human genome surveys and unique contributions from individual GR isoforms result in such a large number compared to those obtained by microarray analyses performed previously by other groups (15, 26). Our results are consistent with the widespread physiological functions of glucocorticoids that span from metabolism, immunity, growth, and differentiation. The unique gene targets of GR isoforms may be a basis for the accurate timing and fine-tuning of each of the physiologic processes governed by glucocorticoids.
Our experiments also provide important evidence that translationally generated GR isoforms have distinct functions. The GR isoforms displayed distinct apoptosis-inducing activities, consistent with the observation that GR isoforms selectively regulated genes involved in apoptosis. The GR-C isoform was significantly more active in doing so than any other GR isoform, and the ability of the GR-D isoform to regulate these apoptosis-related genes was significantly reduced. The enhanced activity of the GR-C isoform was evident by the earlier onset of cell death and by the higher percentage of cell death in the GR-C isoform-expressing cells than in the cells expressing other GR isoforms. We also demonstrated that selective cofactor recruitment was likely the mechanism underlying the functional differences among GR isoforms. GR isoforms differ structurally at the length of the N-terminal domain. The N-terminal domain contains the main transactivation activity of the receptor and the residues pivotal in ligand-dependent coregulator recruitment (16). Consistent with those reports, we found that GR proteins recruited coregulators to the promoter region of the GZMA gene in an isoform-specific manner. It will be interesting to determine whether the N-terminal domains of GR isoforms have different molecular structures presenting different coregulator-interacting surfaces. While this notion is still speculative, recent evidence supports the hypothesis that after ligand and DNA binding, the GR N-terminal domain folds into an organized structure that promotes both intra- and intermolecular interactions and cofactor recruitment (14).
Patients taking glucocorticoids frequently encounter serious side effects. Osteoporosis, for instance, is one of the side effects that can be life-threatening (22). Therefore, much research has focused on developing new approaches to reduce the untoward effects of glucocorticoids, although few of these approaches have been successful. We showed that the GR-D isoform reduced U-2 OS cell-killing capability and that it maintained the NF-κB-repressing activity. These data may provide a basis for the development of improved glucocorticoid regimens with reduced bone cell-killing side effects if the GR-D isoform maintains anti-inflammatory actions of glucocorticoids, such as inhibiting NF-κB activity in immune cells. Further studies are needed to determine whether the GR-D isoform maintains the anti-inflammatory benefits of glucocorticoids and alleviates osteoporosis.
Acknowledgments
We thank Carl D. Bortner and Maria Sifre for assistance with flow cytometric analysis and Christine M. Jewell and Alyson B. Scoltock for technical assistance.
This research was supported by the Intramural Research Program of the NIH National Institute of Environmental Health Sciences and a divisional fund from the Division of Allergy-Immunology, Department of Medicine, Northwestern University.
Footnotes
Published ahead of print on 6 August 2007.
REFERENCES
- 1.Albiston, A. L., V. R. Obeyesekere, R. E. Smith, and Z. S. Krozowski. 1994. Cloning and tissue distribution of the human 11 beta-hydroxysteroid dehydrogenase type 2 enzyme. Mol. Cell. Endocrinol. 105:R11-R17. [DOI] [PubMed] [Google Scholar]
- 2.Ashburner, M., C. A. Ball, J. A. Blake, D. Botstein, H. Butler, J. M. Cherry, A. P. Davis, K. Dolinski, S. S. Dwight, J. T. Eppig, M. A. Harris, D. P. Hill, L. Issel-Tarver, A. Kasarskis, S. Lewis, J. C. Matese, J. E. Richardson, M. Ringwald, G. M. Rubin, and G. Sherlock. 2000. Gene ontology: tool for the unification of biology. Nat. Genet. 25:25-29. [DOI] [PMC free article] [PubMed] [Google Scholar]
- 3.Bronnegard, M. 1996. Steroid receptor number. Individual variation and downregulation by treatment. Am. J. Respir. Crit. Care Med. 154:S28-S32, S32-S33. [DOI] [PubMed] [Google Scholar]
- 4.Chrysis, D., F. Zaman, A. S. Chagin, M. Takigawa, and L. Savendahl. 2005. Dexamethasone induces apoptosis in proliferative chondrocytes through activation of caspases and suppression of the Akt-phosphatidylinositol 3′-kinase signaling pathway. Endocrinology 146:1391-1397. [DOI] [PubMed] [Google Scholar]
- 5.Chua, C. C., B. H. Chua, Z. Chen, C. Landy, and R. C. Hamdy. 2003. Dexamethasone induces caspase activation in murine osteoblastic MC3T3-E1 cells. Biochim. Biophys. Acta 1642:79-85. [DOI] [PubMed] [Google Scholar]
- 6.Cidlowski, J. A., D. L. Bellingham, F. E. Powell-Oliver, D. B. Lubahn, and M. Sar. 1990. Novel antipeptide antibodies to the human glucocorticoid receptor: recognition of multiple receptor forms in vitro and distinct localization of cytoplasmic and nuclear receptors. Mol. Endocrinol. 4:1427-1437. [DOI] [PubMed] [Google Scholar]
- 7.Edgar, R., M. Domrachev, and A. E. Lash. 2002. Gene Expression Omnibus: NCBI gene expression and hybridization array data repository. Nucleic Acids Res. 30:207-210. [DOI] [PMC free article] [PubMed] [Google Scholar]
- 8.Frankfurt, O., and S. T. Rosen. 2004. Mechanisms of glucocorticoid-induced apoptosis in hematologic malignancies: updates. Curr. Opin. Oncol. 16:553-563. [DOI] [PubMed] [Google Scholar]
- 9.Funder, J. W., P. T. Pearce, R. Smith, and A. I. Smith. 1988. Mineralocorticoid action: target tissue specificity is enzyme, not receptor, mediated. Science 242:583-585. [DOI] [PubMed] [Google Scholar]
- 10.Kino, T., M. U. De Martino, E. Charmandari, M. Mirani, and G. P. Chrousos. 2003. Tissue glucocorticoid resistance/hypersensitivity syndromes. J. Steroid Biochem. Mol. Biol. 85:457-467. [DOI] [PubMed] [Google Scholar]
- 11.Knutti, D., A. Kaul, and A. Kralli. 2000. A tissue-specific coactivator of steroid receptors, identified in a functional genetic screen. Mol. Cell. Biol. 20:2411-2422. [DOI] [PMC free article] [PubMed] [Google Scholar]
- 12.Ko, L., G. R. Cardona, A. Henrion-Caude, and W. W. Chin. 2002. Identification and characterization of a tissue-specific coactivator, GT198, that interacts with the DNA-binding domains of nuclear receptors. Mol. Cell. Biol. 22:357-369. [DOI] [PMC free article] [PubMed] [Google Scholar]
- 13.Kogianni, G., V. Mann, F. Ebetino, M. Nuttall, P. Nijweide, H. Simpson, and B. Noble. 2004. Fas/CD95 is associated with glucocorticoid-induced osteocyte apoptosis. Life Sci. 75:2879-2895. [DOI] [PubMed] [Google Scholar]
- 14.Kumar, R., D. E. Volk, J. Li, J. C. Lee, D. G. Gorenstein, and E. B. Thompson. 2004. TATA box binding protein induces structure in the recombinant glucocorticoid receptor AF1 domain. Proc. Natl. Acad. Sci. USA 101:16425-16430. [DOI] [PMC free article] [PubMed] [Google Scholar]
- 15.Leclerc, N., C. A. Luppen, V. V. Ho, S. Nagpal, J. G. Hacia, E. Smith, and B. Frenkel. 2004. Gene expression profiling of glucocorticoid-inhibited osteoblasts. J. Mol. Endocrinol. 33:175-193. [DOI] [PubMed] [Google Scholar]
- 16.Lonard, D. M., and B. W. O'Malley. 2005. Expanding functional diversity of the coactivators. Trends Biochem. Sci. 30:126-132. [DOI] [PubMed] [Google Scholar]
- 17.Lu, N. Z., and J. A. Cidlowski. 2006. Glucocorticoid receptor isoforms generate transcription specificity. Trends Cell Biol. 16:301-307. [DOI] [PubMed] [Google Scholar]
- 18.Lu, N. Z., and J. A. Cidlowski. 2005. Translational regulatory mechanisms generate N-terminal glucocorticoid receptor isoforms with unique transcriptional target genes. Mol. Cell 18:331-342. [DOI] [PubMed] [Google Scholar]
- 19.Necela, B. M., and J. A. Cidlowski. 2004. A single amino acid change in the first zinc finger of the DNA binding domain of the glucocorticoid receptor regulates differential promoter selectivity. J. Biol. Chem. 279:39279-39288. [DOI] [PubMed] [Google Scholar]
- 20.Necela, B. M., and J. A. Cidlowski. 2003. Development of a flow cytometric assay to study glucocorticoid receptor-mediated gene activation in living cells. Steroids 68:341-350. [DOI] [PubMed] [Google Scholar]
- 21.O'Brien, C. A., D. Jia, L. I. Plotkin, T. Bellido, C. C. Powers, S. A. Stewart, S. C. Manolagas, and R. S. Weinstein. 2004. Glucocorticoids act directly on osteoblasts and osteocytes to induce their apoptosis and reduce bone formation and strength. Endocrinology 145:1835-1841. [DOI] [PubMed] [Google Scholar]
- 22.Patschan, D., K. Loddenkemper, and F. Buttgereit. 2001. Molecular mechanisms of glucocorticoid-induced osteoporosis. Bone 29:498-505. [DOI] [PubMed] [Google Scholar]
- 23.Rhen, T., and J. A. Cidlowski. 2005. Antiinflammatory action of glucocorticoids—new mechanisms for old drugs. N. Engl. J. Med. 353:1711-1723. [DOI] [PubMed] [Google Scholar]
- 24.Rogatsky, I., A. B. Hittelman, D. Pearce, and M. J. Garabedian. 1999. Distinct glucocorticoid receptor transcriptional regulatory surfaces mediate the cytotoxic and cytostatic effects of glucocorticoids. Mol. Cell. Biol. 19:5036-5049. [DOI] [PMC free article] [PubMed] [Google Scholar]
- 25.Rogatsky, I., J. M. Trowbridge, and M. J. Garabedian. 1997. Glucocorticoid receptor-mediated cell cycle arrest is achieved through distinct cell-specific transcriptional regulatory mechanisms. Mol. Cell. Biol. 17:3181-3193. [DOI] [PMC free article] [PubMed] [Google Scholar]
- 26.Rogatsky, I., J. C. Wang, M. K. Derynck, D. F. Nonaka, D. B. Khodabakhsh, C. M. Haqq, B. D. Darimont, M. J. Garabedian, and K. R. Yamamoto. 2003. Target-specific utilization of transcriptional regulatory surfaces by the glucocorticoid receptor. Proc. Natl. Acad. Sci. USA 100:13845-13850. [DOI] [PMC free article] [PubMed] [Google Scholar]
- 27.Scheinman, R. I., A. Gualberto, C. M. Jewell, J. A. Cidlowski, and A. S. Baldwin, Jr.1995. Characterization of mechanisms involved in transrepression of NF-κB by activated glucocorticoid receptors. Mol. Cell. Biol. 15:943-953. [DOI] [PMC free article] [PubMed] [Google Scholar]
- 28.Tsujimoto, K., T. Ono, M. Sato, T. Nishida, T. Oguma, and T. Tadakuma. 2005. Regulation of the expression of caspase-9 by the transcription factor activator protein-4 in glucocorticoid-induced apoptosis. J. Biol. Chem. 280:27638-27644. [DOI] [PubMed] [Google Scholar]
- 29.Tuckermann, J. P., A. Kleiman, K. G. McPherson, and H. M. Reichardt. 2005. Molecular mechanisms of glucocorticoids in the control of inflammation and lymphocyte apoptosis. Crit. Rev. Clin. Lab. Sci. 42:71-104. [DOI] [PubMed] [Google Scholar]
- 30.U, M., L. Shen, T. Oshida, J. Miyauchi, M. Yamada, and T. Miyashita. 2004. Identification of novel direct transcriptional targets of glucocorticoid receptor. Leukemia 18:1850-1856. [DOI] [PubMed] [Google Scholar]
- 31.Wallace, A. D., and J. A. Cidlowski. 2001. Proteasome-mediated glucocorticoid receptor degradation restricts transcriptional signaling by glucocorticoids. J. Biol. Chem. 276:42714-42721. [DOI] [PubMed] [Google Scholar]
- 32.Weinstein, R. S. 2001. Glucocorticoid-induced osteoporosis. Rev. Endocr. Metab. Disord. 2:65-73. [DOI] [PubMed] [Google Scholar]
- 33.Weng, L., H. Dai, Y. Zhan, Y. He, S. B. Stepaniants, and D. E. Bassett. 2006. Rosetta error model for gene expression analysis. Bioinformatics 22:1111-1121. [DOI] [PubMed] [Google Scholar]
- 34.Xing, L., and B. F. Boyce. 2005. Regulation of apoptosis in osteoclasts and osteoblastic cells. Biochem. Biophys. Res. Commun. 328:709-720. [DOI] [PubMed] [Google Scholar]
- 35.Yamada, M., A. Hirasawa, S. Shiojima, and G. Tsujimoto. 2003. Granzyme A mediates glucocorticoid-induced apoptosis in leukemia cells. FASEB J. 17:1712-1714. [DOI] [PubMed] [Google Scholar]