

Abstract
Inositol-1,4,5-trisphosphate (InsP3)-mediated calcium signals represent an important mechanism for transmitting external stimuli to the cell. However, information about intracellular spatial patterns of InsP3 itself is not generally available. In particular, it has not been determined how the interplay of InsP3 generation, diffusion, and degradation within complex cellular geometries can control the patterns of InsP3 signaling. Here, we explore the spatial and temporal characteristics of [InsP3]cyt during a bradykinin-induced calcium wave in a neuroblastoma cell. This is achieved by using a unique image-based computer modeling system, Virtual Cell, to integrate experimental data on the rates and spatial distributions of the key molecular components of the process. We conclude that the characteristic calcium dynamics requires rapid, high-amplitude production of [InsP3]cyt in the neurite. This requisite InsP3 spatiotemporal profile is provided, in turn, as an intrinsic consequence of the cell's morphology, demonstrating how geometry can locally and dramatically intensify cytosolic signals that originate at the plasma membrane. In addition, the model predicts, and experiments confirm, that stimulation of just the neurite, but not the soma or growth cone, is sufficient to generate a calcium response throughout the cell.
Keywords: model; calcium; inositol-1,4,5-trisphosphate; fluorescence microscopy; signal transduction
Intracellular signaling is composed of complex biochemical pathways that are characterized by robust switching and feedback mechanisms. It has been recognized (Bray 1997) that to understand such complex systems, computational approaches will be required. For example, the emergent behavior of interacting pathways in several receptor-mediated cellular responses have been uncovered by solving systems of ordinary differential equations describing the rates of individual biochemical steps (Bhalla and Iyengar 1999). Similarly, the high sensitivity of the mitogen-activated protein (MAP) kinase cascade was demonstrated via a numerical analysis of kinetic equations (Huang and Ferrell 1996). Arguably, the most frequent application of computational methods has been toward understanding the dynamics of intracellular calcium, where experimentally observed phenomena, such as waves and oscillations, can be rationalized (e.g., Atri et al. 1993; Li et al. 1995; Sneyd et al. 1995; Klingauf and Neher 1997; Kupferman et al. 1997). While such studies have provided outstanding insights, they often ignore or use idealized geometries for the treatment of diffusion of signaling molecules within the cell. To deal with diffusion in an irregular cell geometry requires the more computationally intensive and mathematically arduous solution of multiple partial differential equations.
A primary mechanism for calcium signaling (Berridge 1993, Berridge 1998) involves receptor-mediated release of inositol-1,4,5-trisphosphate (InsP3) from the inner face of the plasma membrane, followed by its diffusion to a receptor on the ER membrane. This receptor is an InsP3-dependent Ca2+ channel whose opening permits calcium to flow down its concentration gradient from the ER lumen to the cytosol. The interplay of cell shape, the distribution of relevant receptors, and the spatial organization of the ER within a real cell geometry should impact the pattern of InsP3-dependent calcium release. To this end, we have applied a unique computational system for image-based cell biological modeling (Virtual Cell; Schaff et al. 1997, Schaff et al. 1999) to the InsP3-mediated calcium dynamics in differentiated N1E-115 neuroblastoma cells with complex neuronal morphologies. The results point to an important role for cellular geometry in controlling the spatial and temporal patterns of intracellular signals.
Materials and Methods
Calcium Imaging
N1E-115 neuroblastoma cells (obtained from Dr. M. Niremberg, National Institutes of Health, Bethesda, MD) were grown and loaded with the calcium indicator fura-2 as previously described (Bedlack et al. 1992). Images were acquired using a high speed Photometrics CCD camera (frame transfer EEV37 chip) on an inverted Zeiss microscope, controlled by Inovision software on a Silicon Graphics workstation. Cells were bathed in pH-controlled EBSS and maintained at 37°C by means of a plexiglass housing unit built onto the microscope stage. Ratio pairs of 340- and 380-nm excitation were collected for some experiments, with emission passed through a >530-nm filter. Using this acquisition protocol, ratio pairs could be collected approximately once a second. For faster imaging, a single wavelength (380 nm) excitation protocol was used, in which images could be obtained every 65 ms. Relative changes in calcium concentrations were calculated from the fluorescence changes as in Fink et al. 1999. All image analysis was performed on Silicon Graphics workstations using the programs Ratiotool (Inovision Corp.), used for calcium analysis of dual wavelength experiments, and ISee (Inovision Corp.), on which graphical analysis programs were constructed to do the single wavelength analysis. For quantitative InsP3 uncaging, we used NPE-InsP3 and calcium green-1 (CG-1)–loaded cells on an inverted NORAN confocal microscope with UV flashes from a xenon arc lamp attached to a computer-controlled shutter. The procedure is detailed in Fink et al. 1999. All experiments were performed at 37°C.
InsP3 Time Course in a Cell Population
InsP3 mass was calculated using a competitive radioligand binding assay with canine cerebellar microsomes, 10 nM 3H-InsP3, and various concentrations of nonradioactive InsP3 (Benevolensky et al. 1994). Effects of inhibitors were calculated by Scatchard analysis. Intracellular volume measurements were performed by determining excluded volumes with 3H-insulin (Pharmacia Biotech, Inc.) relative to total volume determined with 14C-urea.
Model Construction
Full details of the model and citations to the origins of all the parameters are available at http://www.nrcam.uchc.edu (The National Resource for Cell Analysis and Modeling, [NRCAM], 1999). Throughout, corrections to the two-dimensional simulations are made to account for true three-dimensional surface to volume ratios by approximating the soma as a hemisphere and the neurite as a hemicylinder (see Reduction of the Model to 2 Dimensions, The National Resource for Cell Analysis and Modeling, 1999). Methods for antibody staining, analysis of relative intracellular antigen densities, and determination of cytosolic indicator concentrations are detailed in Fink et al. 1998.
Focal Application of Bradykinin
Glass pipettes were filled with a solution containing 500 nM bradykinin (BK) and 5 μM fura-2 (pentapotassium salt) in EBSS buffered to pH 7.4 with 10 mM Hepes. Cells were loaded with fura-2 and mounted on a specially constructed chamber that provides a steady flow of EBSS buffer solution across the cell. The loaded pipette was directed with a micromanipulator such that the ejected solution was oriented in the flow so that only a chosen segment of the cell (soma, neurite, or distal neurite) was briefly exposed to BK. The ejected puff was visualized by the fluorescence of the coejected fura-2. Ratio images were then collected and calibrated as described.
Results and Discussion
When stimulated with a saturating concentration of BK, a nonapeptide neuromodulator, N1E-115 neuroblastomas show a highly reproducible calcium response (Fig. 1 a). After a brief latency (mean ± SEM; 2.97 ± 0.23 s; n = 16), a calcium increase started in the neurite and propagated bidirectionally as a wave towards the soma and growth cone. The wave typically traversed the soma with an average velocity of 39.2 ± 3.7 μm/s (n = 16), and peak calcium concentrations approximating 1 μM (1190 ± 46 nM; n = 21). The calcium wave propagated more quickly through the neurite (147.8 ± 31.3 μm/s; n = 9; P = 0.0001, compared with wave velocity in the soma) although the amplitude of the calcium response was not significantly different than observed in the soma (1106 ± 29 nM; n = 17; P > 0.05). [Ca2+]cyt relaxation to basal levels occurred within 30 s of stimulation. Subsequent stimulations with BK did not evoke new calcium signals even after BK washout. This calcium response is known to be mediated by InsP3 generation (Iredale et al. 1992; Coggan and Thompson 1995) and subsequent release of calcium from ER stores. The amplitude of the calcium response is not dependent upon extracellular calcium, indicating that the elevation of [Ca2+]cyt comes strictly from intracellular stores. In addition, all calcium efflux from the ER is through InsP3-sensitive channels, since this cell type lacks ryanodine receptors (calcium-induced calcium release; Coggan and Thompson 1995).
Figure 1.

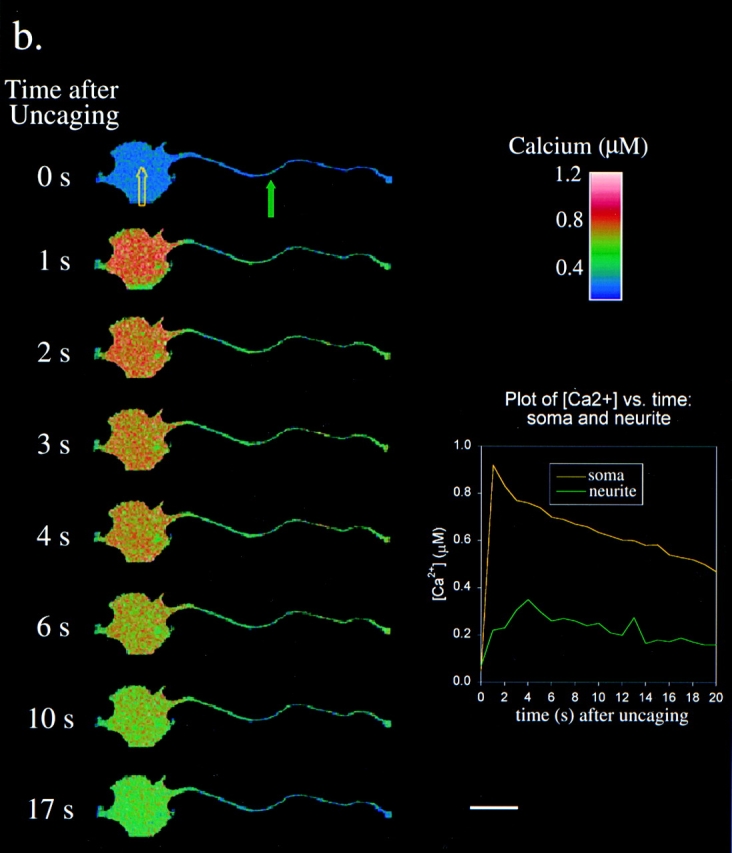
a, BK-induced calcium wave in an N1E-115 neuroblastoma. At time = 0, 500 nM BK was externally applied to the bathing medium of a cell stained with fura-2. Fluorescence from the 380-nm excitation was collected with a cooled CCD camera, converted to a relative [Ca2+] change, and displayed in pseudocolored form. For regions of interest in the soma and neurite (indicated by the colored rectangles), the relative change in [Ca2+] versus time was plotted in the lower right corner. Bar, 25 μm. b, Calcium dynamics after global InsP3 uncaging in an N1E-115 neuroblastoma. Cells were microinjected with CG-1 and NPE-InsP3, and CG-1 fluorescence was measured on a Zeiss LSM410 confocal microscope. At time = 4 s, the cell was uniformly exposed to UV light for 500 ms using a raster scanned UV argon ion laser (364 nm). For regions of interest in the soma and neurite (indicated by the colored arrows), [Ca2+] versus time was plotted in the lower right corner. Bar, 25 μm.
To determine the calcium response to an InsP3 signal with well-controlled spatial and temporal characteristics, caged NPE-InsP3 was microinjected into the cell (along with CG-1 for calcium imaging) and photoreleased by exposing the entire cell to a brief flash of UV light. As shown in Fig. 1 b, calcium levels increased throughout the cell. However, the levels of calcium increase were substantially higher in the soma than in the neurite. This contrasts sharply with the responses to BK stimulation in Fig. 1 a, where the calcium signal has a uniform 1-μM amplitude throughout the cell.
Further, to determine the dependence of the [Ca2+]cyt signal on [InsP3]cyt in each region of the cell, we performed quantitative InsP3 uncaging experiments (Khodakhah and Ogden 1993; Fink et al. 1999), followed by application of BK to the same cells. A dose-response relationship can be observed between calcium release and [InsP3]cyt (Fig. 2 a), which could be fit with the Hill equation (Fig. 2 b; mean Hill coefficient for nine cells, 2.5 ± 0.5). This is consistent with other measurements on the [InsP3]cyt dependence of calcium release (Oancea and Meyer 1996). Subsequent to the uncaging flashes, the BK-evoked calcium response in the soma and neurite was compared with the dose-response. Note that the BK-induced calcium signal in the soma corresponds to uncaged [InsP3] of 2.1 ± 0.1 μM (n = 11 cells). However, BK-induced [Ca2+]cyt signals at the initiation point in the neurite could only be matched by uncaging InsP3 in the range of 5–10 μM (7.0 ± 0.8 μM; mean ± SEM; n = 9 cells; Fig. 2 c). This result is consistent with the lower amplitude of the calcium response to a uniform pulse of uncaged InsP3 in the neurite compared with the soma (Fig. 1 b), and indicates that the neurite requires three to four times as much InsP3 as the soma to produce the calcium response evoked by the physiological stimulus of Fig. 1 a.
Figure 2.
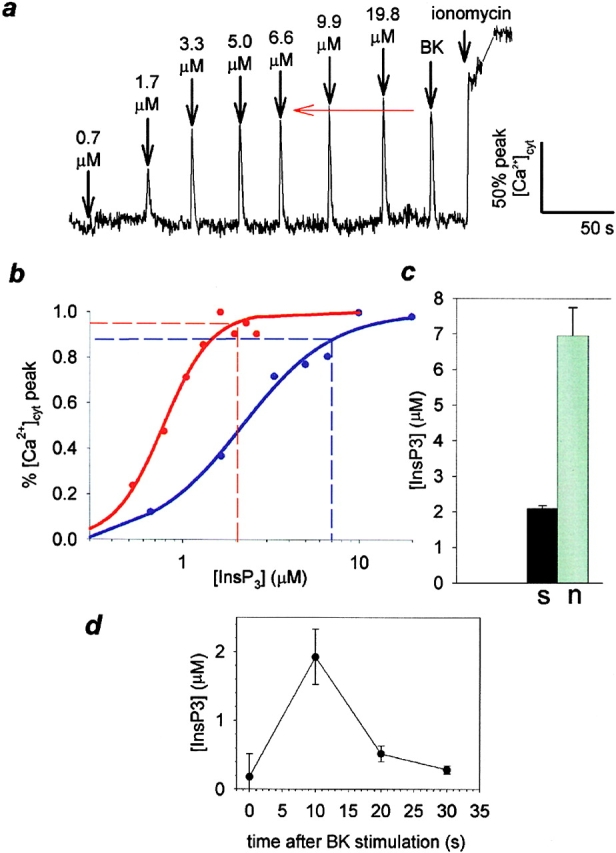
Measurement of [InsP3]cyt. a, Cells were microinjected with CG-1 and NPE-InsP3, and CG-1 fluorescence was measured on the confocal microscope. Fluorescence intensity values were converted to relative [Ca2+] and plotted against time. The cell was subjected, in turn, to increasing doses of InsP3 released by UV light flashes of 20–80 ms, 500 nM BK application to the medium, and treatment with 10 μM ionomycin. A typical experiment, in which the neurite signal is followed, is shown here. The gray line connecting the tracing after addition of ionomycin indicates a period during which the cell was refocused. b, For two cells where neurite (blue) and soma (red) are monitored, relative peak [Ca2+] for each uncaging event has been plotted against [InsP3]uncaged (solid circles). The data has been fit (solid curve) with the Hill equation (R = 0.99). A dashed horizontal line was drawn indicating the [Ca2+]cyt response produced by BK stimulation in each region. A corresponding pair of lines were dropped from the Hill equation curve, indicating the [InsP3] necessary to produce the BK-induced calcium peak. c, Mean values (± SEM) of estimated InsP3 production by BK in soma (black) and neurite (gray) are compared in a bar graph (P < 0.001). d, [InsP3]cyt was measured in a N1E-115 neuroblastoma cell population during a BK-induced calcium wave using competitive radioligand binding.
Competitive radioligand binding techniques were employed to approximate the time course of the InsP3 signal during the BK-stimulated calcium wave for a population of differentiated N1E-115 neuroblastoma cells (Fig. 2 d). These values have been corrected for cellular volume and the presence of inhibitory factors in the cytosol. The basal level of InsP3 was determined to be 0.16 μM, rising to a peak concentration of 2 μM within 10 s after stimulation with BK. InsP3 returned to baseline after an additional 10 s. The amplitude of this InsP3 signal is consistent with the quantitative uncaging measurements (Fig. 2 c). The time course of [InsP3]cyt parallels that of [Ca2+]cyt, and is indicative of a rapid (half-life <10 s) degradation time for cytosolic InsP3, in agreement with previous estimates (Wang et al. 1995).
To understand how the neurite produces a higher InsP3 signal than the soma, and why it requires this higher concentration of InsP3 to set off a calcium wave, we used a computational system for cell biological modeling (Schaff et al. 1997) to construct a model based on experimental data for geometrical, electrophysiological, and biochemical components of the system. In Fig. 3 a, the geometric distributions of critical receptors (BK, InsP3, and SERCA) are mapped onto a geometry based on the cell in Fig. 1 a. This information was compiled through analysis of confocal micrographs of immunofluorescence distribution, using the quantitative procedures developed by Fink et al. 1998. The other inputs to the model comprised the individual biochemical and electrophysiological processes contributing to the BK-induced calcium wave. These included: flux of InsP3 into the cytosol from the plasma membrane; rate of InsP3 degradation; calcium uptake rate of SERCA pumps; [InsP3]cyt and [Ca2+]cyt binding to the InsP3-receptor and the consequent activation and inactivation of calcium efflux from the ER; calcium buffering in the cytosol by mobile and fixed buffers; and diffusion coefficients for InsP3, mobile buffers, and calcium.
Figure 3.


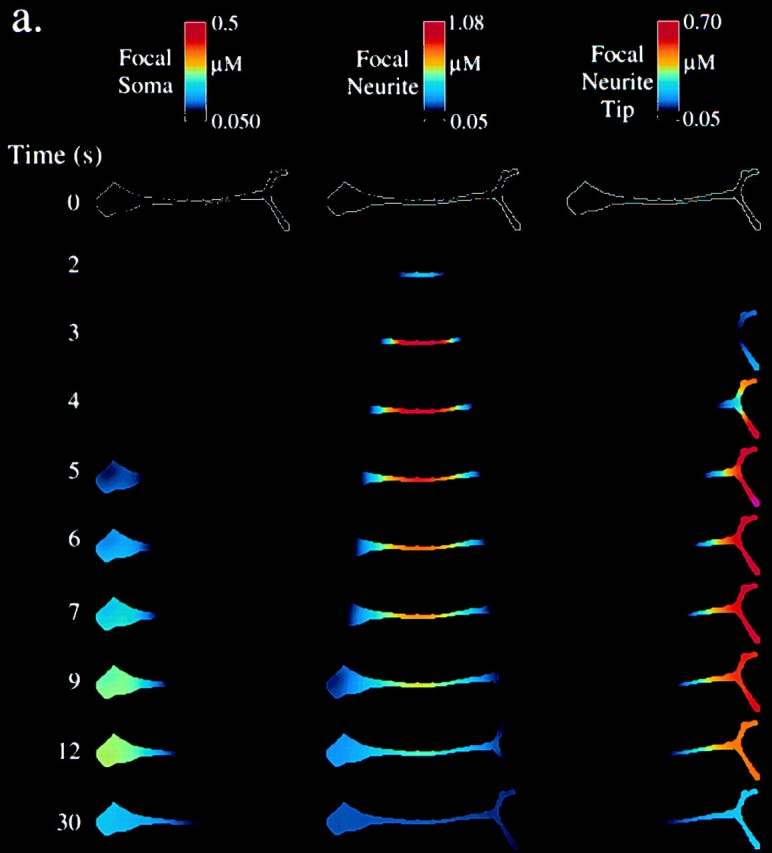
Modeling of observed calcium dynamics in N1E-115 neuroblastoma cells. a, Distributions of BKR and ER (SERCA2/InsP31-R) used for modeling. Cells were stained for antibodies against BKR, SERCA2, InsP31-R, and ER. Relative fluorescence intensities were measured on the confocal microscope and adjusted for convolution artifacts (Fink et al. 1998). Intensities were scaled such that the left half soma is equal to 1.0, and plotted (mean ± SEM; n = 20 cells) for six representative regions of the cell. There was no statistical difference (ANOVA; P > 0.05) between the distributions of InsP31-R, SERCA2, and ER, so they were plotted together. b, Simulation results for [Ca2+] and [InsP3] in N1E-115 neuroblastoma cells (as modeled in a). Simulations were run for three conditions: global application of a saturating concentration of BK with the average receptor and ER distribution as shown in a; global application of a saturating concentration of BK with average ER (and InsP3-R and SERCA) distributions, but with a uniform plasma membrane BKR distribution; and a step increase of [InsP3] to 1.5 μM uniformly throughout the cytosol analogous to the uncaging experiment in Fig. 1 b. [InsP3] and [Ca2+] have been pseudocolor scaled according to the color bar at the top of each column. Time is seconds after the simulated stimulus event (either BK exposure or InsP3 uncaging). Below each column are plots of [InsP3] or [Ca2+] versus time for a point in the soma or the neurite (indicated by the yellow or green dots on the 1.0 s image of the first column). For the [InsP3] versus time plot for the average receptor distribution experiment, also plotted are the [InsP3] values indicative of the average [InsP3] for the whole cell (dotted white line) and the experimental [InsP3] values determined with radioligand binding as shown in Fig. 2 d. This plot is taken to 30 s, whereas the other plots are all to 12 s.
The results of the simulation can then be displayed as time-dependent maps of any of the variables. Fig. 3 b shows the results of the simulation for the response of InsP3 and Ca2+ to BK (first four columns). The first two columns represent the results for the average receptor distributions (from Fig. 3 a). The prediction for [Ca2+]cyt can be directly compared with the experiment in Fig. 1 a. Consistent with experiment, the initial calcium increase is observed in the middle of the neurite after 2.2 s, spreading bidirectionally to the soma and growth cone, and reaching a peak [Ca2+]cyt everywhere of ∼1 μM. It should be noted that the simulations in Fig. 3 b were carried out with the average receptor distributions, which clearly would not necessarily pertain to the particular cell in Fig. 1 a. Close to an exact match between this individual experiment and the simulation could be achieved if the receptor distributions in the model were permitted to vary within one SD from their means in the parameter space (data not shown). On the other hand, the columns, labeled uniform BKR, show the results of simulations where the BK receptor (BKR) density is set to a uniform distribution along the plasma membrane. The general features of the calcium wave remain unchanged, indicating that the surface receptor distribution is not a critical determining factor.
Although an elegant indirect method has been described for monitoring intracellular InsP3 (Hirose et al. 1999), there is no available fluorescent indicator for [InsP3]. So, the model can provide a unique view of the spatial and temporal distribution of this key metabolite. The calculated [InsP3]cyt dynamics show a rapid buildup in the neurite to a peak of ∼10 μM, whereas [InsP3]cyt in the soma increases more slowly, and to lower peak concentrations (∼3 μM). The production of InsP3 is much faster than its diffusion throughout the intracellular volume and also outpaces the rate of degradation through putative cytosolic kinase and phosphatase based pathways. Therefore, because InsP3 is produced from the plasma membrane, the cytosolic concentrations of InsP3 will rise faster and with greater maximum amplitude in the neurite than in the soma. This is primarily because of the high surface to volume ratio of the neurite compared with the soma, with the higher surface density of BKR in the proximal neurite serving only to somewhat focus the site of initiation (compare the second and fourth columns of Fig. 3 b). When the [InsP3] values obtained from our radioligand binding experiments (as shown in Fig. 2) are plotted against the simulated average [InsP3] for the entire cell, an excellent match was obtained (displayed in the plot at the bottom of the second column in Fig. 3 b). Of course, because the soma contains the highest proportion of the cell volume, the average [InsP3] at any time is only slightly higher than the [InsP3] in the soma. Indeed, in addition to providing a picture of the spatiotemporal profile of [InsP3] within the cell, our analysis allows us to extract rates for the stimulated flux of InsP3 from the plasma membrane and degradation in the cytosol from the constraints imposed by the data of Fig. 2 d.
We also modeled (Fig. 3 b, last column) uniform InsP3 uncaging throughout the intracellular volume. In agreement with the experiment (e.g., Fig. 1 b), the simulation shows [Ca2+]cyt to be significantly higher in the soma than in the neurite, and no calcium wave behavior is evident. The higher calcium levels in the soma result from its greater density of ER and InsP3R as established in our immunofluorescence analysis (Fig. 3 a). This also explains why a higher level of InsP3 is required in the neurite to produce a Ca2+ signal comparable to that produced in the soma. Thus, the combination of experiment and modeling reveals the interplay of structural features which both produce and require a higher [InsP3]cyt in the neurite after BK stimulation. Despite the higher amplitude of [InsP3]cyt in the neurite, the amplitude of the calcium response remains relatively uniform throughout the cell because the calcium stores are biased toward a higher density in the soma.
To further probe whether this amplified [InsP3] in the neurite is necessary and sufficient for initiation and propagation of a calcium wave, we modeled the condition of a local BK stimulation in three distinct cell regions: soma, middle of the neurite, and growth cone (or distal neurite). The results of these simulations are shown in Fig. 4 a. When BK is added to only the soma, elevation of calcium levels occur after a long delay, no wave is generated, and peak [Ca2+]cyt is low (∼500 nM). When BK is applied to the neurite, a calcium wave propagates in both directions; whereas [Ca2+]cyt in the neurite is comparable to that produced by global BK application, [Ca2+]cyt in the soma is lower (∼500 nM). Finally, when the application of BK is simulated for only the distal neurite, an immediate calcium increase is seen in that region. However, the wave fails to propagate far up the neurite, and [Ca2+]cyt soon returns to baseline levels. To check these predictions, we performed a series of experiments in which BK was focally applied by pressure ejection to the cells (Fig. 4 b). When BK was focally applied to the soma, a gradual increase of calcium was seen in the soma, which failed to propagate down the neurite as a wave (observed in 7/8 cells). When BK is focally applied to only the neurite, a calcium wave is typically initiated (9/13 cells), although [Ca2+]cyt in the soma didn't reach the levels seen with global BK application. Finally, when BK is focally applied to only the most distal neurite (or growth cone), a local elevation of calcium was observed (7/11 cells), which failed to propagate as a calcium wave to the soma. Together, these experiments validate the predictions made by the simulations, and show that the morphologically enhanced InsP3 signal in the neurite is necessary and sufficient for initiation and propagation of a calcium wave.
Figure 4.
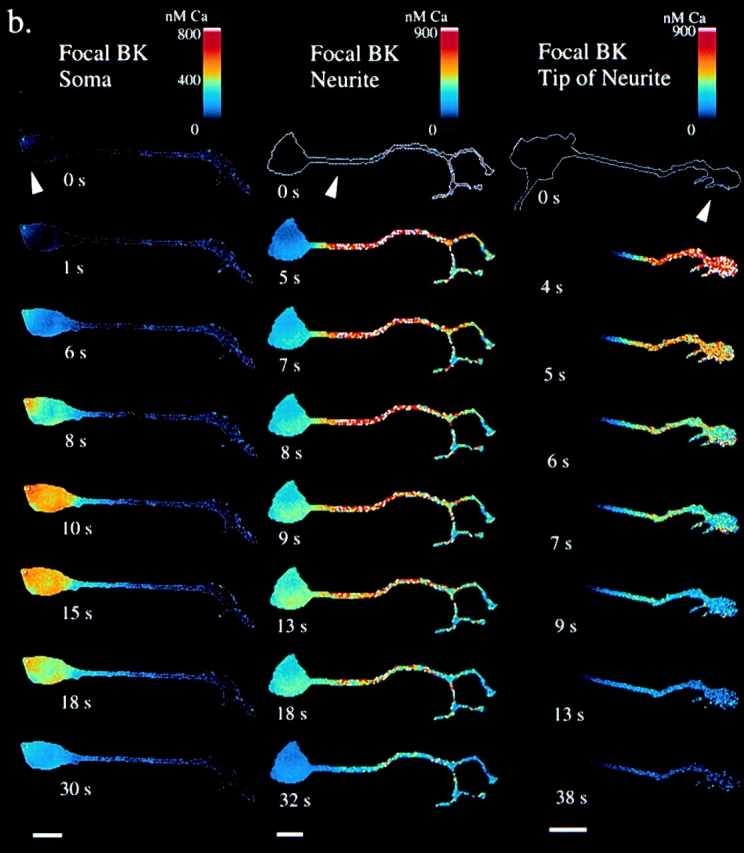
Localized BK application. a, Simulations. [Ca2+]cyt is shown for simulations of focal 500 nM BK application to the soma, neurite, and growth cone. b, Experiments. Cells were loaded with fura-2, 340/380 ratio pairs collected with a cooled CCD camera, and results displayed in pseudocolored [Ca2+]. 500-nM BK was focally applied (arrowheads) by pressure ejection from a micropipette in a flow chamber at time = 0 s. Bars, 25 μm. Note that the pseudocolor [Ca2+] scales are not identical.
This study illustrates how an interplay of structural, morphological, and geometric features can play a critical role in defining the spatiotemporal characteristics of intracellular signaling. Such considerations should be of even greater importance for InsP3-dependent signaling in primary neurons because of their even greater morphological complexity. For example, it has been previously reported that Purkinje neurons, cells with a particularly extensive dendritic arborization, require very high (>10 μM) concentrations of uncaged InsP3 to elicit a calcium response (Khodakhah and Ogden 1993). The very high surface to volume ratio that exists in the dendritic tree may underlie the ability of the Purkinje cell to deliver such high InsP3 concentrations in response to metabotropic synaptic inputs. Of course, these ideas may be applicable beyond InsP3-dependent processes. For example, fine membranous structures, such as lamellipodia and filopodia, play a role in pathfinding and directed motility (Theriot and Mitchison 1992; Davenport et al. 1993; Zheng et al. 1996). The intensified signals that are possible in such confined intracellular spaces may represent a common mechanism for such specialized functions. Exploration of these ideas will be facilitated by studies that intimately combine quantitative image-based models with experiment.
Acknowledgments
We would like to thank B. Ehrlich, M. Terasaki, J. Keizer, and J. Lederer for helpful discussions and critical review.
We are pleased to acknowledge support from the National Institutes of Health through grants from National Institute for General Medical Science (GM35063) and National Center for Research Resources (RR13186).
Footnotes
Abbreviations used in this paper: BK, bradykinin; BKR, BK receptor; CG-1, calcium green-1; InsP3, inositol-1,4,5-trisphosphate; MAP, mitogen-activated protein.
References
- Atri A., Amundson J., Clapham D., Sneyd J. A single-pool model for calcium oscillations and waves in the Xenopus laevis oocyte. Biophys. J. 1993;65:1727–1739. doi: 10.1016/S0006-3495(93)81191-3. [DOI] [PMC free article] [PubMed] [Google Scholar]
- Bedlack R.S., Wei M.-d., Loew L.M. Localized membrane depolarizations and localized intracellular calcium influx during electric field-guided neurite growth. Neuron. 1992;9:393–403. doi: 10.1016/0896-6273(92)90178-g. [DOI] [PubMed] [Google Scholar]
- Benevolensky D., Moraru I., Watras J. Micromolar calcium reduces the affinity of the inositol 1,4,5-trisphosphate receptor in smooth muscle. Biochem. J. 1994;299:631–636. doi: 10.1042/bj2990631. [DOI] [PMC free article] [PubMed] [Google Scholar]
- Berridge M.J. Inositol trisphosphate and calcium signalling. Nature. 1993;361:315–325. doi: 10.1038/361315a0. [DOI] [PubMed] [Google Scholar]
- Berridge M.J. Neuronal calcium signaling. Neuron. 1998;21:13–26. doi: 10.1016/s0896-6273(00)80510-3. [DOI] [PubMed] [Google Scholar]
- Bhalla U.S., Iyengar R. Emergent properties of networks of biological signaling pathways. Science. 1999;283:381–387. doi: 10.1126/science.283.5400.381. [DOI] [PubMed] [Google Scholar]
- Bray D. Reductionism for biochemistshow to survive the protein jungle. Trends Biochem. Sci. 1997;22:325–326. doi: 10.1016/s0968-0004(97)01083-9. [DOI] [PubMed] [Google Scholar]
- Coggan J.S., Thompson S.H. Intracellular calcium signals in response to bradykinin in individual neuroblastoma cells. Am. J. Physiol. 1995;269:C841–C848. doi: 10.1152/ajpcell.1995.269.4.C841. [DOI] [PubMed] [Google Scholar]
- Davenport R.W., Dou P., Rehder V., Kater S.B. A sensory role for neuronal growth cone filopodia. Nature. 1993;361:721–724. doi: 10.1038/361721a0. [DOI] [PubMed] [Google Scholar]
- Fink C., Morgan F., Loew L.M. Intracellular fluorescent probe concentrations by confocal microscopy. Biophys. J. 1998;75:1648–1658. doi: 10.1016/S0006-3495(98)77607-6. [DOI] [PMC free article] [PubMed] [Google Scholar]
- Fink C.C., Slepchenko B., Loew L.M. Determination of time-dependent inositol-1,4,5-trisphosphate concentrations during calcium release in a smooth muscle cell. Biophys. J. 1999;77:617–628. doi: 10.1016/S0006-3495(99)76918-3. [DOI] [PMC free article] [PubMed] [Google Scholar]
- Hirose K., Kadowaki S., Tanabe M., Takeshima H., Iino M. Spatiotemporal dynamics of inositol 1,4,5-trisphosphate that underlies complex Ca2+ mobilization patterns. Science. 1999;284:1527–1530. doi: 10.1126/science.284.5419.1527. [DOI] [PubMed] [Google Scholar]
- Huang C.Y., Ferrell J.E., Jr. Ultrasensitivity in the mitogen-activated protein kinase cascade. Proc. Natl. Acad. Sci. USA. 1996;93:10078–10083. doi: 10.1073/pnas.93.19.10078. [DOI] [PMC free article] [PubMed] [Google Scholar]
- Iredale P., Martin K., Hill S., Kendall D. Agonist-induced changes in [Ca2+]i in N1E-115 cellsdifferential effects of bradykinin and carbachol. Eur. J. Pharmacol. 1992;226:163–168. doi: 10.1016/0922-4106(92)90178-x. [DOI] [PubMed] [Google Scholar]
- Khodakhah K., Ogden D. Functional heterogeneity of calcium release by inositol trisphosphate in single Purkinje neurons, cultured cerebellar astrocytes, and peripheral tissues. Proc. Natl. Acad. Sci. USA. 1993;90:4976–4980. doi: 10.1073/pnas.90.11.4976. [DOI] [PMC free article] [PubMed] [Google Scholar]
- Klingauf J., Neher E. Modeling buffered Ca2+ diffusion near the membraneimplications for secretion in neuroendocrine cells. Biophys. J. 1997;72:674–690. doi: 10.1016/s0006-3495(97)78704-6. [DOI] [PMC free article] [PubMed] [Google Scholar]
- Kupferman R., Mitra P.P., Hohenberg P.C., Wang S.S.-H. Analytical calculation of calcium wave characteristics. Biophys. J. 1997;72:2430–2444. doi: 10.1016/S0006-3495(97)78888-X. [DOI] [PMC free article] [PubMed] [Google Scholar]
- Li Y.X., Keizer J., Stojilkovic S.S., Rinzel J. Ca2+ excitability of the ER membranean explanation for IP3-induced Ca2+ oscillations. Am. J. Physiol. 1995;269:C1079–C1092. doi: 10.1152/ajpcell.1995.269.5.C1079. [DOI] [PubMed] [Google Scholar]
- The National Resource for Cell Analysis and Modeling (NRCAM). Model for Simulations of a Calcium Wave in N1E-115 1999. uchc.edu; http://www.nrcam [Google Scholar]
- Oancea E., Meyer T. Reversible desensitization of inositol triphosphate-induced calcium release provides a mechanism for repetitive calcium spikes. J. Biol. Chem. 1996;271:17253–17260. doi: 10.1074/jbc.271.29.17253. [DOI] [PubMed] [Google Scholar]
- Schaff J., Fink C.C., Slepchenko B., Carson J.H., Loew L.M. A general computational framework for modeling cellular structure and function. Biophys. J. 1997;73:1135–1146. doi: 10.1016/S0006-3495(97)78146-3. [DOI] [PMC free article] [PubMed] [Google Scholar]
- Schaff J.C., Slepchenko B.M., Loew L.M. Physiological modeling with the virtual cell framework Johnson M. Methods in Enzymology 1999. Academic Press; San Diego: In press [DOI] [PubMed] [Google Scholar]
- Sneyd J., Keizer J., Sanderson M.J. Mechanisms of calcium oscillations and wavesa quantitative analysis. FASEB J. 1995;9:1463–1472. doi: 10.1096/fasebj.9.14.7589988. [DOI] [PubMed] [Google Scholar]
- Theriot J.A., Mitchison T.J. Comparison of actin and cell surface dynamics in motile fibroblasts. J. Cell Biol. 1992;118:367–377. doi: 10.1083/jcb.119.2.367. [DOI] [PMC free article] [PubMed] [Google Scholar]
- Wang S.S.-H., Alousi A.A., Thompson S.H. The lifetime of inositol 1,4,5-trisphosphate in single cells. J. Gen. Physiol. 1995;105:149–171. doi: 10.1085/jgp.105.1.149. [DOI] [PMC free article] [PubMed] [Google Scholar]
- Zheng J.Q., Wan J.J., Poo M.M. Essential role of filopodia in chemotropic turning of nerve growth cone induced by a glutamate gradient. J. Neurosci. 1996;16:1140–1149. doi: 10.1523/JNEUROSCI.16-03-01140.1996. [DOI] [PMC free article] [PubMed] [Google Scholar]